Microsoft
D
Dolphin Research

OpenAI's 20bn revenue gap sparks uproar; real impact looks limited — a sentiment false alarm.

The bearish headline that OpenAI's ARR went from 70bn to 50bn triggered a global pullback in AI plays.

Dolphin Research offers a quick take on where expectations diverge.

1) The 70bn vs 50bn gap mostly reflects definitional differences rather than a real shortfall. Many leading model vendors periodically disclose ARR, but methodology matters — gross vs net revenue, annualizing a 28-day avg x12 vs a single recent week x52, etc.

Disclosure timing matters too, e.g., whether it follows a blockbuster flagship launch or a promotion; without that context, cross-company comparisons are not apples-to-apples.

1 SOpenAI SearchGPT ● Q What are you looking for?
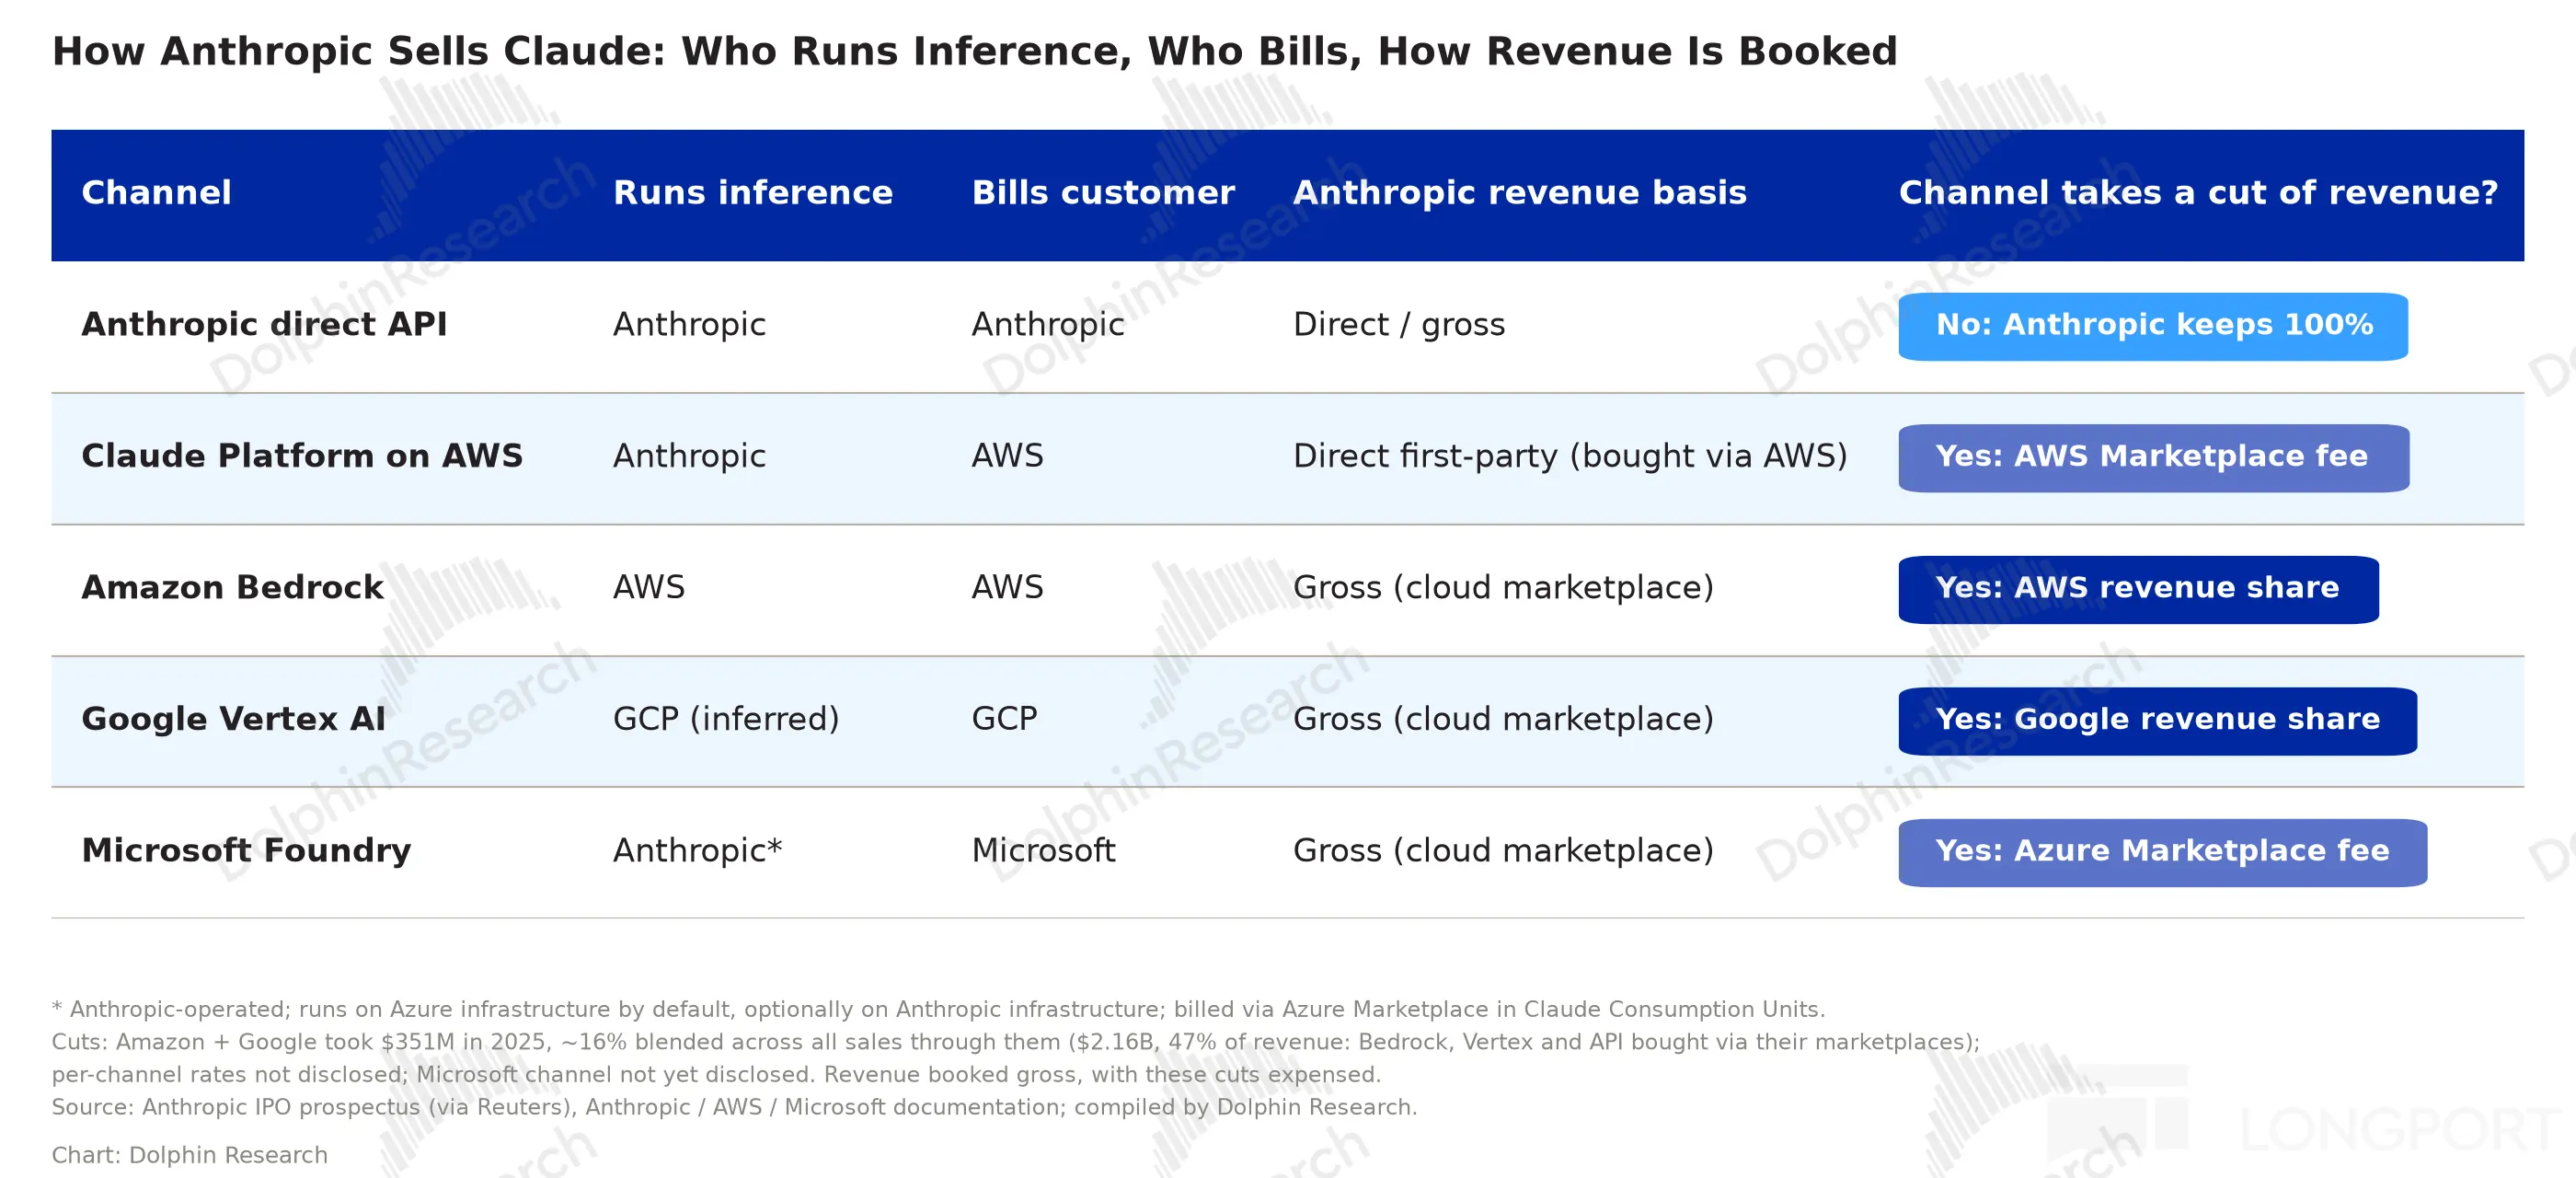
How Anthropic Sells Claude: Who Runs Inference, Who Bills, How Revenue Is Booked
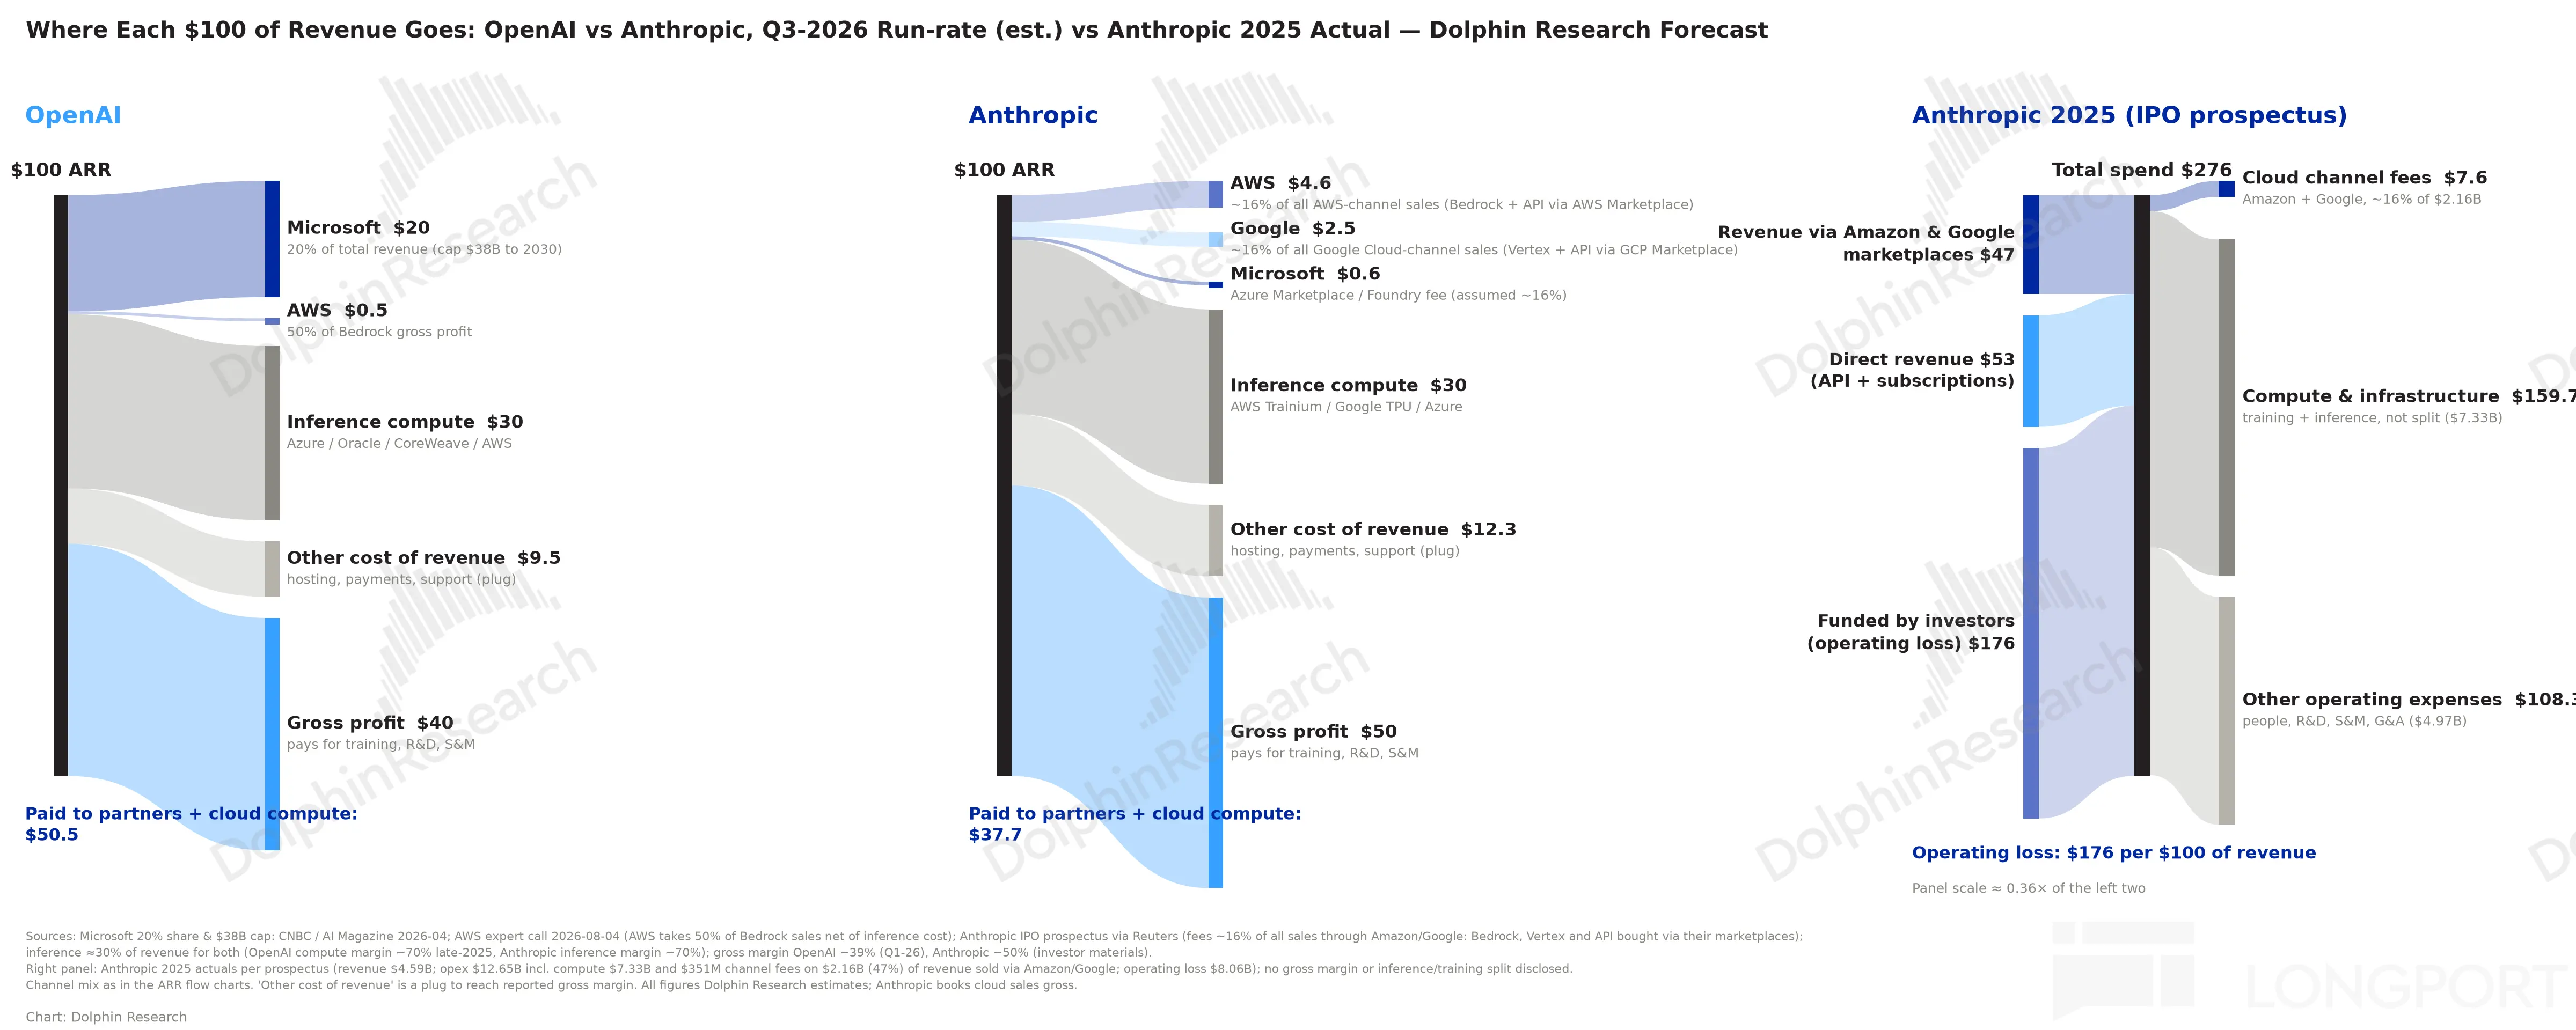
Where Each $100 of Revenue Goes: OpenAI vs Anthropic,Q3-2026 Run-rate (est.) vs
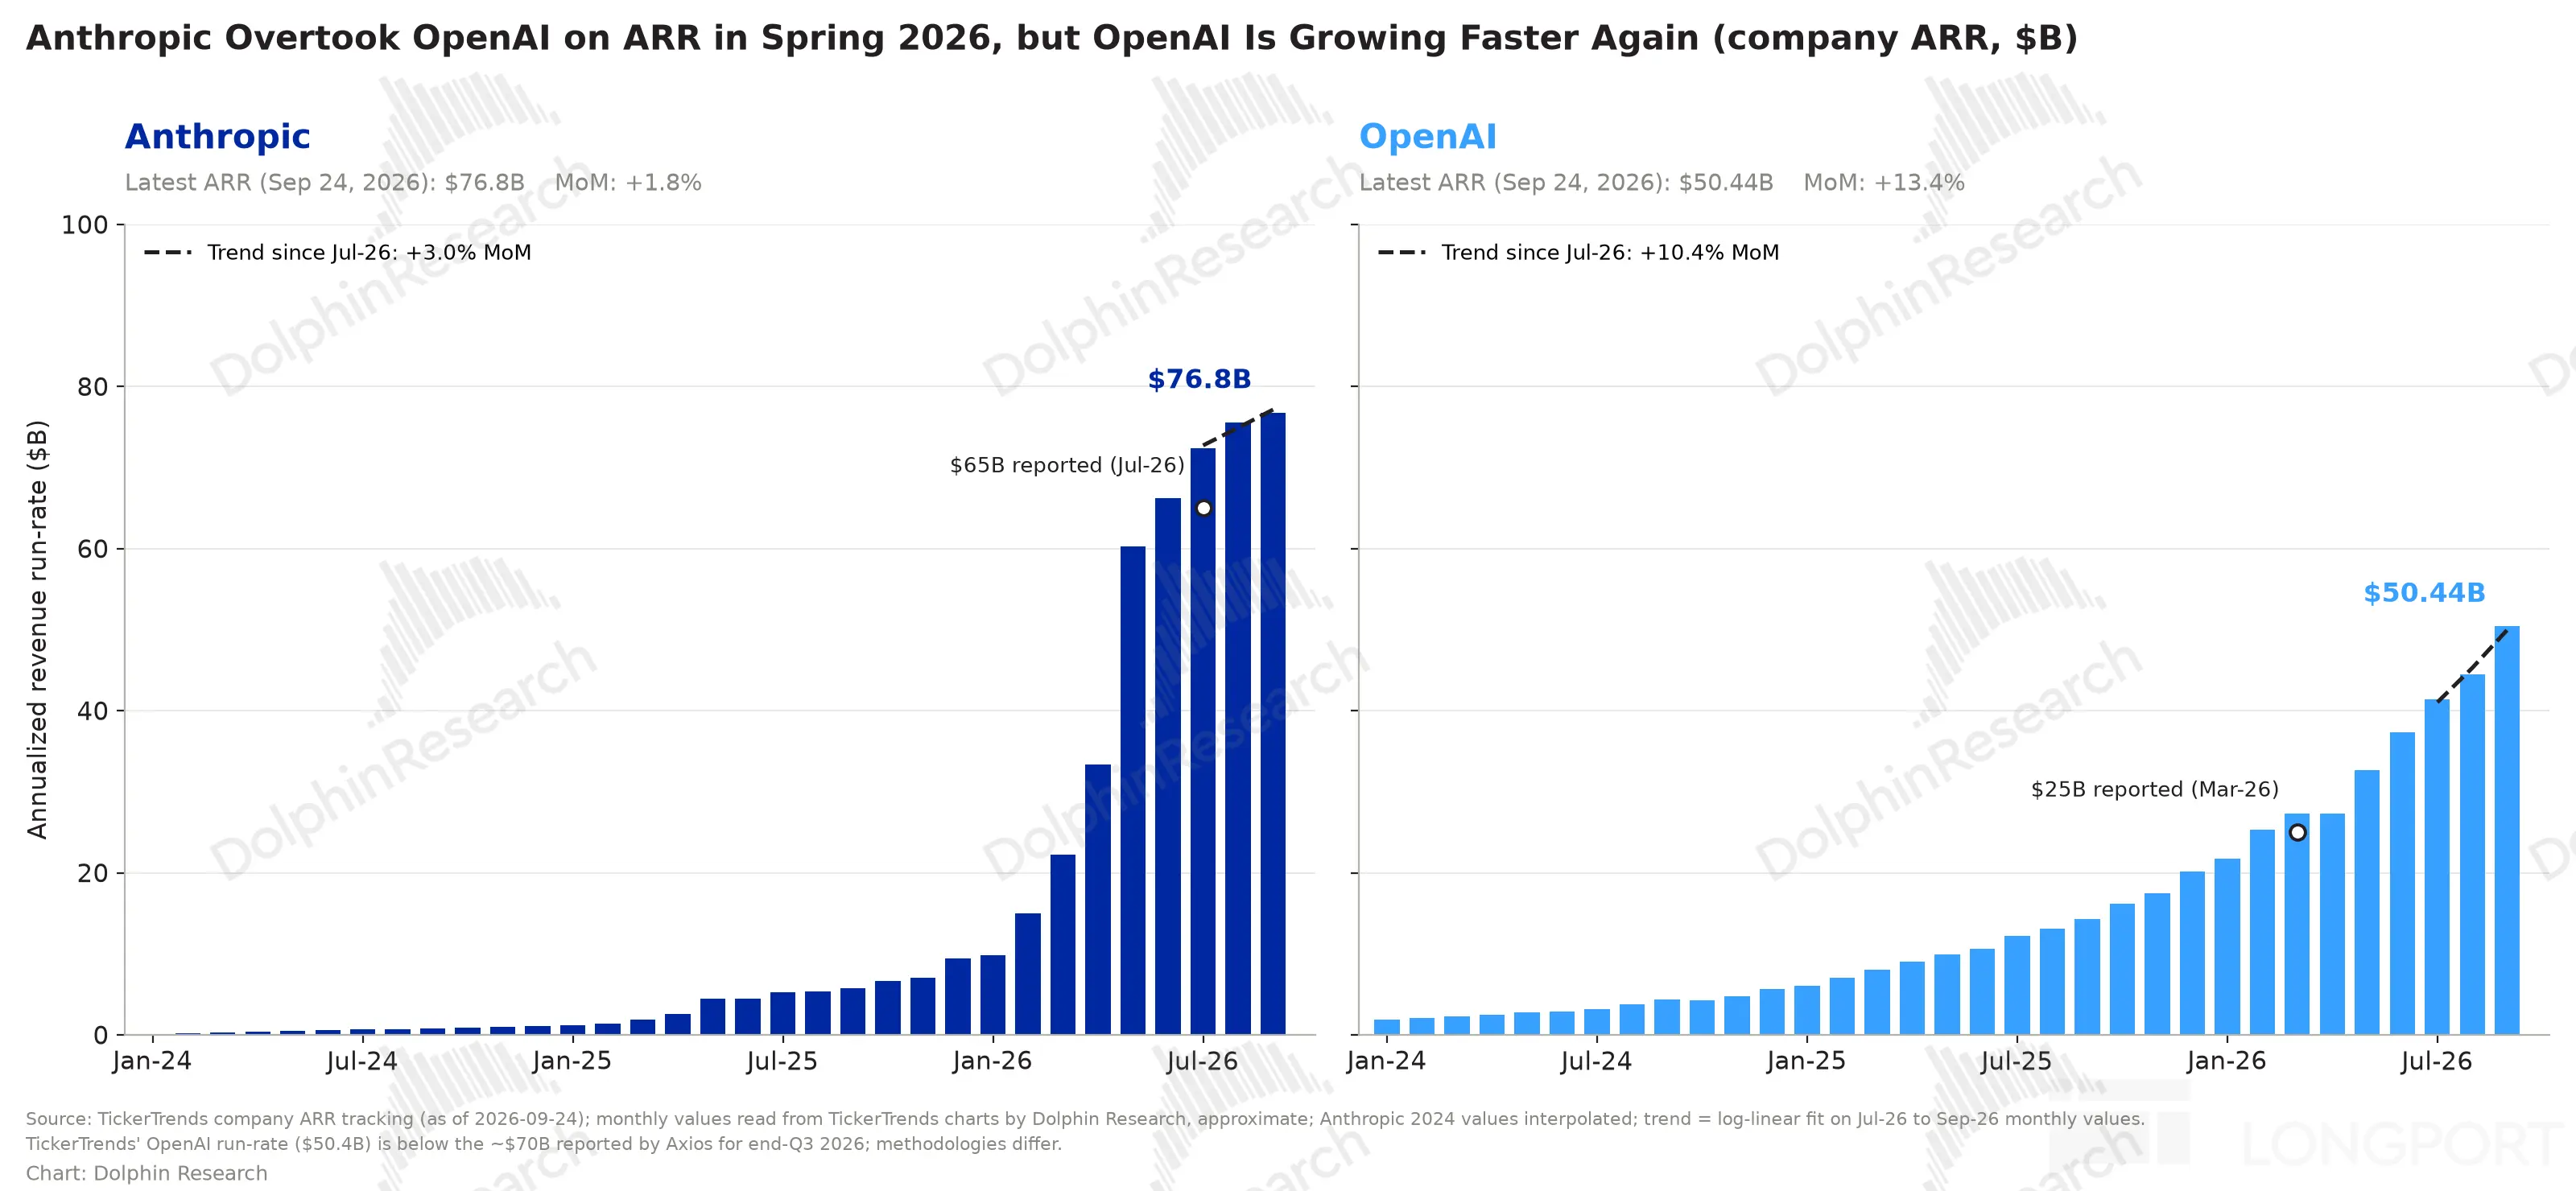
Anthropic Overtook OpenAI on ARR in Spring 2026, but OpenAI Is Growing Faster Ag+2
D
Dolphin Research

MSFT: Tides Turn — Old Guard Back in Favor?

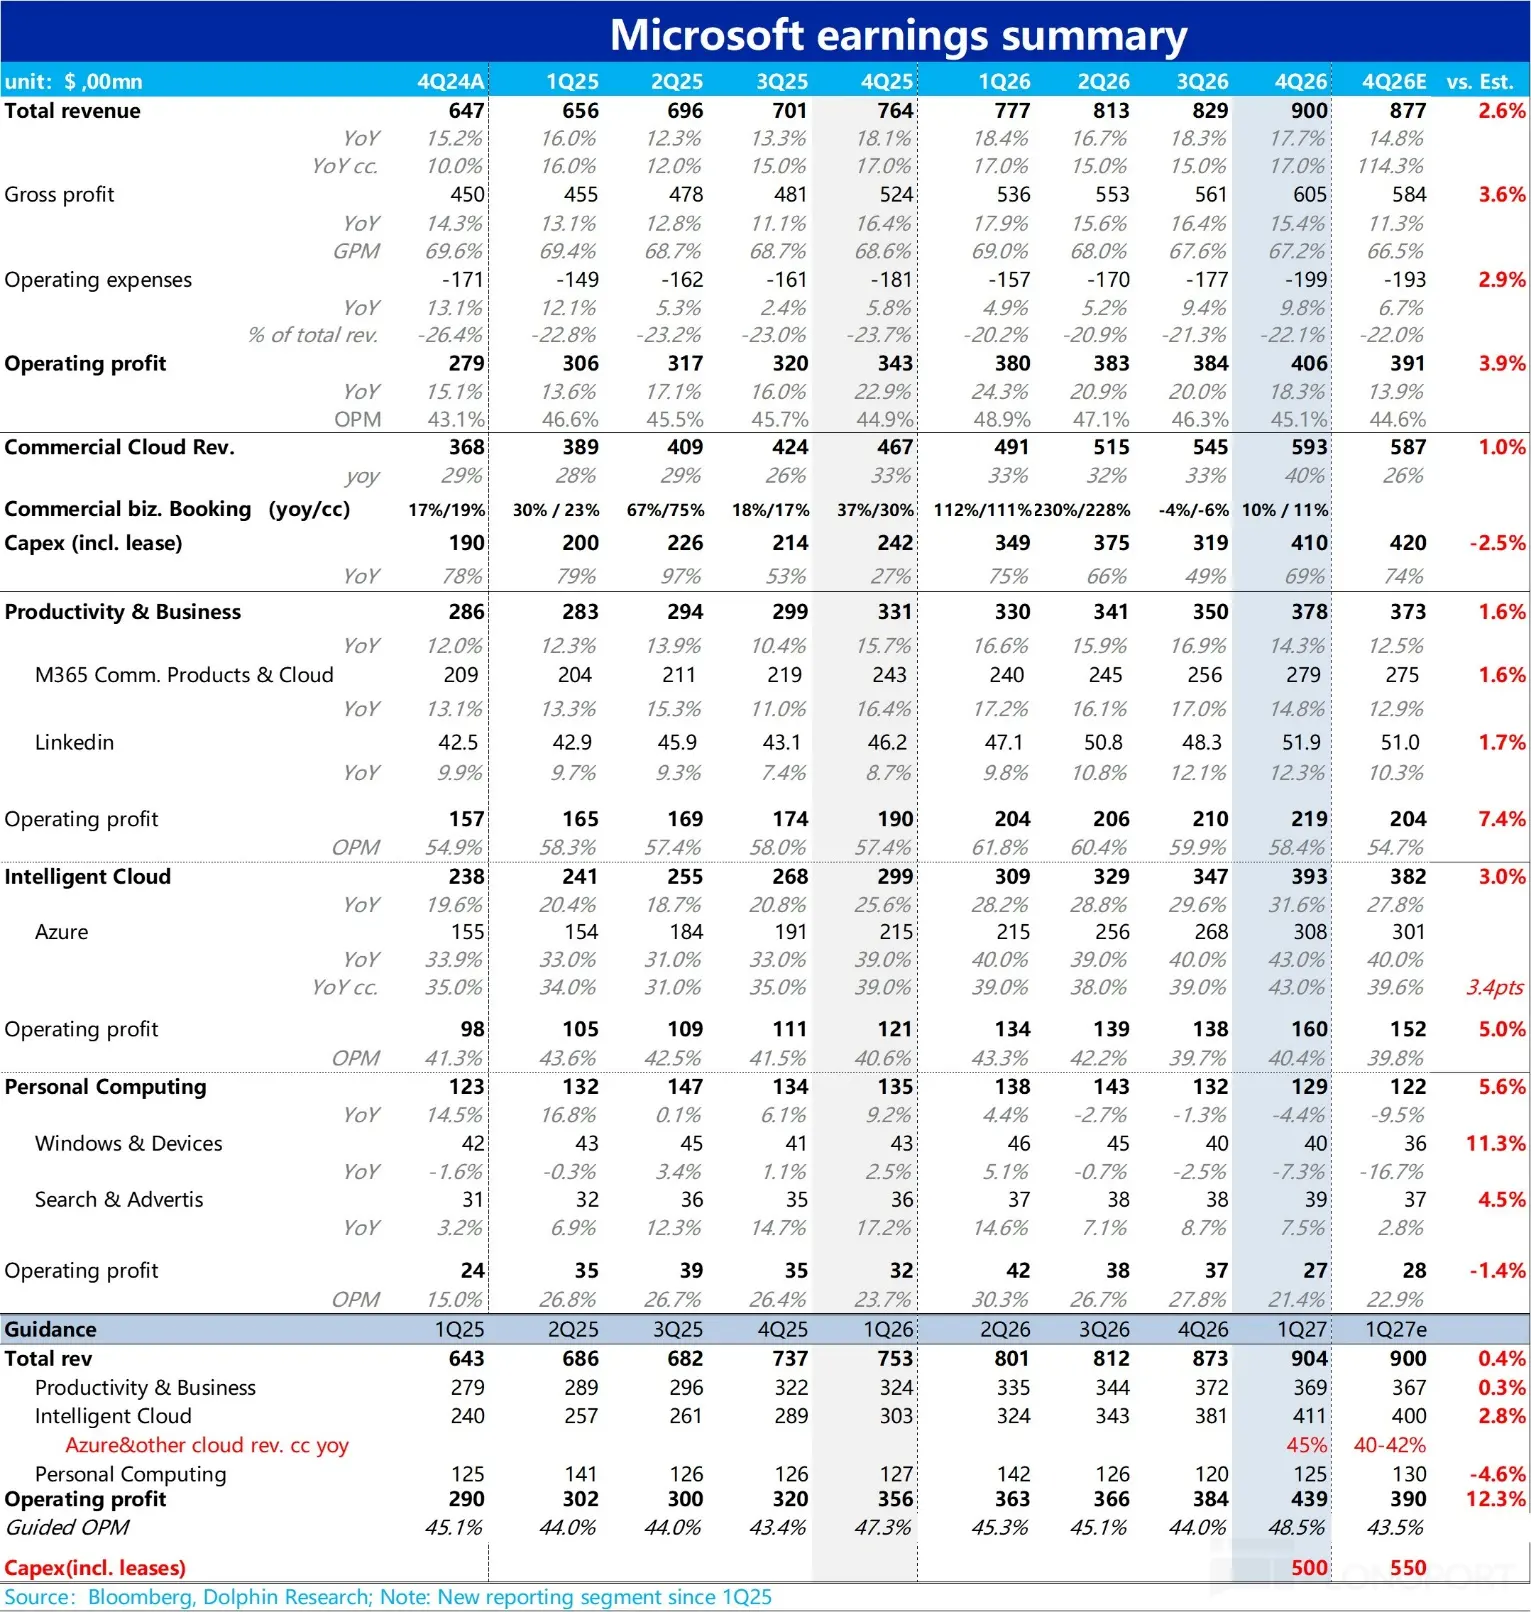
$Microsoft(MSFT.US) reported Q4 FY2026 results for the period ended Jun after the U.S. market close on Jul 30. In short, the AI tide has swung back in its favor, and Microsoft can finally breathe easier.

1) As the key monetization driver for its AI investment, Azure re-accelerated to +43% YoY this quarter (ex-FX the same), vs. more bullish previews at 40–42%. This topped expectations.

More importantly, cc growth guidance for next quarter is 45%, implying further acceleration at Azure. Codex has been catching up fast lately...

HIIIIIII Microsoft
Microsoft earnings summary unit:$,00mn 4Q24A 1Q25 2Q25 3Q25 4Q25 1Q26 2Q26 3Q26
FY24 Segment structure FY25 Segment structure Productivity and Business Processe
DolphinRese earch -3% 7% 11% New commercial Bookings growth YoY (reported) Dolph+14
D
Dolphin Research

MSFT (Trans): CY26 capex revised to approx. $175 bn

Below is Dolphin Research's compiled $Microsoft(MSFT.US) FY26 Q4 earnings call Trans. I. Core financial highlights recap.

1. Shareholder returns: returned $10.2 bn to shareholders this quarter via dividends and buybacks. For the full fiscal year, total shareholder returns exceeded $43.0 bn.

2. FY27 Q1 guide: total revenue of $89.85–90.95 bn (+16–17% YoY). COGS of $29.6–29.8 bn.

图片 1,共 1 张
D
Dolphin Research

AI Compute: From Feast to Leftovers?

In Dolphin Research's earlier piece 'AMZN's AI Misfire: Can It Mount a Comeback?', we examined AWS's AI buildout from several angles.

From in-house chips and the Anthropic partnership to model performance, we saw a meaningful step-up in AMZN's end-to-end AI capabilities, with the gap vs. Alphabet clearly narrowing.

Two questions still stand out for us.

First, AI margins at cloud providers seem better than we had penciled in; second, they remain heavily dependent on their model partners...

口 m
AI Industry Value Chain Profit Allocation (Waterfall Chart) Illustrative view ba
Anthropic Flagship Model Pricing Anthropic Smaller Model Pricing 80 Input ($mn/t
Index Comparison - US TPI vs CN TPI vs Coding TPI Absolute ($) Normalized(100) U+17
D
Dolphin Research

MSFT (Trans): Pricing Model Shifting from Per-Seat to Usage-Based

Below is Dolphin Research's Trans of $Microsoft(MSFT.US) FY26Q3 earnings call.

For our earnings analysis, please see 'Post‑breakup pains: When will Microsoft regain its mojo?'

I. Core results recap.

1) Shareholder returns: $10.2bn was returned to shareholders this quarter via dividends and buybacks.

2) Key metrics: revenue of $82.9bn (+18% YoY; +15% cc) and GPM of 68% (down YoY, mainly due to AI infra build‑out and increased AI product usage...).

Microsoft
Microsoft earnings summary Actual unit: $ 100mn 3Q24A 4Q24A 1Q25 2Q25 3Q25 4Q25
D
Dolphin Research

Post-breakup pains: when will MSFT stage a comeback?

$Microsoft(MSFT.US) reported FY26 Q3 (quarter ended Mar) after the US close on Apr 30. Overall, results were steady, with most headline metrics beating expectations but lacking a true standout.

1) Azure re-accelerated, but without surprises. Azure revenue grew 40% YoY; ex-FX growth was 39%, a 100bps acceleration QoQ.

The re-acceleration is a healthy sign. That said, versus AWS and GCP's stronger pickup this quarter, it was not particularly eye-catching...

Microsoft
Microsoft earnings summary Actual unit: $ 100mn 3Q24A 4Q24A 1Q25 2Q25 3Q25 4Q25
Figure 5:M365 E7 Suite Feature Comparison Microsoft 365E7: The Frontier Suite Mi
Figure 6: Announced updated prices and % increase by SKU as of July 1, 2026 Curr+17
D
Dolphin Research

MSFT (Trans): Agents will be the apps of the new era

Below is Dolphin Research's FY26 Q2 earnings call Trans for $Microsoft(MSFT.US). For our earnings take, see 'Seasoned Microsoft: Stepping Back to Leap Higher?'.

Key metrics recap — Overall: revenue reached $81.3 bn, up 17% YoY (+15% cc). Operating profit rose 21% YoY (+19% cc).

EPS was $4.14. On an Adj. basis, EPS increased 24% YoY (+21% cc)...

Microsoft
Microsoft earnings summary Actual unit: $ 100mn 1Q24A 2Q24A 3Q24A 4Q24A 1025 2Q2
D
Dolphin Research

'Seasoned' MSFT: Deliberate Step back for Bigger Leap?

In U.S. after-hours on Jan 29 Beijing time, Microsoft reported FY26 Q2 results for the quarter ended Dec. Overall, total revenue, GP and OP all came in above Bloomberg consensus and ahead of prior guidance. That said, capex continued to surge while Azure growth decelerated, likely reigniting concerns about the ROI of that spend and doubts over Microsoft's lead in the AI race...

Microsoft
Microsoft earnings summary Actual unit: $ 100mn 1Q24A 2Q24A 3024A 4Q24A 1025 202
Shareholder Structure of the OpenAI Group PBC Microsoft Employees+ other investo
FY24 Segment structure FY25 Segment structure Productivity and Business Processe+16
D
Dolphin Research

2026's Harsh AI Question: after bns AI Capex, Where will Returns Come From?

In our prior piece 'AI's Original Sin: Is NVIDIA the stimulant AI can’t quit?', Dolphin Research argued that the key shift for the AI supply chain in 2025 is the extreme upstream capture of value, which has thrown the system out of balance. This imbalance is reshaping incentives and risk-taking across the stack.

With FOMO running high, AI spend keeps climbing, while rivalry among core players has become more explicit. Capital allocations are increasingly concentrated at the top of the chain.

As the internet enters the AI era, regardless of how shifting inputs reshape bargaining power along the value chain, one ultimate question remains. After front-loaded investment in heavy capex, deep tech, and top talent with an approx. five-year depreciation cycle, is this ultimately a bubble?

图片 1,共 20 张
The High ROI of High Compute Performance 4-Year Rental Opportunity @$4 per GPU-H
Al Chip revenues (,00mn、USD) Nvidia AMD Intel AVGO Marvell Total(Al chips) 9,000
Data center capex (,00mn/USD) Apple META Alphabet Microsoft Amazon Total 4 Capex+16