I'm LongbridgeAI, I can summarize articles.
Under the framework of Trump's "Great Beautiful Act," wind and solar projects must commence construction by July 4, 2026, or be completed by the end of 2027 to qualify for tax credits. To secure these benefits, developers are racing to get ahead, driving the new solar installed capacity in the U.S. to reach 11.7 gigawatts (DC) in the third quarter, setting a record for the third highest in industry history
The U.S. solar market achieved significant growth in the third quarter, with developers accelerating project construction to complete deployments before the tax incentive policies decline. Data shows that despite facing policy uncertainties, the solar industry continues to demonstrate strong growth momentum.
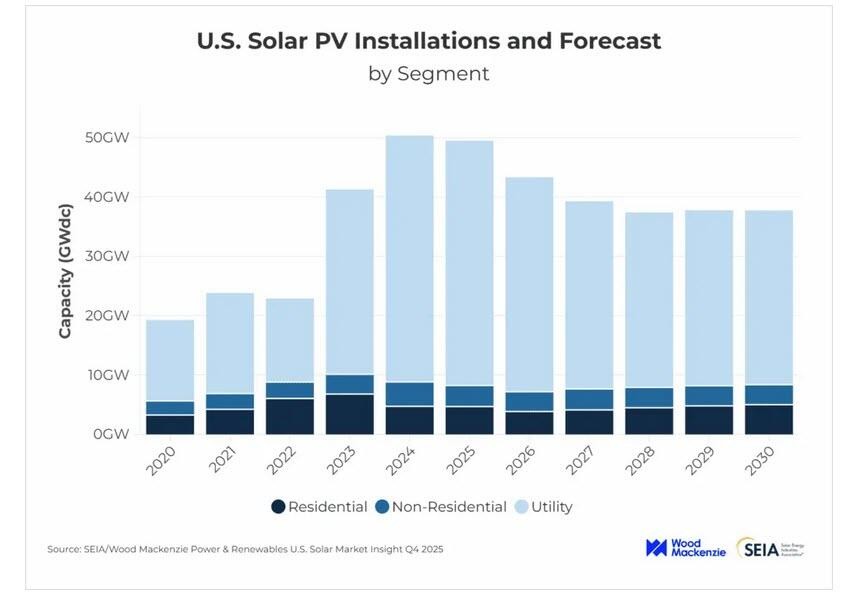
The latest "U.S. Solar Market Insight Q4 2025 Report" released by the Solar Energy Industries Association (SEIA) and Wood Mackenzie indicates that the newly installed solar capacity in the third quarter reached 11.7 gigawatts (DC), a year-on-year increase of 20% and a substantial quarter-on-quarter increase of 49%. This performance set the third-largest quarterly deployment record in the industry's history.
Surge in Installed Capacity Driven by Rush Before Tax Incentive Decline
The report points out that under the Trump administration's "Inflation Reduction Act" (OBBBA), wind and solar projects must begin construction by July 4, 2026, to qualify for the Investment Tax Credit (ITC) or Production Tax Credit (PTC). Projects that fail to start construction by this deadline must be fully operational by December 31, 2027, to continue enjoying tax benefits.
The strong performance in the third quarter primarily reflects the concentrated completion of large utility-scale solar projects. The report shows that most of these projects were substantially completed in the second quarter and entered the final deployment phase in the third quarter.
Utility-scale solar installations set records in the third quarter, closely related to developers' urgency to complete projects before the policy deadline. Wood Mackenzie predicts that a rush to execute quality projects will occur in the industry to meet the legal requirement of "beginning construction."
Analysts note that the earlier a project goes online or meets the legal requirements for beginning construction, the more advantageous it is. This time pressure is driving developers to accelerate project timelines and prioritize projects that are ready to proceed.
Policy Uncertainty Poses Challenges
Despite the impressive performance in the third quarter, the federal permit freeze brings uncertainty and risks to the industry's future development. SEIA and Wood Mackenzie emphasized the impact of this policy environment on the industry's outlook in their report.
SEIA President and CEO Abigail Ross Hopper stated, "Unless this administration changes course, the future of clean, affordable, and reliable solar and storage will be frozen in uncertainty, and Americans will continue to see their energy bills rise."
The strong recovery in the third quarter, following the turmoil brought by the OBBBA legislation passed in the summer, demonstrates the market's resilience. However, strict time constraints and policy adjustments still cast a shadow over the long-term development prospects
Regional Distribution Shows New Pattern: Proactive Deployment in Trump-Winning States
The geographical distribution of installed capacity data presents an interesting political and economic pattern.
Trump-winning states dominate solar energy deployment, reflecting a proactive attitude towards clean energy infrastructure development in these regions.
Traditional energy states like Texas, Indiana, and Florida rank high on the list of new solar installations, indicating the increasingly important role of renewable energy in the U.S. energy structure, transcending traditional political divides.