
 I'm LongbridgeAI, I can summarize articles.
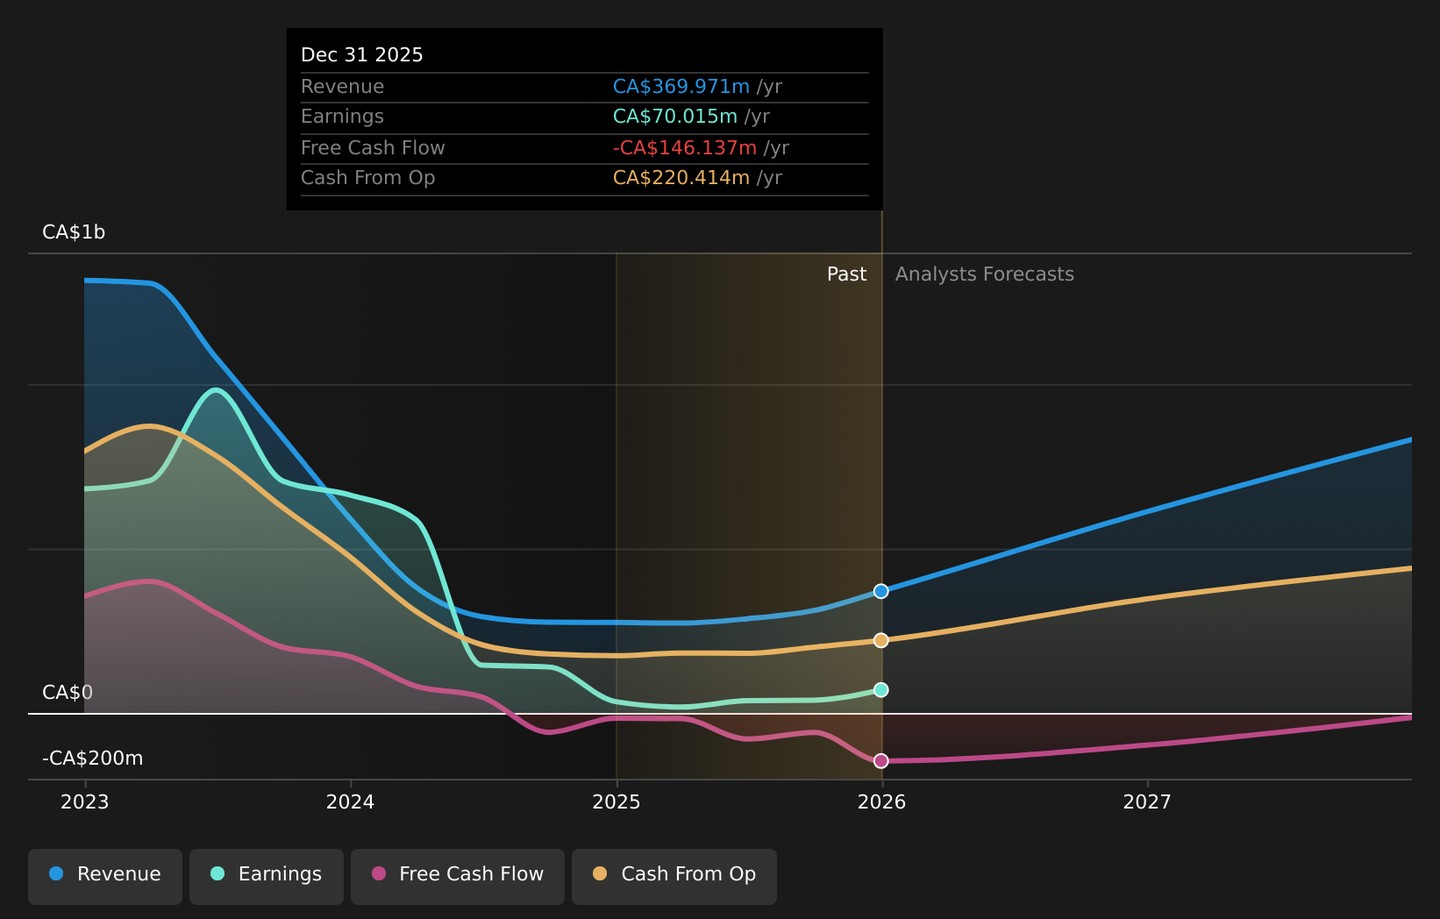
Spartan Delta (TSX:SDE) reported record production growth from its Duvernay asset, nearly tripling output year over year and exceeding full year production guidance. The stock is currently priced at CA$10.74, with significant gains of 259.2% over the past year and 820.5% over five years. Recent performance shows a 2.5% increase over the past week and 17.2% over the past month. Key metrics include a 30.8x P/E ratio and revenue of CA$370m. However, concerns arise regarding high non-cash earnings affecting profit interpretation. Investors are advised to monitor sustainability of operational delivery.
- Spartan Delta (TSX:SDE) reported record production growth from its Duvernay asset, with output in the play nearly tripling year over year.
- The company exceeded its full year production guidance, supported by sharply higher oil and liquids volumes.
- These operating results highlight fresh information on Spartan Delta’s core assets that has not yet been widely discussed.
For investors tracking TSX:SDE, the latest operating update adds new context to a share price of CA$10.74 and very large 1 year and 5 year returns, including a 259.2% gain over the past year and an 820.5% rise over five years. In the shorter term, the stock is up 2.5% over the past week, 17.2% over the past month, and 43.8% year to date, which frames how the market has moved around this operational progress.
The record Duvernay performance and above target annual production provide additional data points to assess how Spartan Delta is executing on its core assets. As you consider the recent share price performance alongside these results, the key question is how sustainable this level of operational delivery may be over time.
Stay updated on the most important news stories for Spartan Delta by adding it to your watchlist or portfolio. Alternatively, explore our Community to discover new perspectives on Spartan Delta.
2 things going right for Spartan Delta that this headline doesn't cover.
Quick Assessment
- ⚖️ Price vs Analyst Target: At CA$10.74, Spartan Delta trades about 8% below the CA$11.65 consensus target, which sits inside a tight CA$11.00 to CA$12.50 range.
- ⚖️ Simply Wall St Valuation: Simply Wall St's DCF based fair value is currently unknown, so there is no clear under or overvaluation signal from that model.
- ✅ Recent Momentum: The stock is up about 17% over the past 30 days, which lines up with the strong operational update.
To decide whether to buy, sell or hold Spartan Delta, you can review Simply Wall St's company report for the latest analysis of Spartan Delta's fair value.
Key Considerations
- 📊 Record Duvernay production and beating full year guidance provide fresh evidence on how the core asset base is being used.
- 📊 Key metrics to monitor include the 30.8x P/E ratio, revenue of CA$370m, and any updates on Duvernay production volumes and capital spending.
- ⚠️ One flagged issue is a high level of non-cash earnings, which can make headline profit and the P/E ratio less straightforward to interpret.
Dig Deeper
For a fuller picture, including more detail on risks and potential rewards, see the complete Spartan Delta analysis. You can also visit the community page for Spartan Delta to review how other investors think this latest news may affect the company's narrative.
This article by Simply Wall St is general in nature. We provide commentary based on historical data and analyst forecasts only using an unbiased methodology and our articles are not intended to be financial advice. It does not constitute a recommendation to buy or sell any stock, and does not take account of your objectives, or your financial situation. We aim to bring you long-term focused analysis driven by fundamental data. Note that our analysis may not factor in the latest price-sensitive company announcements or qualitative material. Simply Wall St has no position in any stocks mentioned.
New: Manage All Your Stock Portfolios in One Place
We've created the ultimate portfolio companion for stock investors, and it's free.
• Connect an unlimited number of Portfolios and see your total in one currency
• Be alerted to new Warning Signs or Risks via email or mobile
• Track the Fair Value of your stocks
Try a Demo Portfolio for Free