
 I'm LongbridgeAI, I can summarize articles.
J.S.B.Co.Ltd (TSE:3480) reported Q1 2026 revenue of ¥16.8b and basic EPS of ¥18.13, with a trailing net profit margin of 7.8%. Despite quarterly revenue fluctuations, the company has shown a five-year earnings growth of 15.2%. The stock trades at a trailing P/E of 11.9x, below market averages, but a DCF fair value of ¥1,762.69 suggests overvaluation at the current share price of ¥3,410. The 3.37% dividend yield is weakly covered by free cash flow, raising concerns about sustainability amid high debt levels. Investors are advised to consider long-term trends.
J.S.B.Co.Ltd (TSE:3480) opened Q1 2026 with revenue of ¥16.8b and basic EPS of ¥18.13, alongside trailing twelve month EPS of ¥285.67 on revenue of ¥77.6b. Over recent quarters the company has seen quarterly revenue move between ¥15.3b and ¥27.0b while basic EPS has ranged from a loss of ¥24.20 per share to a profit of ¥267.87 per share, giving investors a wide set of earnings outcomes to weigh against the current print. With trailing net profit margin at 7.8% compared with 7.3% a year earlier, the latest numbers keep the focus firmly on how sustainably J.S.B.Co.Ltd is converting its revenue base into profit.
See our full analysis for J.S.B.Co.Ltd.
With the headline figures on the table, the next step is to see how this earnings profile lines up with the widely held stories about J.S.B.Co.Ltd's growth, risk, and income appeal, and where the fresh data may challenge those views.
Curious how numbers become stories that shape markets? Explore Community Narratives
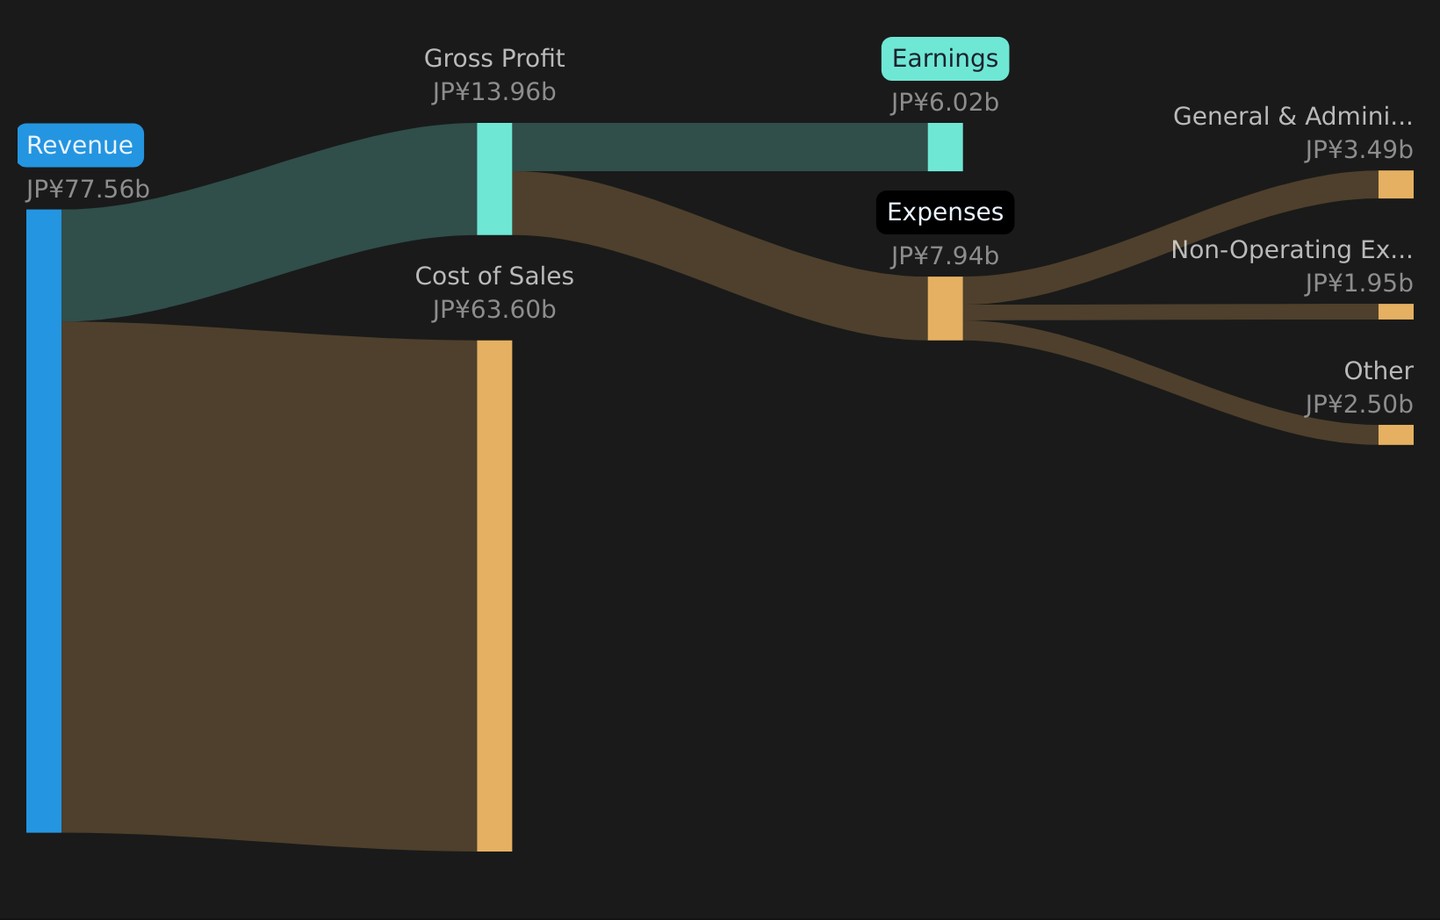
TTM profit growth supports 7.8% margin
- Over the last twelve months, J.S.B.Co.Ltd earned ¥6,019 million of net income on ¥77,558 million of revenue, which lines up with the reported 7.8% net profit margin versus 7.3% a year earlier and reflects five year earnings growth of 15.2% per year.
- What stands out for the bullish view is that this 7.8% margin sits on top of that 15.2% earnings growth rate. This supports the idea of a resilient profit engine, yet:
- Trailing revenue of ¥77,558 million and net income of ¥6,019 million show the business is still generating profit even after periods of quarterly volatility where individual quarters, like Q4 2025, showed a net loss of ¥509 million.
- At the same time, the Q1 2026 net income of ¥382 million is far below the ¥5,653 million recorded in Q2 2025, so anyone leaning on the bullish thesis has to factor in that the path to that 7.8% margin has involved very different profit levels from quarter to quarter.
To see how investors are weighing that margin profile against long term growth hopes, and how that matches different storylines around the stock, you can check out 📊 Read the what the Community is saying about J.S.B.Co.Ltd..
P/E at 11.9x with DCF gap
- The shares trade on a trailing P/E of 11.9x, which is below the JP market average of 14.7x and the JP real estate industry average of 12.5x, while a DCF fair value of ¥1,762.69 sits well below the current share price of ¥3,410.
- For investors taking a cautious or bearish stance, that mix of ratios and fair value estimates raises clear questions about valuation comfort, since:
- The stock is priced below the market and industry on a P/E basis, yet it sits above a peer average P/E of 10.9x, so the relative value story is not one way and peers are priced lower on the same metric.
- The gap between the ¥3,410 share price and the ¥1,762.69 DCF fair value means anyone arguing the stock is inexpensive on P/E has to reconcile that with a cash flow based estimate that implies a much lower value.
Dividend yield versus cash flow and debt
- The stock offers a 3.37% dividend yield, but that payout is reported as weakly covered by free cash flow and sits alongside a high level of debt on the balance sheet.
- Income focused investors often lean bullish when they see a 3.37% yield, yet the underlying data pushes them to look more closely, because:
- Weak free cash flow coverage means the company is not comfortably funding that dividend from surplus cash, which can limit flexibility when combined with other needs like interest and capital spending.
- High leverage on top of that cash flow picture means the dividend story rests on continued access to funding and stable operations, rather than on an abundance of excess cash that can easily support or grow the payout.
Next Steps
Don't just look at this quarter; the real story is in the long-term trend. We've done an in-depth analysis on J.S.B.Co.Ltd's growth and its valuation to see if today's price is a bargain. Add the company to your watchlist or portfolio now so you don't miss the next big move.
Mixed messages in the numbers or a clear signal for you, either way it helps to look at the full data set and move quickly to your own view. To weigh both the concerns and the potential upside in one place, check out 3 key rewards and 2 important warning signs.
Explore Alternatives
J.S.B.Co.Ltd pairs volatile quarterly earnings with a dividend that is weakly covered by free cash flow and backed by a balance sheet carrying high debt.
If that mix of shaky dividend coverage and leverage makes you cautious, check out our solid balance sheet and fundamentals stocks screener (36 results) to quickly size up companies built on sturdier financial footing.
This article by Simply Wall St is general in nature. We provide commentary based on historical data and analyst forecasts only using an unbiased methodology and our articles are not intended to be financial advice. It does not constitute a recommendation to buy or sell any stock, and does not take account of your objectives, or your financial situation. We aim to bring you long-term focused analysis driven by fundamental data. Note that our analysis may not factor in the latest price-sensitive company announcements or qualitative material. Simply Wall St has no position in any stocks mentioned.
New: Manage All Your Stock Portfolios in One Place
We've created the ultimate portfolio companion for stock investors, and it's free.
• Connect an unlimited number of Portfolios and see your total in one currency
• Be alerted to new Warning Signs or Risks via email or mobile
• Track the Fair Value of your stocks
Try a Demo Portfolio for Free