
Freee K.K Q3 EPS Compression Tests Bullish Long Term Profitability Narrative
 I'm LongbridgeAI, I can summarize articles.
Freee K.K (TSE:4478) reported Q3 2026 revenue of ¥10.9b and basic EPS of ¥0.39, down from ¥2.54 in Q2 2026. Despite a trailing 12-month revenue of ¥40.3b and net income of ¥686.8m, Q3's net income of ¥23m raises concerns about profitability sustainability. The stock trades at a P/S of 3.2x, higher than peers, with a DCF fair value of ¥6,739.44, indicating potential undervaluation. However, volatility and earnings fluctuations create caution among investors regarding growth expectations.
freee K.K (TSE:4478) has just posted its Q3 2026 numbers, with revenue at approximately ¥10.9b and basic EPS of ¥0.39, while trailing 12 month figures show revenue of about ¥40.3b and basic EPS of ¥11.60. Over recent quarters, revenue has moved from roughly ¥7.9b in Q2 2025 to ¥10.2b in Q2 2026 and ¥10.9b in Q3 2026, as basic EPS shifted from ¥10.67 to ¥2.54 and then ¥0.39, giving investors a clearer view of how growth and profitability are balancing out. Margins are very much in focus here, with the latest quarter indicating that the business is generating higher sales while earnings compression raises questions about how durable the current profitability profile is.
See our full analysis for freee K.K.
With the headline numbers on the table, the next step is to see how this earnings release aligns with the key narratives around growth potential, risk, and valuation that many investors already have in mind.
Curious how numbers become stories that shape markets? Explore Community Narratives
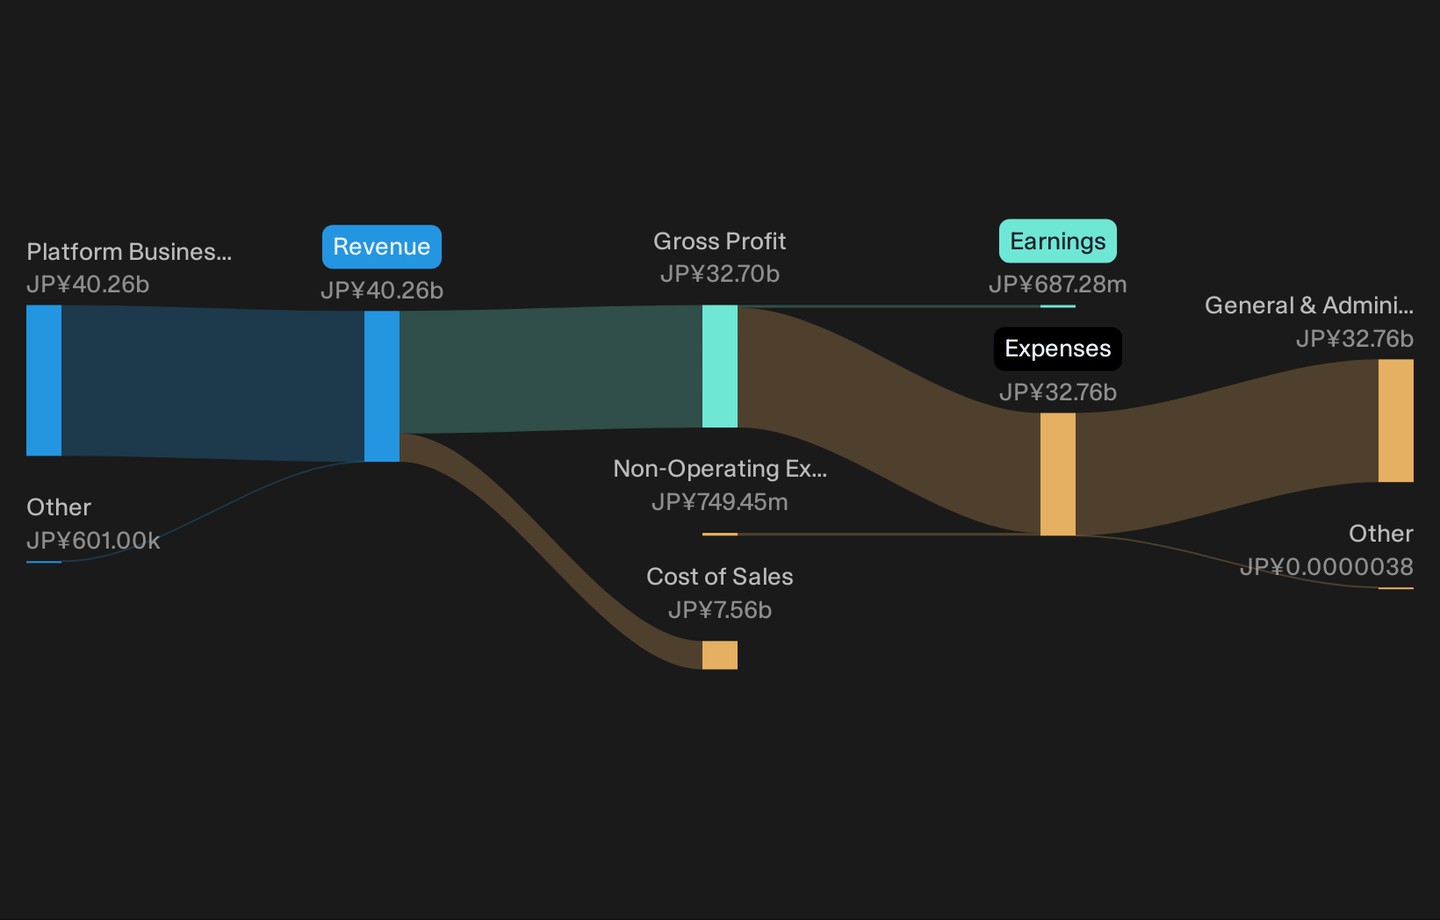
TTM revenue tops ¥40.3b while profit stays slim
- On a trailing 12 month basis, freee K.K generated about ¥40.3b in revenue with net income of roughly ¥686.8m, compared with single quarter Q3 2026 revenue of ¥10.9b and net income of ¥23m, so most of the profit in the last year came from earlier periods rather than this latest set of figures.
- What stands out for a bullish narrative is that earnings over the past five years are shown growing about 17.4% per year and the company only became profitable in the last year. Yet Q3 2026 net income of ¥23m is much smaller than the ¥150.5m to ¥627.1m range seen in earlier quarters, which heavily supports the bullish case on long term traction while also reminding investors that quarter to quarter profitability can be quite sensitive to how costs line up against revenue.
EPS swings from double digits to ¥0.39
- Basic EPS in Q3 2026 printed at ¥0.39, compared with ¥2.54 in Q2 2026 and ¥10.67 in Q2 2025, while on a trailing 12 month view EPS sits at ¥11.60, which shows that the full year picture is still positive even though the most recent quarter contributes only a small share of those earnings.
- Bears argue that such swings in EPS make the profit trend fragile, and Q3 2026 does show EPS much lower than the ¥2.61 to ¥10.67 range in the recent history. Yet trailing 12 month EPS of ¥11.60 and net income of about ¥686.8m challenge a purely bearish view because they confirm that, over a full year, earnings remain positive even with this softer quarter.
- Critics highlight the step down in quarterly net income from ¥358.8m in Q4 2025 to ¥23m in Q3 2026, while the trailing 12 month net income figure still captures the earlier, stronger quarters and keeps the full year result in profit.
- What is more, past quarters included losses on a trailing basis, as seen when trailing net income was reported at about ¥3,147m in losses one year ago, so the current positive trailing figure indicates the company has moved away from those loss making levels even though recent EPS is modest.
Premium P/S and big DCF gap
- The stock trades on a P/S of 3.2x compared with 2.7x for peers and 1.6x for the wider JP software group. The current share price of ¥2,150 sits well below a DCF fair value figure of ¥6,739.44 and an analyst price target of ¥3,430.00, so the market price is lower than both reference values even though the sales multiple is higher than the industry average.
- Supporters of the bullish view point to forecast earnings growth of about 49.6% per year and revenue growth of around 16.8% per year together with the DCF fair value gap to argue the shares are undervalued, whereas the higher P/S multiple and recent share price volatility underline why some investors stay cautious, creating a tension between growth expectations and the premium that the market currently applies to each yen of sales.
- On the reward side, the data frames the stock as trading roughly 68.1% below the indicated DCF fair value, which is a wide gap for anyone who trusts that model and the growth assumptions behind it.
- On the risk side, the higher than peer P/S and the mention of elevated three month volatility mean that any disappointment relative to those growth forecasts could affect how comfortable investors feel paying a premium revenue multiple.
Investors who want to see how other market participants are connecting these figures into a bigger story around growth, risk, and valuation can review the wider community views in one place using the Curious how numbers become stories that shape markets? Explore Community Narratives
Next Steps
Don't just look at this quarter; the real story is in the long-term trend. We've done an in-depth analysis on freee K.K's growth and its valuation to see if today's price is a bargain. Add the company to your watchlist or portfolio now so you don't miss the next big move.
With sentiment split between cautious and optimistic in this update, it helps to review the underlying figures yourself and decide quickly where you stand. For a concise view of both sides of the argument, see the 3 key rewards and 1 important warning sign
Explore Alternatives
freee K.K's thin recent quarterly profit, sharp EPS swings, and premium P/S rating against peers highlight how sensitive the stock can be to setbacks.
If that volatility makes you cautious, it is worth checking out companies that pair steadier fundamentals with more grounded valuations by running the 51 resilient stocks with low risk scores.
This article by Simply Wall St is general in nature. We provide commentary based on historical data and analyst forecasts only using an unbiased methodology and our articles are not intended to be financial advice. It does not constitute a recommendation to buy or sell any stock, and does not take account of your objectives, or your financial situation. We aim to bring you long-term focused analysis driven by fundamental data. Note that our analysis may not factor in the latest price-sensitive company announcements or qualitative material. Simply Wall St has no position in any stocks mentioned.
Valuation is complex, but we're here to simplify it.
Discover if freee K.K might be undervalued or overvalued with our detailed analysis, featuring fair value estimates, potential risks, dividends, insider trades, and its financial condition.
Access Free Analysis