
 I'm LongbridgeAI, I can summarize articles.
Sanrio (TSE:8136) reported FY2026 results with ¥194.1b revenue and 28.1% net margin, up from 28.8% last year. Trailing EPS rose 30.9% to ¥45.33. Despite a premium P/E of 20.7x, the stock trades below DCF fair value (¥1,273.75) and analyst targets. However, Q4 earnings softened significantly compared to Q3, raising questions about the sustainability of growth given high non-cash earnings components.
Sanrio Company (TSE:8136) has reported its FY 2026 results with fourth quarter revenue of ¥50.9b and basic EPS of ¥9.02, while trailing twelve month EPS stands at ¥45.33 on revenue of ¥194.1b and net income of ¥54.6b, alongside earnings growth of 30.9% over the past year. Over recent periods, the company has seen revenue move from ¥132.3b and EPS of ¥29.83 on a trailing basis in FY 2025 Q3 to ¥194.1b and EPS of ¥45.33 by FY 2026 Q4. This sets the backdrop for a story where healthy margins, slightly softer than last year, will be judged against how much of these profits are in cash rather than accounting items.
See our full analysis for Sanrio Company.
With the headline numbers on the table, the next step is to see how these earnings line up against the widely held narratives about Sanrio Company, highlighting where the story is reinforced and where the data raises new questions.
Curious how numbers become stories that shape markets? Explore Community Narratives
TTM profit growth with 28.1% margin
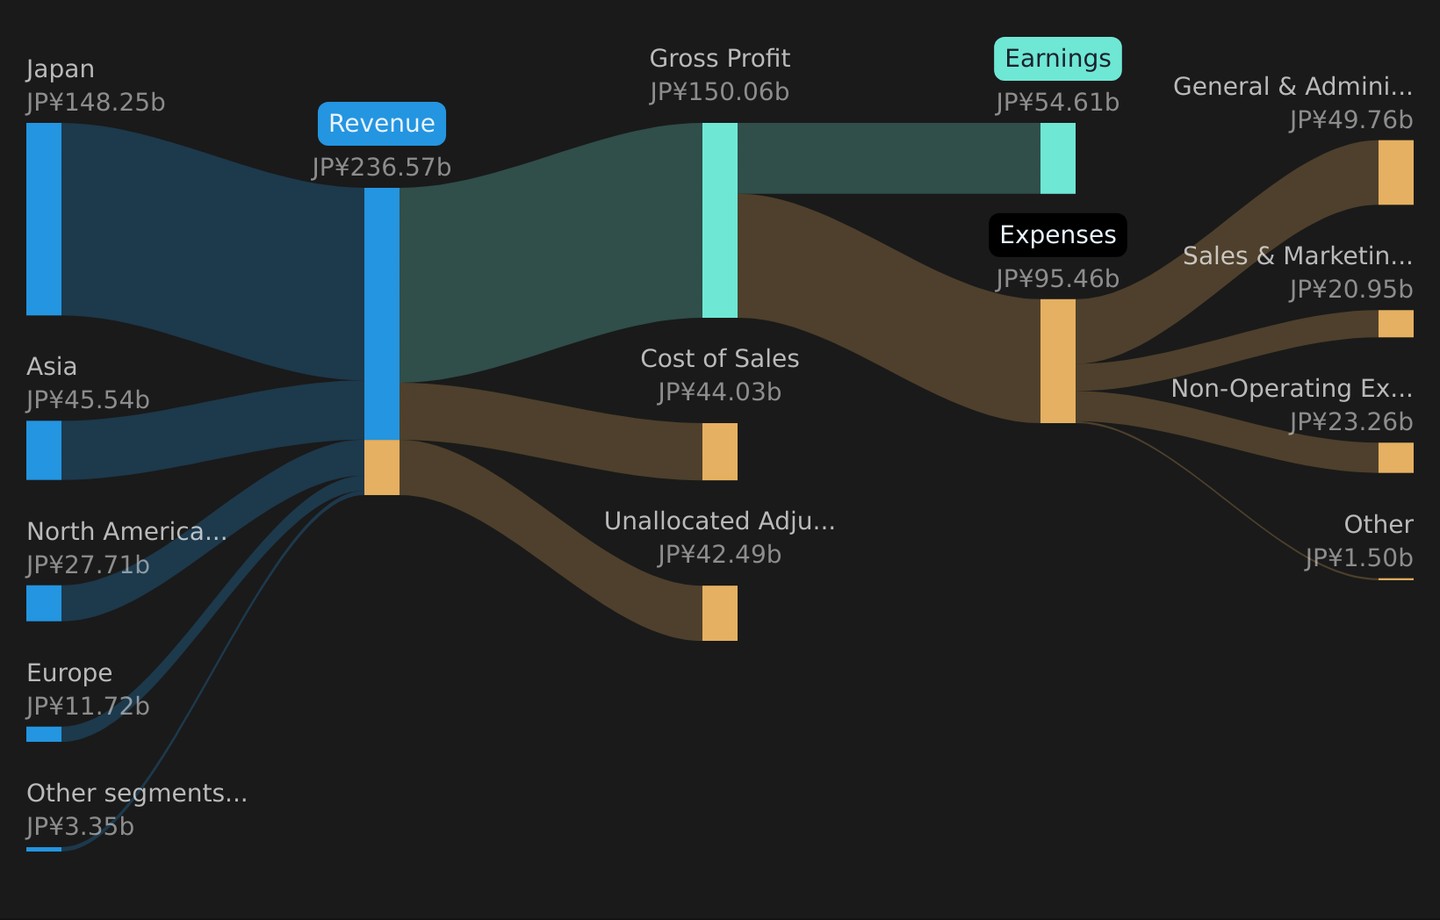
- Over the last twelve months, Sanrio Company generated ¥194,088 million in revenue and ¥54,608 million in net income, which works out to a net margin of 28.1% compared with 28.8% a year earlier.
- What stands out for the bullish view that Sanrio is a resilient character IP platform is that trailing earnings grew 30.9% year over year while margins stayed above 28%. However, quarterly net income moved from ¥16,161 million in FY 2026 Q3 to ¥10,929 million in Q4, which means supporters need to weigh the strong full year against softer recent quarters.
- Fans of the bullish case can point to trailing EPS rising from 29.83 JPY in FY 2025 Q3 to 45.33 JPY in FY 2026 Q4 on the latest twelve month basis, alongside revenue rising from ¥132,342 million to ¥194,088 million over the same rolling periods.
- At the same time, quarterly figures show EPS moving from 13.27 JPY in FY 2026 Q3 to 9.02 JPY in Q4, so anyone leaning bullish is relying more on the twelve month trend than on the most recent quarter alone.
Premium P/E but below DCF fair value
- Sanrio Company trades on a P/E of 20.7x, above the JP Specialty Retail industry average of 13.9x and the peer average of 14.6x. The current share price of ¥932 sits below a DCF fair value of ¥1,273.75 and below an analyst price target of ¥1,477.34.
- Critics highlight the higher P/E as a bearish point, yet that view sits beside analysis suggesting the stock is about 26.8% below DCF fair value and below the price target. The tension for investors is whether the 30.9% trailing earnings growth justifies both the premium multiple and the implied upside.
- On one side, the premium 20.7x P/E and high level of non cash earnings fit a cautious stance that the current profit mix may not fully match the headline growth.
- On the other, the gap between ¥932 and both the ¥1,273.75 DCF fair value and ¥1,477.34 analyst target gives bears a concrete hurdle to clear when arguing that the current price already reflects the recent profit performance.
Quarterly softness with forecast growth ahead
- Within FY 2026, revenue moved from ¥43,097 million in Q1 to ¥55,518 million in Q3 before sitting at ¥50,894 million in Q4, while net income over those quarters came in at ¥14,190 million, ¥13,328 million, ¥16,161 million and ¥10,929 million respectively.
- Consensus narrative notes that analysts expect earnings to grow around 9.9% per year and revenue about 8.9% per year. This sits alongside the quarterly pattern where EPS was 11.96 JPY in Q1, 11.09 JPY in Q2, 13.27 JPY in Q3 and 9.02 JPY in Q4, so investors are weighing that forecast growth against the recent softer finish to the year and the flagged high proportion of non cash earnings.
- Forecast growth on top of 30.9% trailing earnings growth and a 28.1% margin helps explain why valuation work points to potential upside from ¥932, even as margins are slightly below last year’s 28.8%.
- At the same time, the recent three month share price volatility and the non cash component in reported earnings give a concrete checklist for readers to track as new data comes in against those growth expectations.
Beyond these headline themes, it is worth seeing how other investors are connecting Sanrio Company's profit growth, premium P/E and DCF fair value into a single story of risks and rewards, which you can do by tapping into the wider community view via 📊 Read the what the Community is saying about Sanrio Company..
Next Steps
Don't just look at this quarter; the real story is in the long-term trend. We've done an in-depth analysis on Sanrio Company's growth and its valuation to see if today's price is a bargain. Add the company to your watchlist or portfolio now so you don't miss the next big move.
With Sanrio Company showing both appealing metrics and some clear question marks, it makes sense to check the underlying data yourself and not just rely on headlines. To see how investors are weighing both sides of the story, take a closer look at the 4 key rewards and 2 important warning signs.
See What Else Is Out There
Sanrio Company combines strong trailing earnings with a premium P/E, softer recent quarters and a high share of non cash earnings that may limit comfort for some investors.
If that mix makes you cautious about paying up for profit quality and volatility, it is worth checking companies screened as 48 resilient stocks with low risk scores to compare steadier alternatives side by side.
This article by Simply Wall St is general in nature. We provide commentary based on historical data and analyst forecasts only using an unbiased methodology and our articles are not intended to be financial advice. It does not constitute a recommendation to buy or sell any stock, and does not take account of your objectives, or your financial situation. We aim to bring you long-term focused analysis driven by fundamental data. Note that our analysis may not factor in the latest price-sensitive company announcements or qualitative material. Simply Wall St has no position in any stocks mentioned.
New: Manage All Your Stock Portfolios in One Place
We've created the ultimate portfolio companion for stock investors, and it's free.
• Connect an unlimited number of Portfolios and see your total in one currency
• Be alerted to new Warning Signs or Risks via email or mobile
• Track the Fair Value of your stocks
Try a Demo Portfolio for Free