
 I'm LongbridgeAI, I can summarize articles.
Krinsky warns that the S&P 500's trajectory, Microsoft's historical path, and the technical patterns of the semiconductor sector all show alarming parallels. He judges that this rally is likely to stall at the 50-day moving average, at which point injured investors will turn into sellers. The market is essentially a "musical chairs" rotation of existing capital rather than a true bull market, with no successor forces once tech stock momentum exhausts
The strong rebound in US tech stocks is currently raising alarms among market veterans.
Jonathan Krinsky, Chief Technical Market Strategist at BTIG, issued a warning in a report titled "Echoes of the Dotcom Bubble: Momentum Rally Continues, but the Shadow of 2000 Looms": Whether it is the price pattern of the S&P 500, the historical trajectory of Microsoft, or the technical structure of the semiconductor sector, all present unsettling similarities to the peak of the Dotcom Bubble in 2000.
Just a week ago, the Philadelphia Semiconductor Index (SOX) was mired in a roughly 30% drawdown, and Krinsky accurately signaled a phase-based bottom at that time. However, as the SOX surged 16% over the subsequent four trading days—marking its largest four-day gain since the pandemic—his stance quickly shifted to caution.
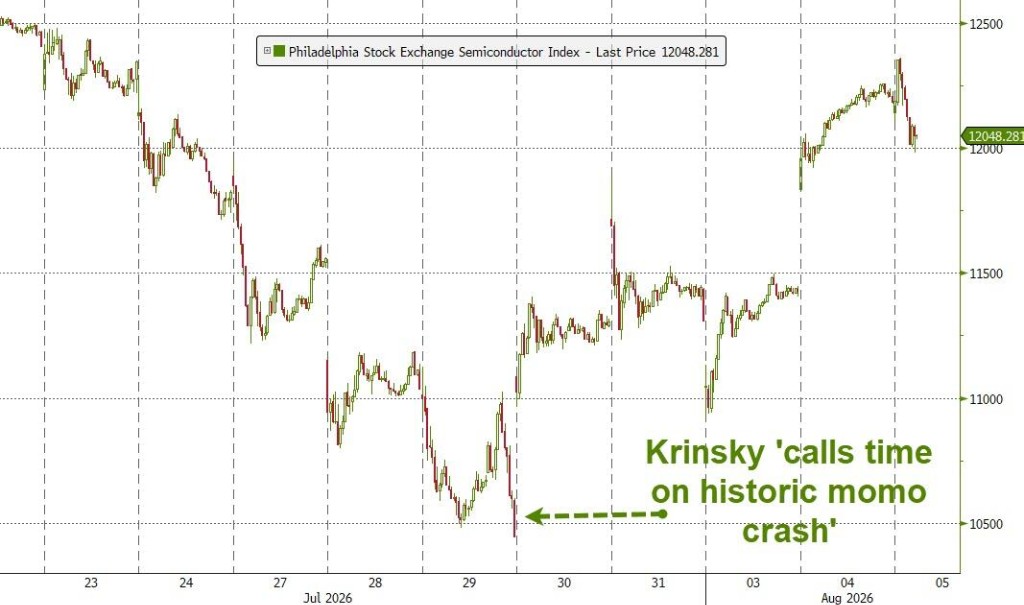
Krinsky believes this rally is likely to encounter resistance and fail near the 50-day moving average. The core logic is that many market participants who were hurt during the July pullback will turn into opportunistic sellers as prices rebound to resistance zones, "unwilling to be tripped by the same stone twice."
A deeper concern lies in the market structure itself. Krinsky points out that the core driver of the S&P 500 this quarter was not fundamental improvement, but rather the repeated shuffling of capital between momentum stocks and value stocks—a "game of musical chairs" with no winners.
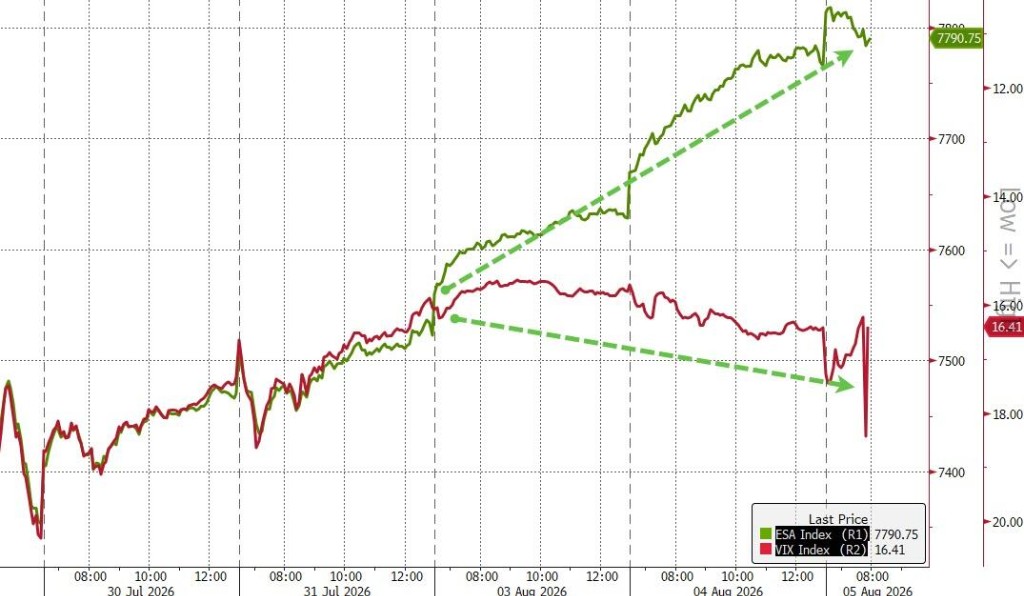
He warns that once the rally in tech stocks and high-beta momentum stocks runs its final course, the market will face a severe question: What force remains to support the overall market trend? Meanwhile, the VIX has shown an abnormal spike even as the S&P 500 rises, a phenomenon that has historically served as an early warning signal for the market.
Two Echoes of the Dotcom Bubble
Krinsky listed two sets of technical patterns in his report that closely match the peak of the 2000 bubble.
First Set: Historical Precedent of the S&P 500.
The S&P 500 rose more than 5% cumulatively over the past four trading days, simultaneously hitting a 52-week high.
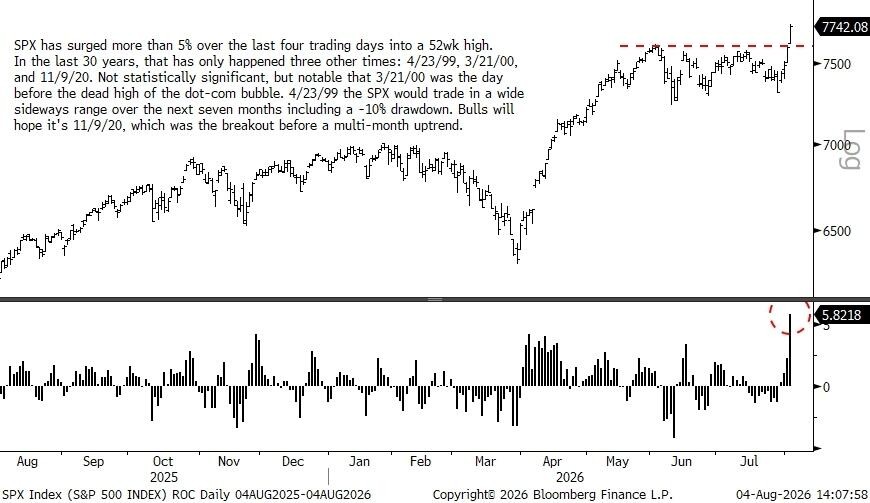
Krinsky noted that this pattern has only occurred three times in the past 30 years:
April 23, 1999; March 21, 2000; and November 9, 2020. Notably, March 21, 2000, was exactly the day before the absolute peak of the Dotcom Bubble; after April 23, 1999, the S&P 500 entered a period of wide-ranging consolidation over the next seven months, with a maximum drawdown of 10%.
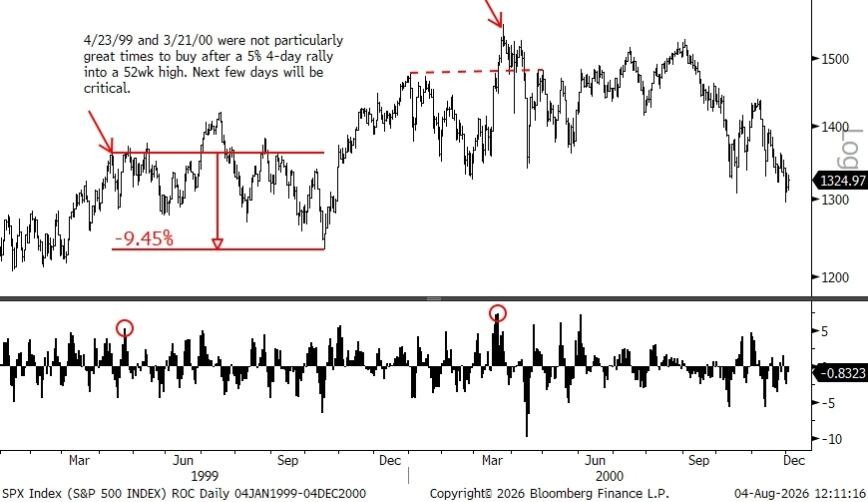
The only optimistic precedent was November 9, 2020, when the market subsequently embarked on a multi-month uptrend.

Krinsky stated bluntly regarding this:
"We are skeptical."
Second Set: Microsoft's Historical Mirror.
Microsoft hit an all-time high on December 30, 1999, then plummeted 60% over the next ten months, followed by a strong four-day cumulative rebound of 29%.
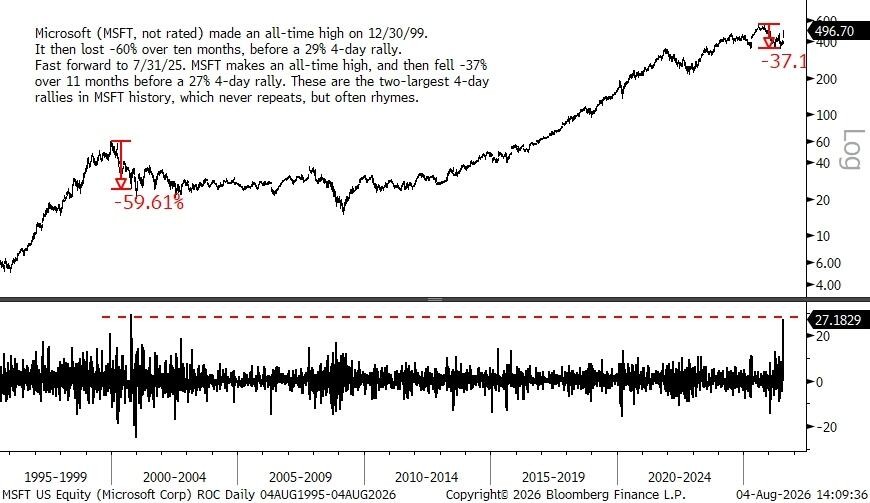
In the current market trend, Microsoft again hit an all-time high on July 31, 2025, then fell 37% over the next 11 months, immediately followed by a similar sharp four-day cumulative rebound of 27%.
Krinsky pointed out that these are the only two instances of Microsoft's largest four-day gains in history, noting that "History doesn't repeat itself, but it often rhymes."
Semiconductors: Rally Likely to Stall at 50-Day Moving Average
The SOX rose 16% cumulatively over four days from last week's lows, marking its largest single rebound since the pandemic. Krinsky maintains his previous judgment: The rebound may extend to the 50-day moving average, but it is likely to encounter resistance and retreat at that point.
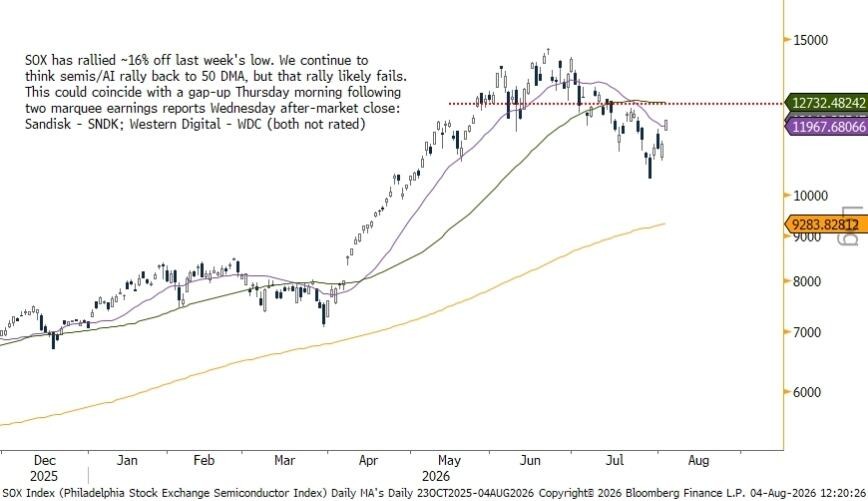
He also cautioned that two heavyweight earnings reports released after hours on Wednesday—SanDisk and Western Digital (neither rated by BTIG)—could trigger a gap-up open on Thursday morning, serving as a brief sentiment catalyst. However, this could precisely become a selling opportunity within the resistance zone.
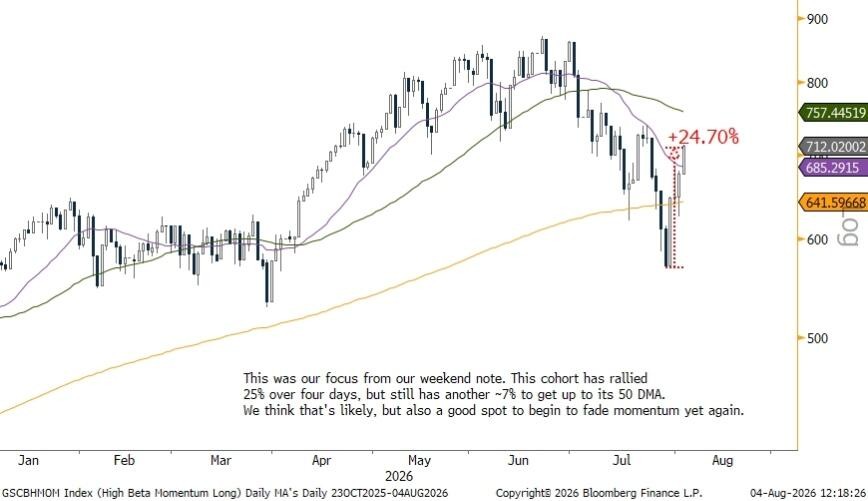
The group of high-beta momentum stocks also rose 25% cumulatively over four days, leaving about 7% room before reaching the 50-day moving average. Krinsky expects this group to also retreat after touching the moving average.
Regarding scenarios where his judgment might prove incorrect, Krinsky provided clear conditions: If semiconductors and momentum stocks choose to consolidate sideways near the 50-day moving average instead of dropping directly, the current bearish argument will need revision.
"Game of Musical Chairs": Structural Risks Behind the Rotation
Krinsky characterized the S&P 500's performance this quarter as a "game of musical chairs" driven by capital rotation, rather than a genuine broadening of the bull market.
In terms of data, from June 30 to July 28, the S&P 500 remained virtually flat overall, but five sectors including Energy and Financials gained more than 4%, while the Technology and Consumer Discretionary sectors each fell by 5% or more.
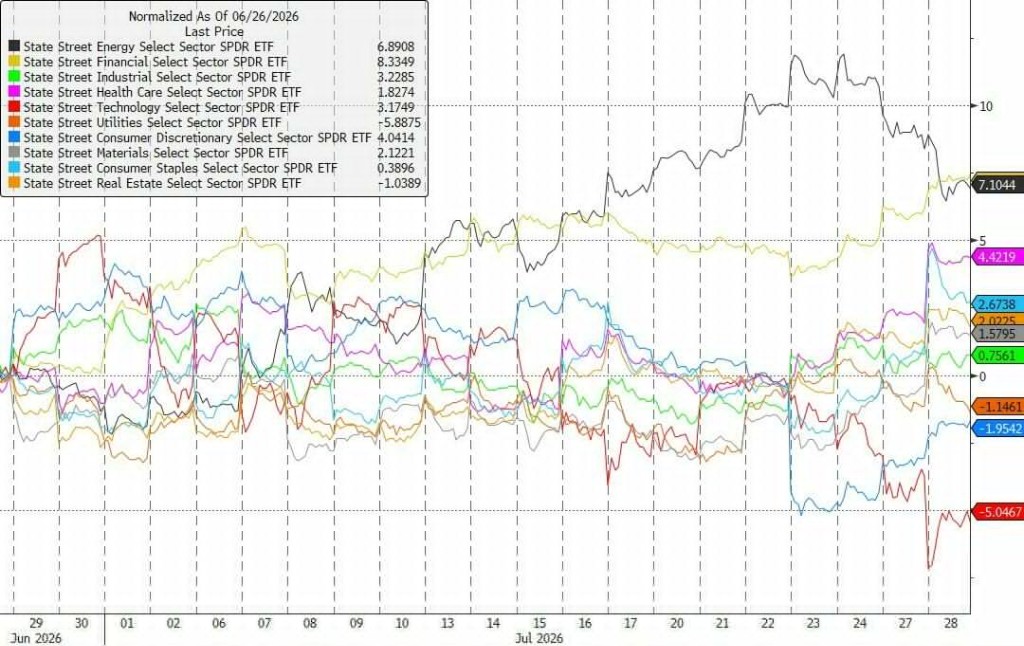
After July 28, styles reversed sharply: the Technology sector rose 7.24%, Consumer Discretionary rose 8.69%, while Real Estate, Consumer Staples, Utilities, and Healthcare sectors generally fell by more than 2%.
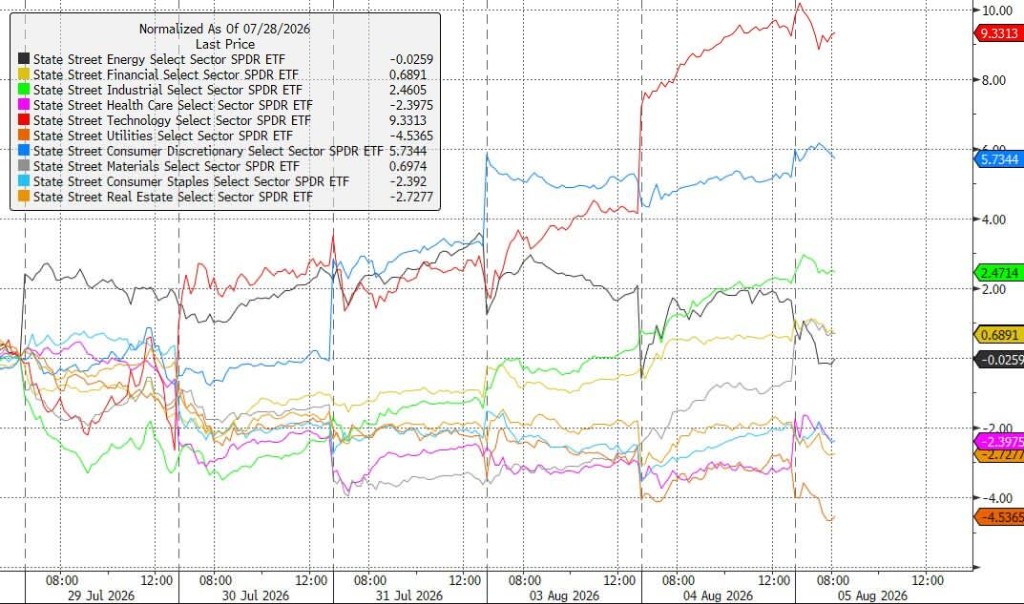
This see-saw rotation pattern means that the overall market rise was not driven by incremental capital, but by existing funds repeatedly shifting between different sectors. Krinsky's core concern is that when the rally in tech and high-beta momentum stocks finally exhausts its momentum, there will be no other sectors left to take the baton and support the broader market.
Additionally, at the end of the report, Krinsky specifically highlighted the abnormal performance of the VIX. Typically, the VIX is negatively correlated with the S&P 500—the fear index falls when stocks rise. However, recently the VIX has shown an abnormal spike against the backdrop of a rising S&P 500. This divergence has historically been an early signal of accumulating potential market risks, warranting high vigilance from investors.
Synthesizing the above analysis, Krinsky's core judgment can be summarized in one sentence: This rally is a technical repair, not a trend reversal. Market participants who suffered significant drawdowns in July will naturally become sources of selling pressure as prices rebound to resistance zones.
He also reminded investors of a cold mathematical reality: To fully recover from a 35% drawdown, a subsequent cumulative gain of 52% is required. Under the current market structure, the difficulty of achieving this goal should not be underestimated.