
"Record-Breaking" US Earnings Season: S&P 500 EPS Surges 45%, but Half Comes from Investment Gains and One-Third from AI Infrastructure
 Complete. Here is the key summary
S&P 500 second-quarter EPS soared 45% year-over-year, but a Goldman Sachs report lifts the veil on this "record": after excluding fair value changes in equity investments by tech giants, the growth rate nearly halves to 26%; AI infrastructure stocks contributed another third of the incremental growth, while the median company's actual growth was only 12%. Meanwhile, single-day call option volume exceeded 4 million contracts, hitting an all-time high, with realized volatility surpassing implied expectations by fourfold
This US earnings season has been dubbed "record-breaking," but structural issues behind the numbers are raising alarms.
According to the latest internal report from Goldman Sachs' Sales & Trading division, the year-over-year EPS growth rate for S&P 500 components in the second quarter reached as high as 45%. However, if the net gain from changes in fair value of equity investments held by large technology companies is excluded, this figure nearly halves to 26%.
In other words, about half of the "record" earnings growth stems from the book revaluation of tech giants' own risk investment portfolios, rather than substantial expansion in core operating profits.
At the same time, AI infrastructure-related stocks contributed approximately one-third of the overall EPS growth of the S&P 500, further highlighting the high concentration of earnings growth.
For investors holding index funds, this means the earnings foundation supporting current valuations is far more fragile than surface-level figures suggest. The second-quarter EPS growth rate for the median S&P 500 company was only 12%, a 33 percentage point gap from the headline figure of 45%. This disparity is almost entirely filled by the concentrated effect of a few tech giants and their accounting treatments.
Book Gains Propped Up Half the Growth
Ioannis Blekos, an analyst in Goldman Sachs' Sales & Trading division, pointed out clearly in this week's report that if the appreciation gains from equity investments held by large tech companies—so-called "other income"—are included, the S&P 500's year-over-year EPS growth rate is 45%. Once these mark-to-market book gains are excluded, the growth rate drops to 26%.
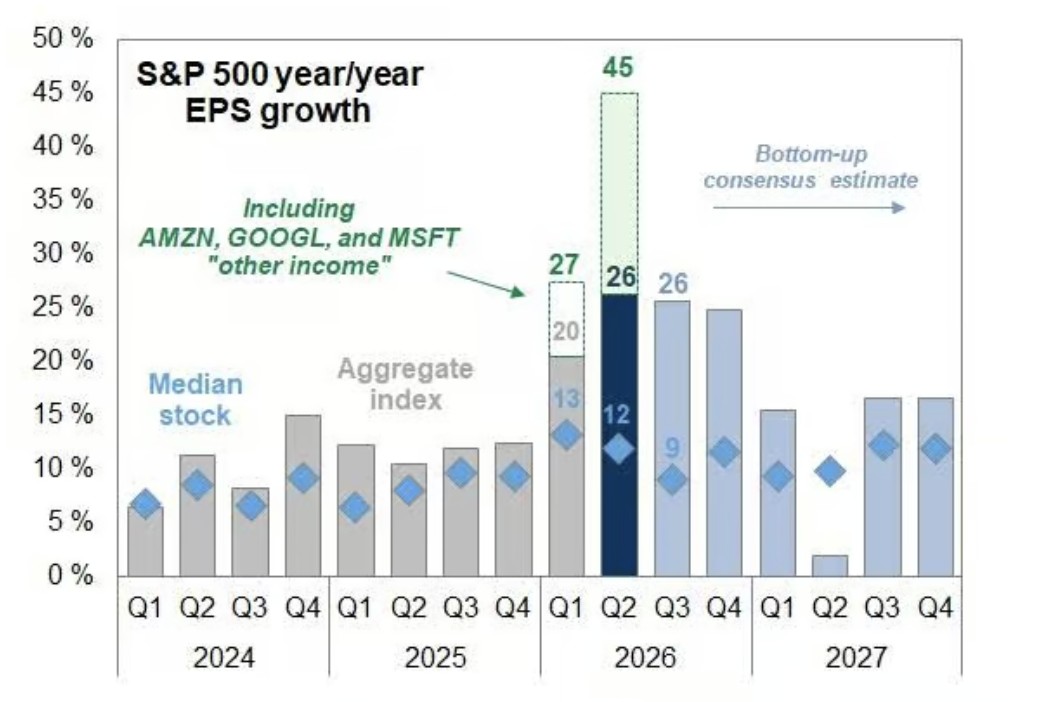
The source of this discrepancy lies in the fact that tech giants like Nvidia hold significant external equity investments. When the stock prices of these invested companies rise, the holders can record the corresponding Net Gain from Changes in Fair Value in their current period's profit and loss. While this accounting treatment is fully compliant within the framework of accounting standards, its essence is merely a reflection of asset price increases on financial statements, having no direct link to the profitability of a company's core business.
This implies that a significant portion of the widely cited "record" earnings growth does not come from product sales, service revenue, or improved operational efficiency, but rather from the rise of the stock market itself—a logic of circular self-reinforcement.
AI Infrastructure Theme Dominates Growth, Concentration Risk is Significant
Beyond book gains, another major pillar of earnings growth is also highly concentrated. According to the same Goldman Sachs report, AI infrastructure-related stocks contributed about one-third of the S&P 500's second-quarter EPS growth.
The internal logic of this theme forms a closed loop: hyperscale cloud computing vendors purchase chips from Nvidia, Nvidia invests part of its funds in companies that buy its chips, and each party mutually inflates the other's valuation. This capital cycle can continue to amplify book gains in the short term, but its sustainability heavily depends on the continuation of AI investment enthusiasm and the persistent rise in related asset prices.
In contrast, the second-quarter EPS growth rate for the median S&P 500 company was only 12%. The 33 percentage point chasm between the headline figure and the median clearly reveals the structure of current earnings growth: a few tech giants, through concentrated effects and special accounting items, have pushed the apparent earnings growth of the overall index to levels far exceeding the actual performance of most components.
Options Market Sentiment Reaches Historical Extremes
As earnings data raises structural questions, market sentiment indicators are also sending abnormal signals. Ismail Abbas, an analyst on Goldman Sachs' US derivatives trading desk, noted that single-day trading volume of S&P 500 index call options has surpassed 4 million contracts, setting an all-time high—higher than any point earlier this year and even exceeding the peak during the 2021 retail trading frenzy.
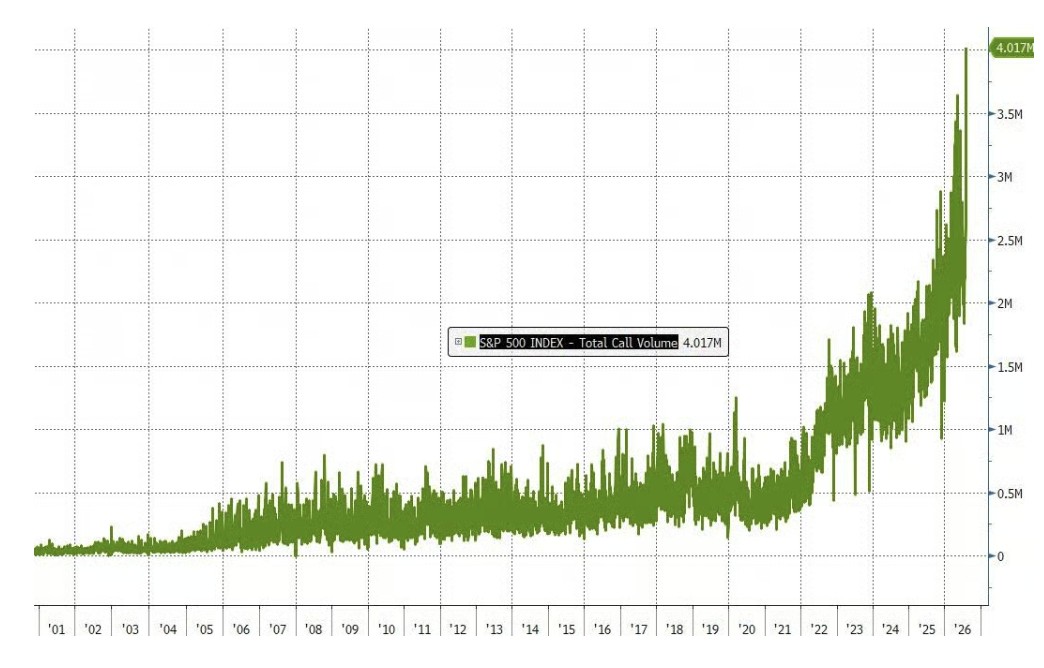
Price action was equally anomalous. Abbas pointed out that the index's actual daily volatility reached 179 basis points, while the expected range priced by implied volatility was only ±40 basis points. Actual volatility exceeded the priced magnitude by more than four times, with the direction skewed entirely upward. Goldman Sachs data shows the last time similar movements occurred was in December 2016.
Notably, despite these extreme readings, the Goldman Sachs trading desk rated the overall activity level of the day at only 4 out of 10. This means that behind the record-high call option volume and the unilateral rise four times greater than expected, market participants did not exhibit obvious signs of nervousness or hedging intent. This calmness itself may be the most noteworthy characteristic of the current market state.