
 I'm LongbridgeAI, I can summarize articles.
Kanematsu (TSE:8020) reported strong Q1 2026 earnings with sales of ¥272.2 billion and net income of ¥11.7 billion, driving a 56.2% one-year shareholder return. While its P/E ratio of 9.9x suggests undervaluation compared to peers, a DCF model indicates overvaluation. The stock trades below analyst targets, presenting mixed signals regarding future growth and risk exposure.
Kanematsu (TSE:8020) is on investor watch after reporting first quarter 2026 earnings on 4 August, with sales of ¥272,167 million and net income of ¥11,703 million, alongside higher earnings per share.
See our latest analysis for Kanematsu.
Kanematsu’s recent earnings release comes as the stock shows firm momentum, with a year to date share price return of 22.10% and a 1 year total shareholder return of 56.20%, signalling strong recent gains for long term holders.
If Kanematsu’s move has you rethinking where growth could come from next, it may be worth scanning other opportunities through our screener of 10 top founder-led companies
Kanematsu’s share price has surged, yet the stock still trades about 20% below the ¥2,660 analyst target while screens flag an apparent premium to intrinsic value. Is the market being cautious for good reason or not?
Preferred P/E of 9.9x: Is it justified?
On simple earnings terms, Kanematsu trades on a P/E of 9.9x, which screens as inexpensive relative to both the broader Japan market and its direct Trade Distributors peers.
The P/E multiple compares the current share price to earnings per share and helps you see how much the market is paying for each unit of profit. For a trading focused group like Kanematsu, where earnings are a key reference point for investors, this is a common way to frame valuation.
Kanematsu’s current P/E of 9.9x sits below the Japan market level of 14x, and also below the Trade Distributors industry average of 10.8x and the peer average of 11.4x. It also sits under an estimated fair P/E of 14.2x, which indicates a level the market could move towards if sentiment or expectations align more closely with that fair ratio.
Explore the SWS fair ratio for Kanematsu
Result: Price-to-earnings of 9.9x (UNDERVALUED)
However, Kanematsu’s wide exposure to cyclical sectors and an apparent premium to intrinsic value could quickly test sentiment if earnings or trading conditions soften.
Find out about the key risks to this Kanematsu narrative.
Another view on Kanematsu valuation
While the P/E of 9.9x makes Kanematsu look inexpensive, the SWS DCF model points the other way. It indicates a future cash flow value of ¥877.56 per share versus the current ¥2,213 price, which screens as overvalued. Is the market pricing in cash flows that may not materialise?
Look into how the SWS DCF model arrives at its fair value.
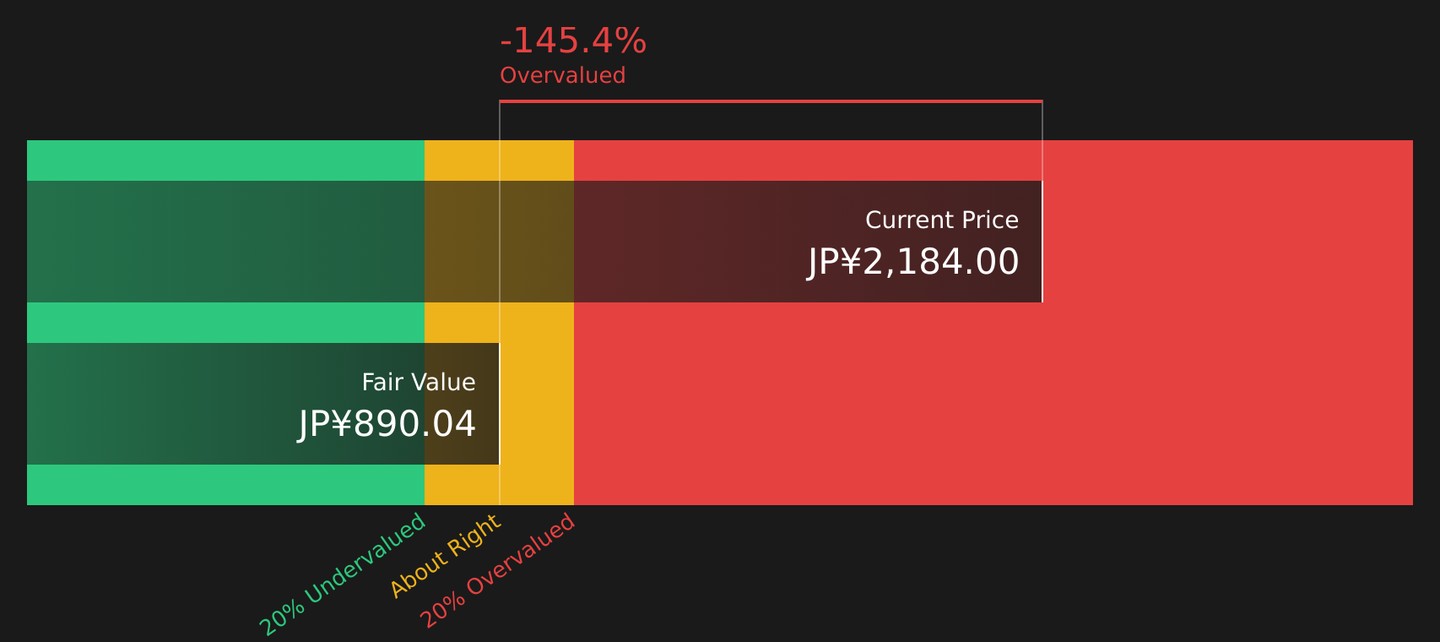
Simply Wall St performs a discounted cash flow (DCF) on every stock in the world every day (check out Kanematsu for example). We show the entire calculation in full. You can track the result in your watchlist or portfolio and be alerted when this changes, or use our stock screener to discover 18 high quality undervalued stocks. If you save a screener we even alert you when new companies match - so you never miss a potential opportunity.
Next Steps
After weighing both the upbeat and cautious signals around Kanematsu, it makes sense to move quickly, review the underlying data and decide what matters most to you. To see how the balance of risks and rewards looks in detail, take a close look at the 4 key rewards and 2 important warning signs.
Looking for more investment ideas beyond Kanematsu?
If Kanematsu has sharpened your focus on valuation and risk, do not stop here. Use the Simply Wall St screener to uncover other stocks that match your checklist.
- Target potential value opportunities that combine quality and attractive pricing by scanning our list of 18 high quality undervalued stocks.
- Strengthen your income stream by reviewing companies in the 43 dividend fortresses that focus on higher yields with resilience in mind.
- Reduce portfolio stress by focusing on companies in the 56 resilient stocks with low risk scores that score well on financial and risk checks.
This article by Simply Wall St is general in nature. We provide commentary based on historical data and analyst forecasts only using an unbiased methodology and our articles are not intended to be financial advice. It does not constitute a recommendation to buy or sell any stock, and does not take account of your objectives, or your financial situation. We aim to bring you long-term focused analysis driven by fundamental data. Note that our analysis may not factor in the latest price-sensitive company announcements or qualitative material. Simply Wall St has no position in any stocks mentioned.
Valuation is complex, but we're here to simplify it.
Discover if Kanematsu might be undervalued or overvalued with our detailed analysis, featuring fair value estimates, potential risks, dividends, insider trades, and its financial condition.
Access Free Analysis