China's July CPI Year-on-Year Growth Narrows to 0.5%, PPI Rises 3.5% Year-on-Year; AI-Driven Tablet Prices Rise 11.3% Month-on-Month
 Complete. Here is the key summary
In July, the CPI rose 0.5% year-on-year, with the growth rate falling by 0.5 percentage points from the previous month, mainly driven by a significant narrowing in the year-on-year increase in gasoline prices (by 16 percentage points). The CPI fell 0.1% month-on-month, with the decline narrowing by 0.2 percentage points compared to the previous month. The PPI rose 3.5% year-on-year, with the growth rate falling by 0.6 percentage points from the previous month. Fluctuations in international commodity prices were transmitted to domestic upstream industries such as petroleum and non-ferrous metals. Coupled with weather factors like high temperatures and typhoons suppressing demand for building materials and construction, the month-on-month decline in PPI widened by 0.4 percentage points to 0.7%
China's July price data shows that consumer-side inflation remained mild. A sharp drop in gasoline prices dragged down the year-on-year growth rate, while service prices and consumer electronics prices provided main support. On the production side, prices accelerated their month-on-month decline under the combined pressure of imported inflation and seasonal factors, with the year-on-year growth rate continuing to fall.
On Saturday, data from the National Bureau of Statistics showed:
The CPI rose 0.5% year-on-year in July, with the growth rate falling by 0.5 percentage points from the previous month, mainly affected by a significant narrowing in the year-on-year increase in gasoline prices (by 16 percentage points). Meanwhile, summer travel demand drove a noticeable month-on-month increase in service prices such as tourism and accommodation. Artificial intelligence boosted demand for consumer electronics, leading to significant price increases in related products. The CPI fell 0.1% month-on-month in July, with the decline narrowing by 0.2 percentage points compared to the previous month.
On the production side, the PPI rose 3.5% year-on-year, with the growth rate falling by 0.6 percentage points from the previous month. Fluctuations in international commodity prices were transmitted to domestic upstream industries such as petroleum and non-ferrous metals. Coupled with weather factors like high temperatures and typhoons suppressing demand for building materials and construction, the month-on-month decline in PPI widened by 0.4 percentage points to 0.7%.
Dong Lijuan, Chief Statistician of the Urban Department of the National Bureau of Statistics, interprets the CPI and PPI data for July 2026:
In July, influenced by international imported factors, the Consumer Price Index (CPI) fell 0.1% month-on-month and rose 0.5% year-on-year. The core CPI, excluding food and energy prices, rose 0.3% month-on-month and 0.9% year-on-year. The CPI generally maintained a mild increase. Domestic demand increased in some industries, but influenced by imported and seasonal factors, the Producer Price Index (PPI) for industrial producers fell 0.7% month-on-month and rose 3.5% year-on-year, with the growth rate falling by 0.6 percentage points from the previous month.
I. CPI month-on-month decline narrows, year-on-year increase remains mild
From a month-on-month perspective, the national CPI fell 0.1%, with the decline narrowing by 0.2 percentage points from the previous month.
Fluctuations in international market prices led to a 10.7% decrease in domestic gasoline prices, with the decline widening by 5.8 percentage points from the previous month, affecting the CPI to fall by approximately 0.35 percentage points month-on-month.
Food prices remained flat compared to the previous month, 0.6 percentage points lower than the seasonal level. Among food items, fresh vegetable prices rose 1.3%, and egg prices fell 2.1%, both significantly lower than seasonal levels. Seasonal fruits hit the market in large quantities with ample supply, causing fresh fruit prices to fall 3.8%, affecting the CPI to fall by approximately 0.07 percentage points month-on-month. The effects of comprehensive regulatory policies on pig production capacity became evident. Coupled with frequent extreme weather such as high temperatures and heavy rainfall in some areas pushing up transportation costs, pork prices turned from a 0.8% decrease in the previous month to a 4.1% increase, affecting the CPI to rise by approximately 0.07 percentage points month-on-month.
Artificial intelligence promoted the iteration and upgrade of consumer electronics, increasing demand and raising prices for related products. Prices for tablets, computers, and mobile phones rose by 11.3%, 5.5%, and 1.0% respectively, collectively affecting the CPI to rise by approximately 0.03 percentage points month-on-month.
Service prices turned from flat in the previous month to a 0.4% increase, affecting the CPI to rise by approximately 0.21 percentage points month-on-month. Among services, increased summer travel demand led to price increases of 7.2%, 6.5%, 4.2%, and 3.6% for travel agency fees, hotel accommodations, airfares, and vehicle rentals respectively, collectively affecting the CPI to rise by approximately 0.10 percentage points month-on-month. Policy-driven price adjustments continued in some areas, with medical service prices rising 1.1%, affecting the CPI to rise by approximately 0.07 percentage points month-on-month.
From a year-on-year perspective, the national CPI rose 0.5%, maintaining a mild increase. The year-on-year CPI growth rate fell by 0.5 percentage points from the previous month, mainly due to the slowing increase in gasoline prices. Gasoline prices rose 1.0%, with the growth rate falling by 16.0 percentage points from the previous month. Its upward pull on the CPI decreased by approximately 0.45 percentage points compared to the previous month, driving the energy price increase down to 0.6%.
Prices for industrial consumer goods excluding energy rose 1.5%, with the growth rate falling by 0.2 percentage points from the previous month, affecting the year-on-year CPI increase by approximately 0.37 percentage points. Among them, prices for gold jewelry, personal care products, and household appliances rose by 24.6%, 1.7%, and 0.2% respectively, with all growth rates slowing, collectively affecting the year-on-year CPI increase by approximately 0.13 percentage points. Prices for computers, tablets, and mobile phones rose by 17.4%, 17.2%, and 8.5% respectively, with all growth rates expanding, collectively affecting the year-on-year CPI increase by approximately 0.14 percentage points.
Service prices rose 0.7%, with the growth rate falling by 0.1 percentage points from the previous month, affecting the year-on-year CPI increase by approximately 0.36 percentage points. Among services, medical service prices rose 4.3%, with the growth rate expanding by 0.9 percentage points from the previous month, affecting the year-on-year CPI increase by approximately 0.28 percentage points. Prices for domestic housekeeping services, dining out, and education services rose by 1.3%, 1.0%, and 0.6% respectively, with overall stable growth rates.
Food prices fell 1.5%, with the decline narrowing by 0.1 percentage points from the previous month, affecting the year-on-year CPI decrease by approximately 0.25 percentage points. Among food items, pork prices fell 13.3%, with the decline narrowing by 2.6 percentage points from the previous month, affecting the year-on-year CPI decrease by approximately 0.25 percentage points. Price declines for fresh vegetables, fresh fruits, grains, edible oils, and dairy products ranged between 0.3% and 1.5%. Egg prices rose 17.8%, with the growth rate falling by 2.2 percentage points from the previous month. Price increases for mutton, beef, and poultry ranged between 1.6% and 6.2%.
II. PPI falls month-on-month, year-on-year growth slows
From a month-on-month perspective, the national PPI fell 0.7%, with the decline widening by 0.4 percentage points from the previous month.
The main characteristics of PPI month-on-month movement this month were: First, imported factors influenced price declines in relevant domestic industries. Prices for petroleum extraction, refined petroleum product manufacturing, and organic chemical raw material manufacturing fell by 11.8%, 8.4%, and 4.2% respectively. Prices for non-ferrous metal mining and dressing, and non-ferrous metal smelting and rolling processing fell by 2.1% and 1.7% respectively. These five industries collectively affected the PPI to fall by approximately 0.65 percentage points month-on-month.
Second, seasonal factors influenced price declines in some industries. In July, frequent high temperatures, rain, and typhoons slowed the progress of construction projects. Prices for ferrous metal smelting and rolling processing, and non-metallic mineral products fell by 0.8% and 0.5% respectively. Increased hydroelectric and wind power generation led to price declines of 10.3% and 3.9% respectively. These four industries collectively affected the PPI to fall by approximately 0.11 percentage points month-on-month.
Third, industrial transformation and upgrading, along with consumption quality improvement and expansion, drove increased demand and price rises in some industries. New momentum grew stronger, with booming development in fields such as artificial intelligence, high-end equipment, and new materials. Prices for intelligent unmanned aerial vehicle manufacturing, carbon-based new materials, and ship and related device manufacturing rose by 2.5%, 0.4%, and 0.3% respectively. Quality-oriented consumption grew rapidly, with prices for smart home consumer devices and skincare cosmetics manufacturing rising by 3.4% and 0.7% respectively.
From a year-on-year perspective, the national PPI rose 3.5%, with the growth rate falling by 0.6 percentage points from the previous month.
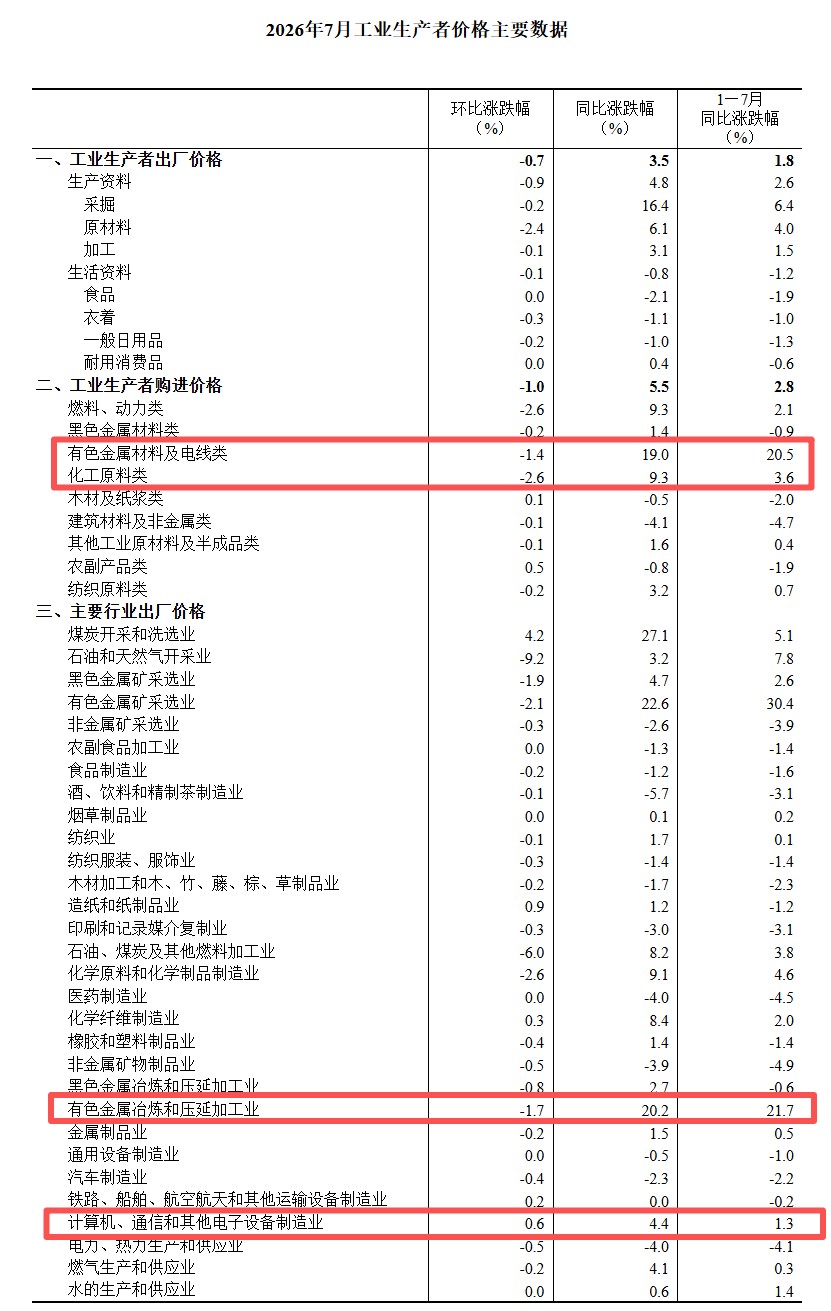
By industry, among the major industries with price increases, petroleum and natural gas extraction, petroleum, coal and other fuel processing, and chemical raw materials and chemical products manufacturing rose by 3.2%, 8.2%, and 9.1% respectively. Non-ferrous metal mining and dressing, and non-ferrous metal smelting and rolling processing rose by 22.6% and 20.2% respectively. Ferrous metal smelting and rolling processing rose by 2.7%. Growth rates in all these sectors fell from the previous month. These six industries collectively affected the year-on-year PPI increase by approximately 2.55 percentage points. Coal mining and washing rose by 27.1%, electrical machinery and equipment manufacturing rose by 5.7%, and computer, communication and other electronic equipment manufacturing rose by 4.4%. Growth rates in these three sectors expanded from the previous month, collectively affecting the year-on-year PPI increase by approximately 1.53 percentage points. The upward pull of these nine industries on the PPI decreased by 0.56 percentage points compared to the previous month.
The five industries with the largest downward pull on prices were: electricity, heat production and supply; automobile manufacturing; non-metallic mineral products; pharmaceutical manufacturing; and alcohol, beverages, and refined tea manufacturing. Declines ranged between 2.3% and 5.7%, collectively affecting the year-on-year PPI decrease by approximately 0.76 percentage points, a decrease of 0.05 percentage points from the previous month.
CPI Year-on-Year Growth Narrows, Month-on-Month Decline Also Narrows
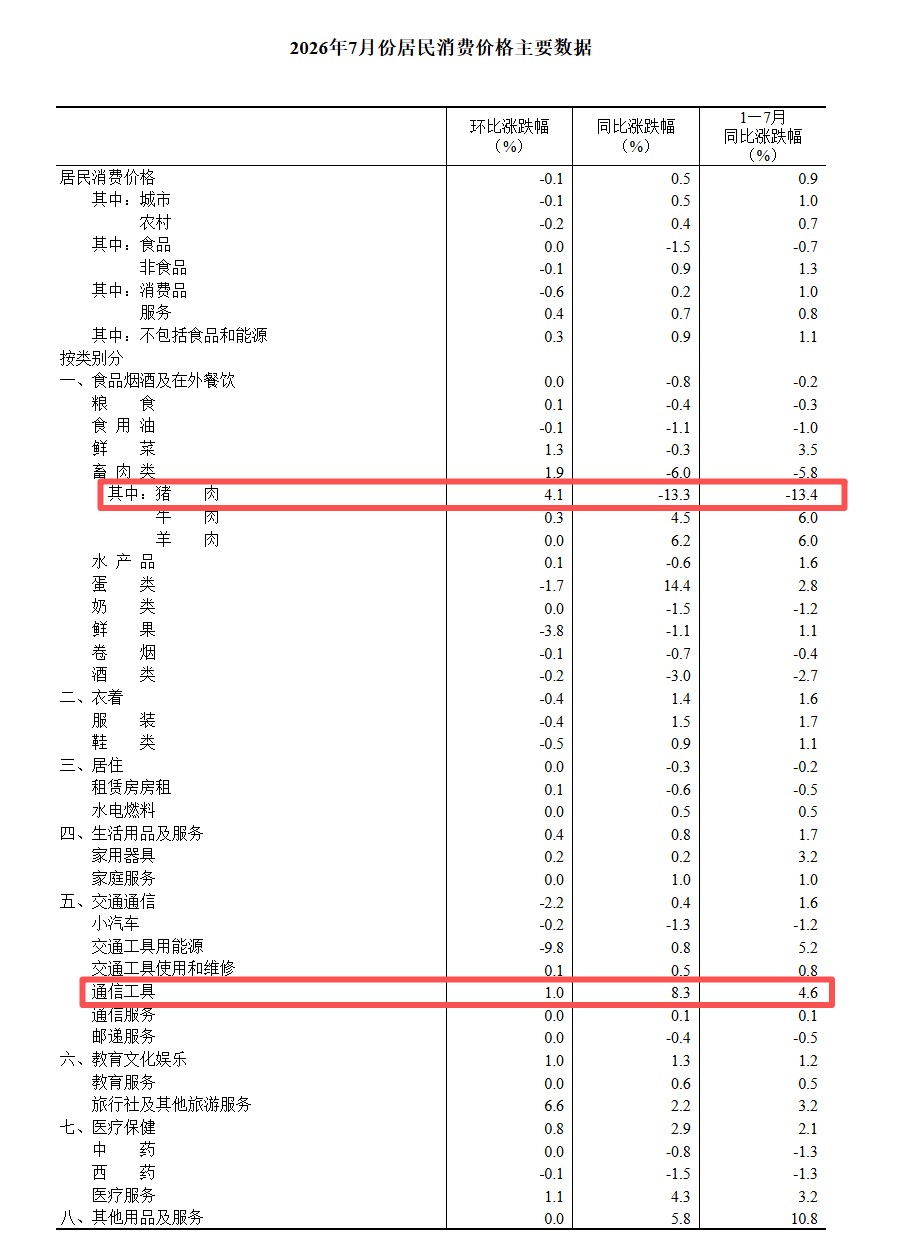
In July 2026, the national consumer price index rose 0.5% year-on-year. Among them, urban prices rose 0.5%, and rural prices rose 0.4%; food prices fell 1.5%, and non-food prices rose 0.9%; consumer goods prices rose 0.2%, and service prices rose 0.7%. On average from January to July, the national consumer price index rose 0.9% compared to the same period last year.
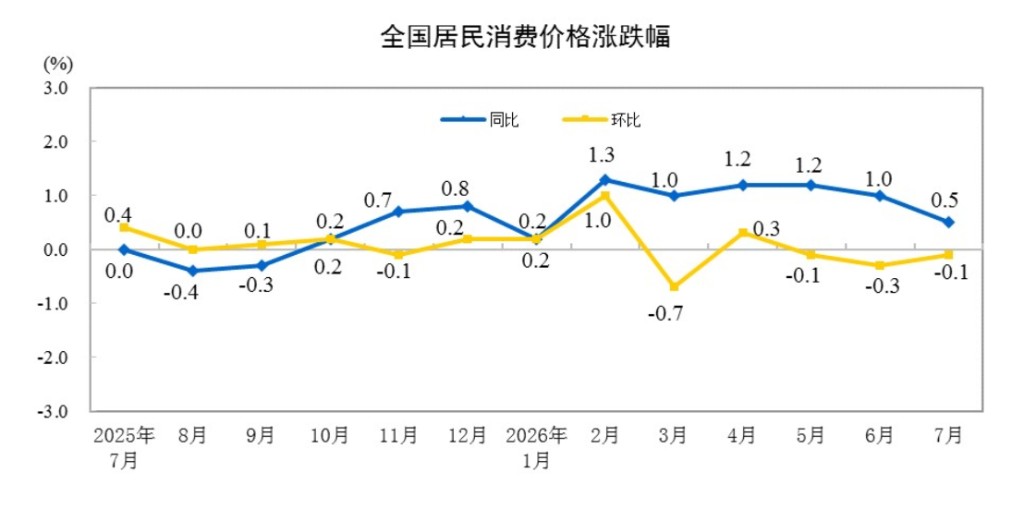
In July, the national consumer price index fell 0.1% month-on-month. Among them, urban prices fell 0.1%, and rural prices fell 0.2%; food prices remained flat, and non-food prices fell 0.1%; consumer goods prices fell 0.6%, and service prices rose 0.4%.
I. Year-on-Year Changes in Prices of Various Goods and Services
In July, prices for food, tobacco, alcohol, and dining out fell 0.8% year-on-year, affecting the CPI (Consumer Price Index) to fall by approximately 0.22 percentage points. Among food items, livestock meat prices fell 6.0%, affecting the CPI to fall by approximately 0.25 percentage points, with pork prices falling 13.3%; dairy prices fell 1.5%, affecting the CPI to fall by approximately 0.02 percentage points; fresh fruit prices fell 1.1%, affecting the CPI to fall by approximately 0.02 percentage points; egg prices rose 14.4%, affecting the CPI to rise by approximately 0.07 percentage points.
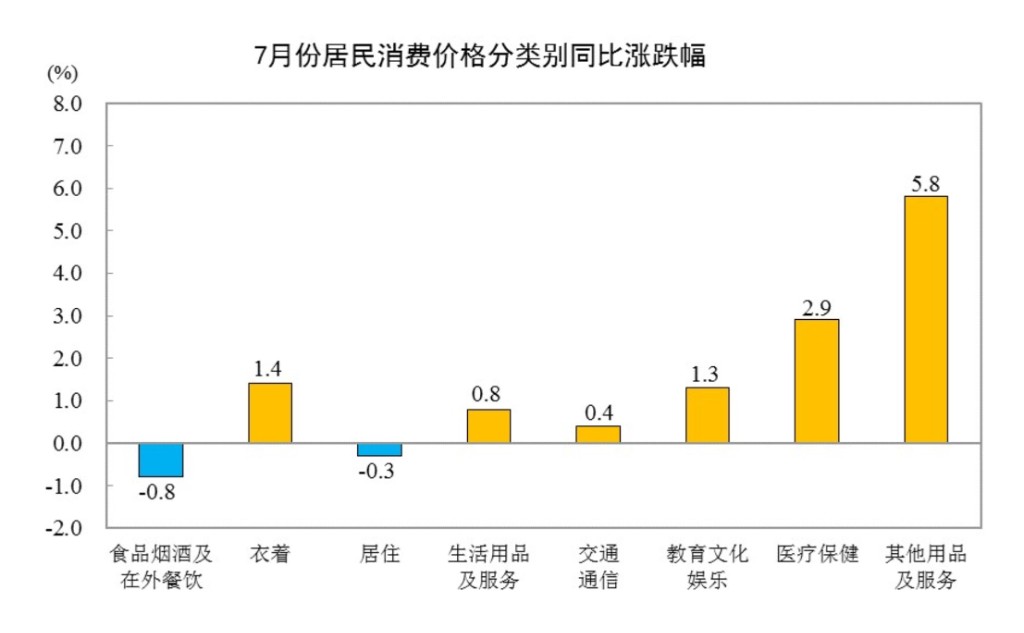
Prices for the other seven major categories saw six rises and one fall year-on-year. Among them, prices for other goods and services, and healthcare rose by 5.8% and 2.9% respectively; clothing, and education, culture, and entertainment prices rose by 1.4% and 1.3% respectively; household supplies and services, and transportation and communication prices rose by 0.8% and 0.4% respectively; housing prices fell 0.3%.
II. Month-on-Month Changes in Prices of Various Goods and Services
In July, prices for food, tobacco, alcohol, and dining out remained flat month-on-month. Among food items, livestock meat prices rose 1.9%, affecting the CPI to rise by approximately 0.07 percentage points, with pork prices rising 4.1%; fresh vegetable prices rose 1.3%, affecting the CPI to rise by approximately 0.02 percentage points; fresh fruit prices fell 3.8%, affecting the CPI to fall by approximately 0.07 percentage points; egg prices fell 1.7%, affecting the CPI to fall by approximately 0.01 percentage points.
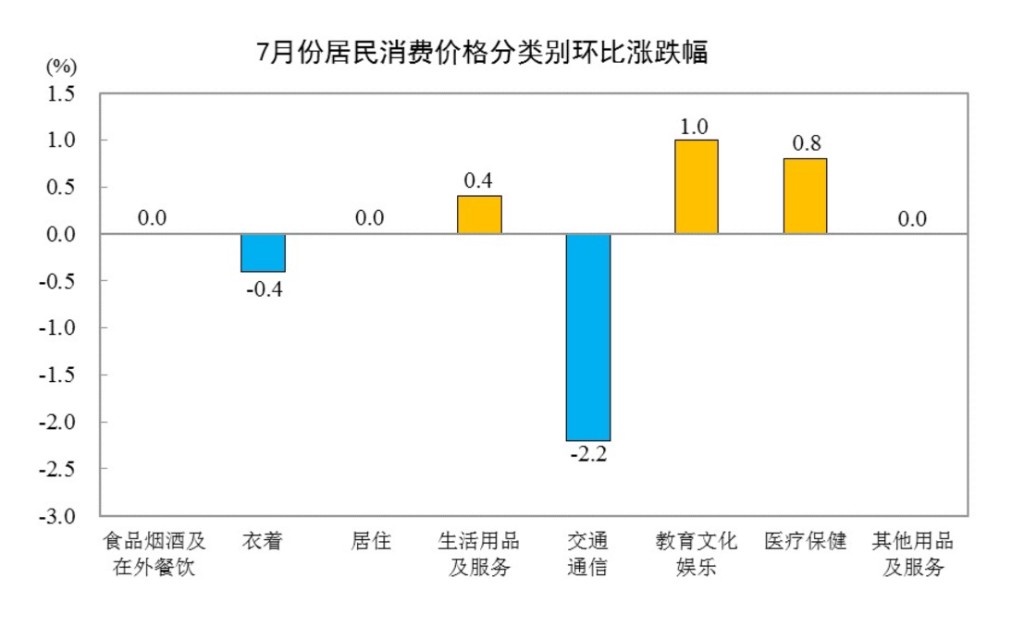
Prices for the other seven major categories saw three rises, two flats, and two falls month-on-month. Among them, education, culture, and entertainment; healthcare; and household supplies and services prices rose by 1.0%, 0.8%, and 0.4% respectively; housing, and other goods and services prices remained flat; transportation and communication, and clothing prices fell by 2.2% and 0.4% respectively.
PPI Year-on-Year Growth Narrows to 3.5%, Month-on-Month Decline Widens
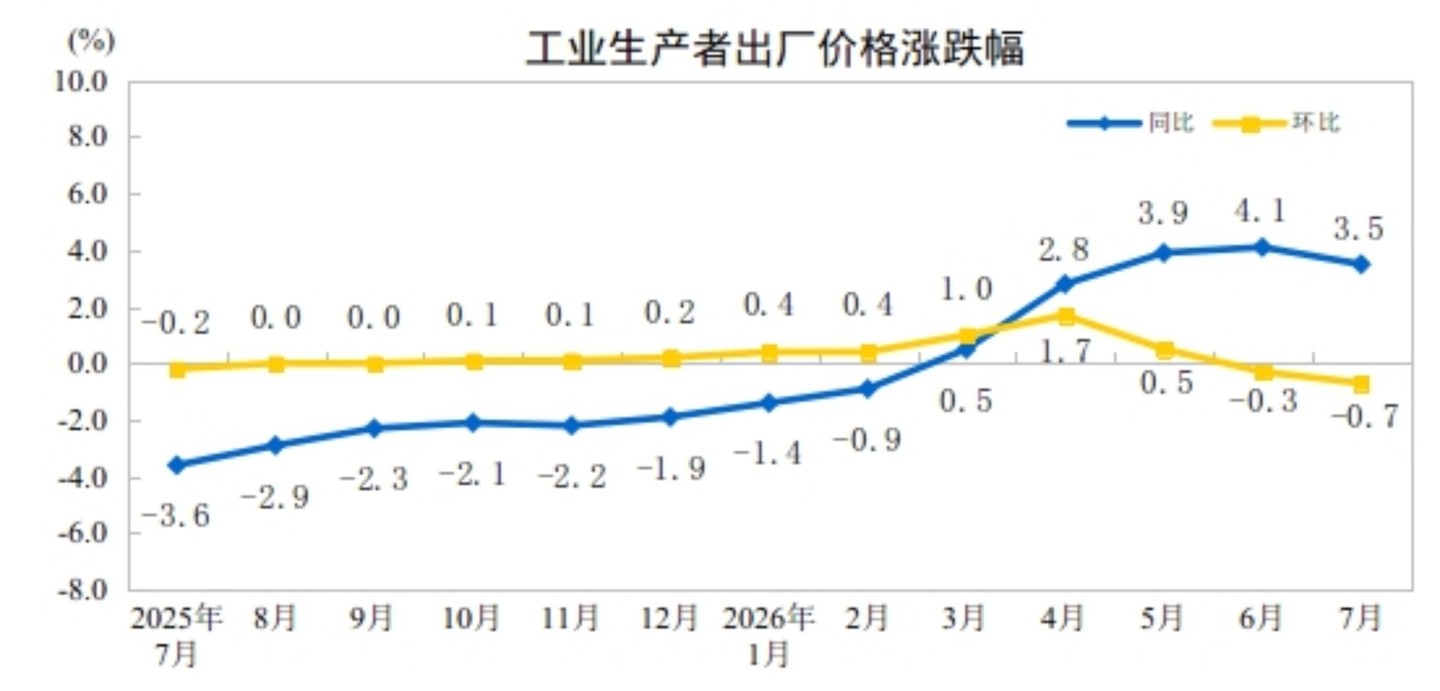
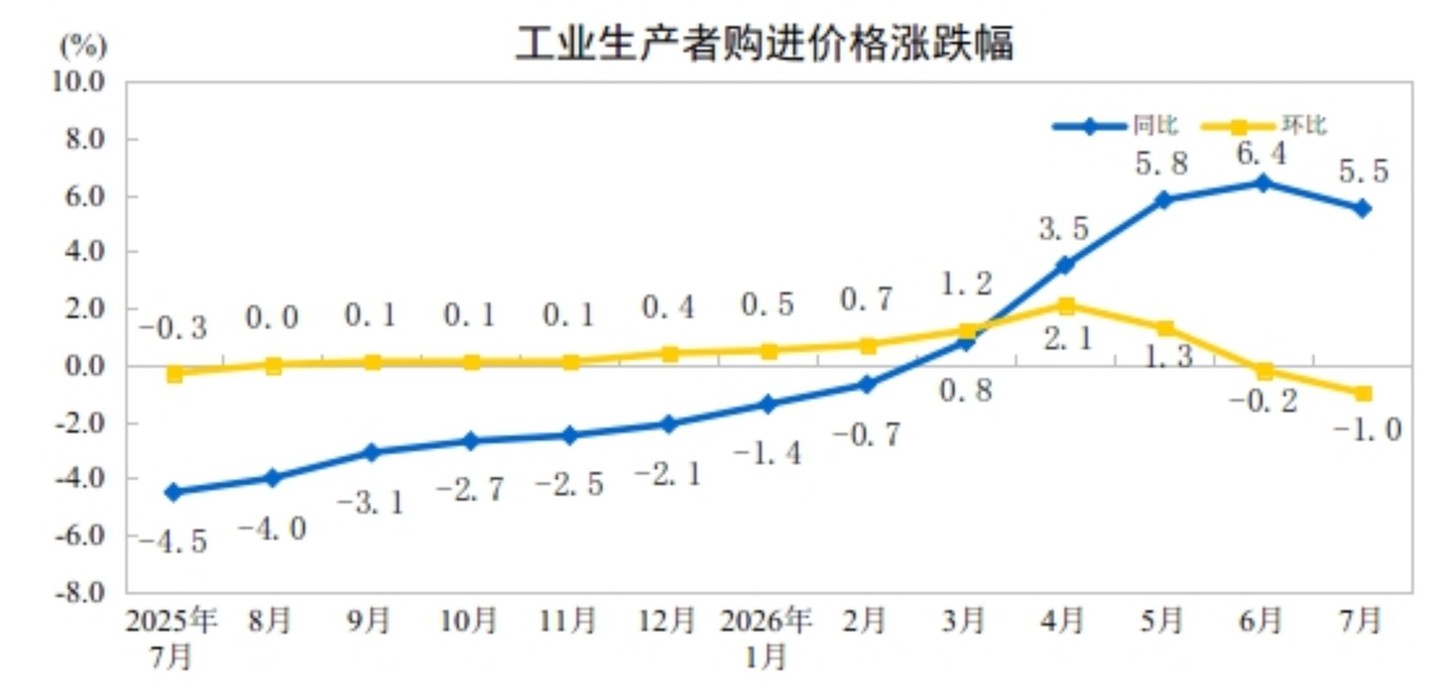
In July 2026, the national producer price index for industrial producers rose 3.5% year-on-year and fell 0.7% month-on-month. The purchase price index for industrial producers rose 5.5% year-on-year and fell 1.0% month-on-month. On average from January to July, the producer price index for industrial producers rose 1.8% compared to the same period last year, and the purchase price index rose 2.8%.
I. Year-on-Year Changes in Industrial Producer Prices
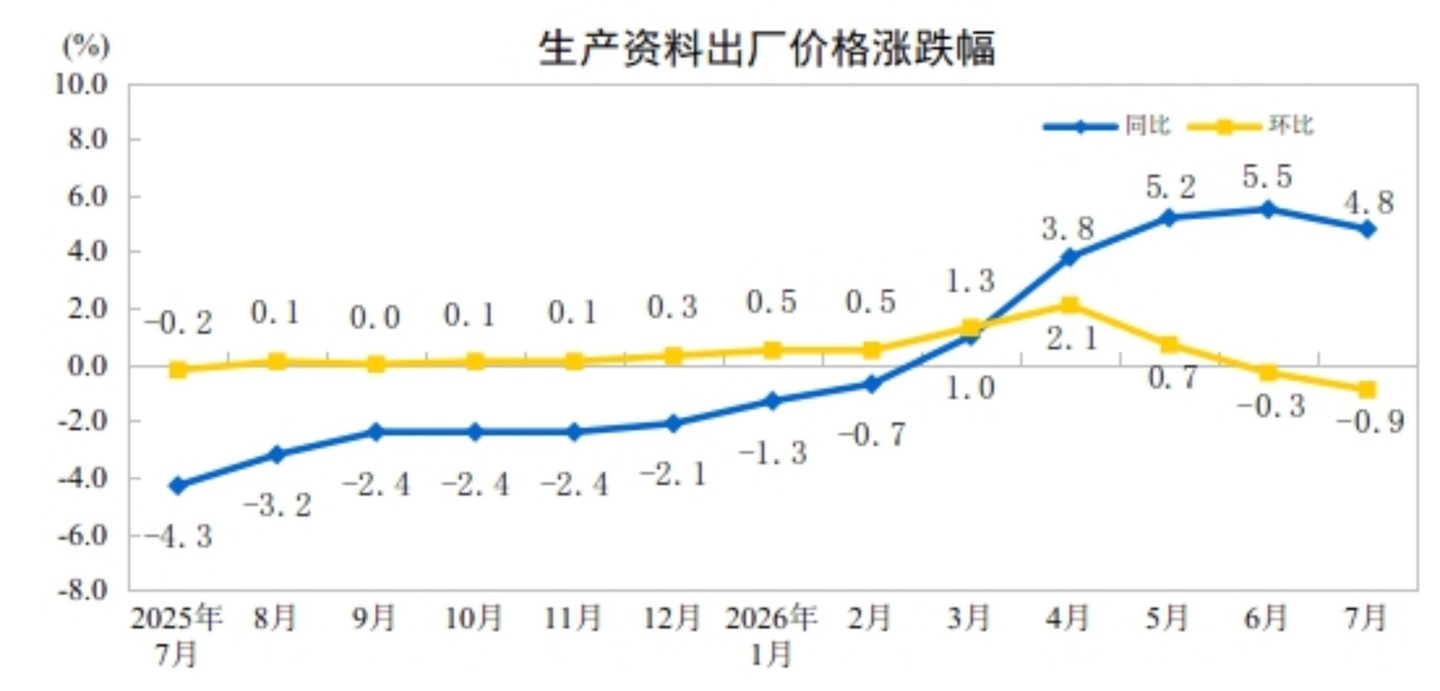
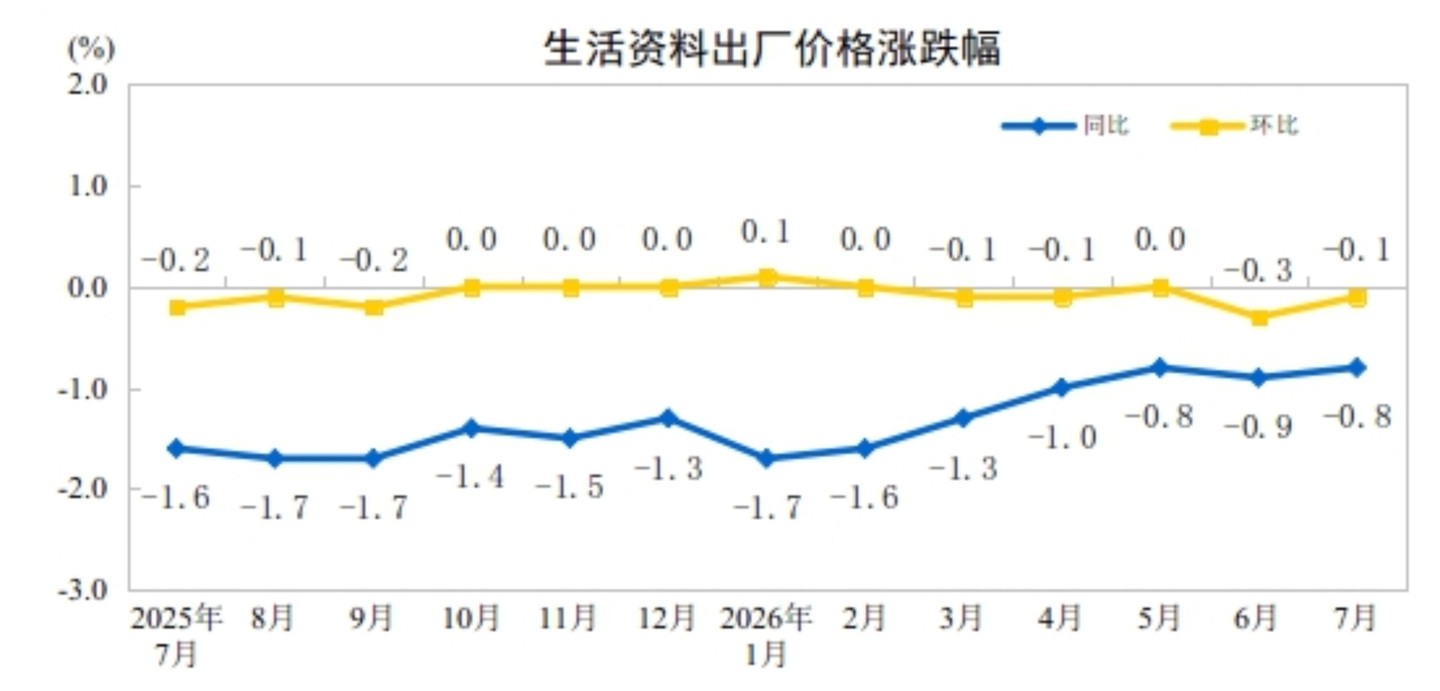
In July, among the producer prices for industrial producers, prices for means of production rose 4.8% year-on-year, affecting the overall level of producer prices for industrial producers to rise by approximately 3.72 percentage points. Among them, prices for the mining industry rose 16.4%, prices for the raw materials industry rose 6.1%, and prices for the processing industry rose 3.1%. Prices for means of subsistence fell 0.8%, affecting the overall level of producer prices for industrial producers to fall by approximately 0.17 percentage points. Among them, food prices fell 2.1%, clothing prices fell 1.1%, general daily necessities prices fell 1.0%, and durable consumer goods prices rose 0.4%.
Among the purchase prices for industrial producers, prices for non-ferrous metal materials and wires rose 19.0%, prices for fuel and power, and chemical raw materials both rose 9.3%, prices for textile raw materials rose 3.2%, and prices for ferrous metal materials rose 1.4%; prices for building materials and non-metallic materials fell 4.1%, and prices for agricultural and sideline products fell 0.8%.
II. Month-on-Month Changes in Industrial Producer Prices
In July, among the producer prices for industrial producers, prices for means of production fell 0.9% month-on-month, affecting the overall level of producer prices for industrial producers to fall by approximately 0.70 percentage points. Among them, prices for the mining industry fell 0.2%, prices for the raw materials industry fell 2.4%, and prices for the processing industry fell 0.1%. Prices for means of subsistence fell 0.1%, affecting the overall level of producer prices for industrial producers to fall by approximately 0.01 percentage points. Among them, prices for food and durable consumer goods remained flat, clothing prices fell 0.3%, and general daily necessities prices fell 0.2%.
Among the purchase prices for industrial producers, prices for fuel and power, and chemical raw materials both fell 2.6%, prices for non-ferrous metal materials and wires fell 1.4%, prices for ferrous metal materials and textile raw materials both fell 0.2%, and prices for building materials and non-metallic materials fell 0.1%; prices for agricultural and sideline products rose 0.5%.