
Is a Turning Point for the US Dollar Imminent? 2024 vs. 2026
 I'm LongbridgeAI, I can summarize articles.
The unexpectedly weak July Non-Farm Employment data triggered a decline in the US dollar and US Treasury yields, prompting market comparisons with the summer of 2024. The similarity lies in the cooling labor market triggering a shift in rate cut expectations. In 2026, the market is currently experiencing repeated shifts between rate cut and rate hike expectations, driven by geopolitical conflicts and AI-driven demand pushing up inflation. However, negative growth in non-farm payrolls suggests a cooling of economic fundamentals, creating uncertainty regarding the Federal Reserve's policy path
Last Friday’s surprisingly weak July Non-Farm Employment data triggered a decline in the US dollar and US Treasury yields. The trigger point and market patterns inevitably recall the summer of 2024, as both periods share many similarities in terms of fundamentals, the external environment of yen intervention, and technical aspects.
Similarity 1: Weakening Labor Market
The trigger for both market moves was the July Non-Farm Employment data missing expectations.
On August 2, 2024, the July non-farm payrolls increased by only 114,000, significantly below the market expectation of 175,000; the unemployment rate rose from 4.1% to 4.3%, directly triggering the “Sahm Rule,” which rapidly intensified market concerns about a US economic recession. Coupled with the subsequent downward revision of non-farm payrolls for the previous year by 818,000 by the Bureau of Labor Statistics, this cleared the way for the Federal Reserve to begin cutting interest rates.
The July Non-Farm Employment data released on August 7, 2026, showed an unexpected decrease of 23,000 jobs, far missing the market expectation of 80,000; employment data for May and June were collectively revised down by 10,300, and the three-month average of job creation was only 20,000, indicating a significant cooling in employment fundamentals. However, the unemployment rate from the household survey fell for two consecutive months to 4.1%, indicating that the labor market has not experienced a severe wave of layoffs.
Similarity 2: Shift in Federal Reserve Interest Rate Expectations
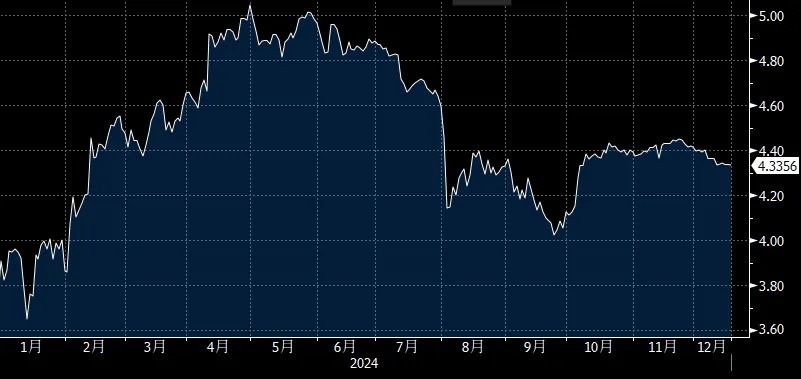
2024 Rate Cut Expectations: 7 cuts → 1 cut → 5 cuts, with an actual cumulative rate cut of 100bp for the full year (50bp in September, 25bp in November, 25bp in December)
- Overly dovish pricing: At the beginning of 2024, the market priced in cumulative rate cuts of up to 170bp by the end of 2024.
- Hawkish repricing: However, due to inflation rising beyond expectations and the resilience of the labor market, rate cut expectations were repeatedly delayed. By June 2024, the market only priced in one rate cut for the year.
- Another dovish shift: From July to September 2024, weakening labor conditions, falling inflation, and clear signals from Powell at the Jackson Hole Annual Meeting led the Federal Reserve to cut rates by an unexpected 50bp in September.
Figure 1: Interest rate futures market expectations for interest rates at the end of 2024
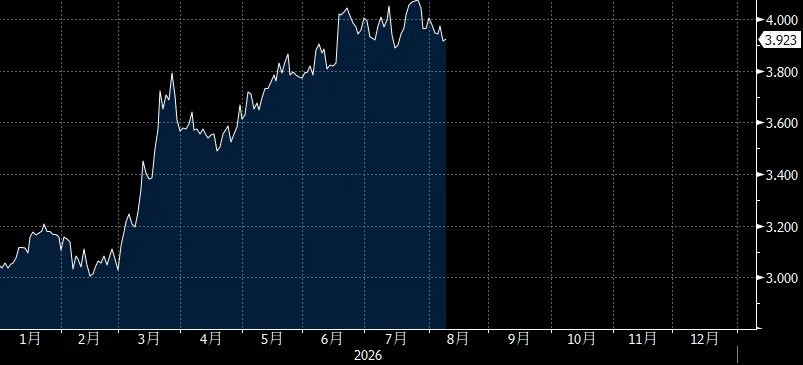
2026 Rate Cut/Hike Expectations: 2 rate cuts → 2 rate hikes
- Rising rate hike expectations: Driven by factors such as US-Iran geopolitical conflicts pushing up oil prices and AI computing infrastructure construction boosting demand for industrial goods, US inflation rose, causing the market to shift from pricing in rate cuts at the beginning of the year to pricing in rate hikes.
- However, rate hike expectations did not drop significantly after this negative non-farm payroll growth, mainly due to inflation concerns: In 2024, inflation continued to fall, providing the Federal Reserve with sufficient confidence to cut rates; but currently, inflation indicators remain high, with the core PCE year-on-year still reaching 3.3% in July, forming a stagflation scenario with weakening employment data, making it difficult for the Federal Reserve to turn dovish.
Figure 2: Interest rate futures market expectations for interest rates at the end of 2026
Similarity 3: Yen Exchange Rate Intervention
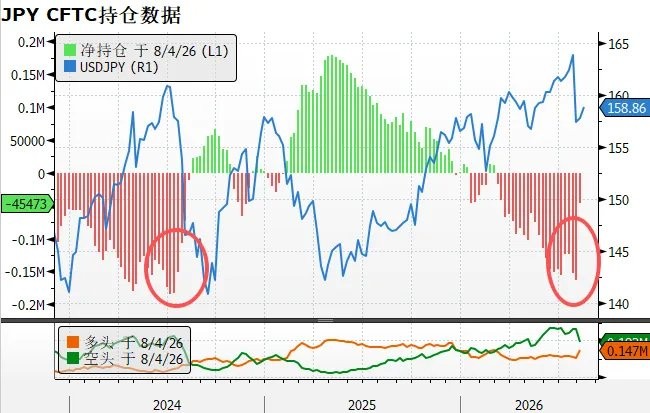
In July 2024, after the US June CPI data missed expectations, the Bank of Japan (BOJ) took advantage of the window of a weaker US dollar following the data release to intervene in the yen exchange rate, suppressing long USD/JPY positions and fueling a phased decline in the US dollar.
After the July 2026 FOMC meeting concluded, the US and Japan launched joint exchange rate intervention, triggering the unwinding of yen carry trades, which also became a short-term driver suppressing the US Dollar Index.
Figure 3: CFTC holdings show significant unwinding of short yen positions
Similarity 4: Decline in US Dollar Long Positions
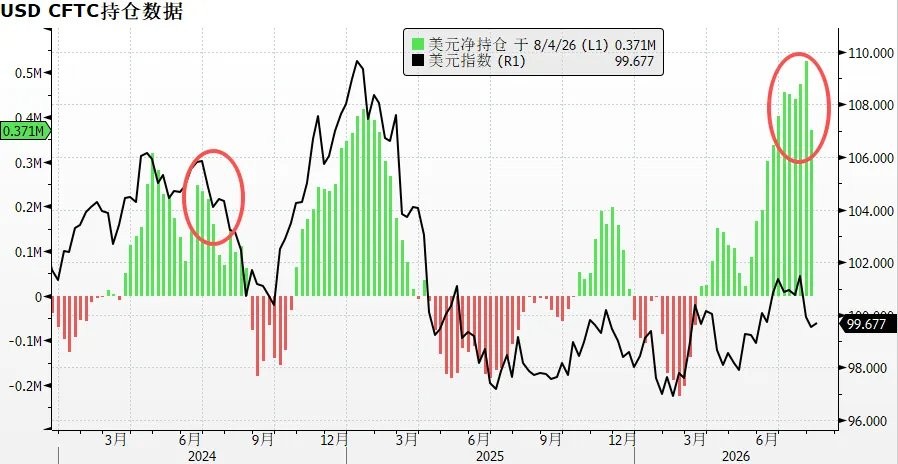
CFTC non-commercial holdings show that net long US dollar positions declined from highs in the summers of both 2024 and 2026, but the difference is that long positions were more crowded in 2026.
Figure 4: US dollar long positions decline from highs
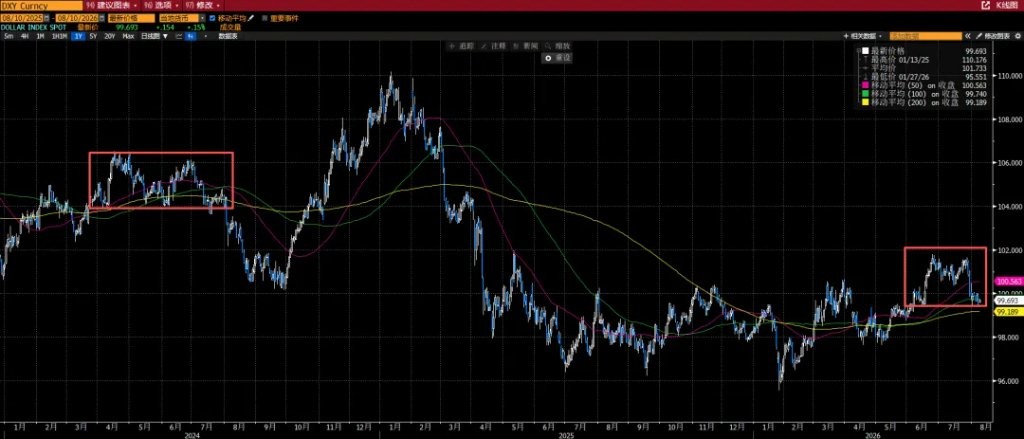
Similarity 5: Technical Pattern Shows Double Top for the US Dollar Index
In 2024, the US Dollar Index formed a double top pattern at the 106 level. After breaking below the neckline of 104 in August, it continued to decline, falling cumulatively by 6% from the July high to the end of September.
In 2026, the US Dollar Index formed a double top pattern at 101.8. It is currently oscillating around the support level near 99.5. If this support line is broken, further declines are expected.
Figure 6: US Dollar Index Trend: 2024 vs. 2026
Summary:
Both 2024 and 2026 saw signals of weakening employment, but the difference lies in inflation.
- 2024 was a standard economic cooling cycle, with inflation steadily falling towards the 2% target. The weakening labor market provided an excellent opportunity for the Federal Reserve to initiate easing;
- In contrast, although economic data cooled in 2026, inflation levels remained high. Coupled with hawkish divisions within the FOMC, the Federal Reserve could not smoothly shift to dovish easing. This is why the US dollar's reaction was limited despite the negative non-farm payroll data.
The July CPI data to be released on August 12 will be a watershed moment for the market. If inflation data falls significantly, the US Dollar Index may only see a smooth downward trend after breaking below the double top support line and the key support level of the 200-day moving average at 99.2.
Risk Warning and Disclaimer
Market risks exist; investment requires caution. This article does not constitute personal investment advice, nor does it consider the specific investment objectives, financial status, or needs of individual users. Users should consider whether any opinions, views, or conclusions in this article align with their specific circumstances. Investors bear their own responsibility for investments made based on this content.