
CICC: Has global liquidity reached a turning point?
 I'm LongbridgeAI, I can summarize articles.
CICC released a research report stating that although global liquidity has retreated from its peak, M1 and M2 are still in the expansion range and have not confirmed a tightening inflection point. If U.S. inflation falls and employment cools, the Federal Reserve's policy may shift towards easing, which would be favorable for stocks, bonds, and gold. It is recommended to continue overweighting gold, remain bullish on AI and technology growth as the main line, and overweight A-shares and Hong Kong stocks, while maintaining a benchmark allocation to U.S. stocks
According to the Zhitong Finance APP, China International Capital Corporation (CICC) released a research report stating that if the July CPI forecast is realized, U.S. inflation will significantly decline year-on-year for the second consecutive month. Coupled with a cooling job market, the Federal Reserve's tightening narrative may further reverse, and stocks, bonds, and gold are expected to continue benefiting from the return of easing trades. The gold bull market has not ended; the window for reallocation after previous adjustments has opened, and it is recommended to continue overweighting gold. The recent rise in traditional sectors may not be sustainable, and evidence for style rotation is still insufficient. It is advisable to remain bullish on AI and technology growth as the main line. Driven by the technology market, both the U.S. and Chinese stock markets may perform well in the second half of the year, with recommendations to overweight A-shares and Hong Kong stocks while maintaining a standard allocation to U.S. stocks.
Global liquidity has retreated from its peak but remains in an easing range overall
In the first half of 2026, global assets faced two liquidity tightening shocks—first with the nomination of Jerome Powell as Federal Reserve Chairman in January, followed by the outbreak of the U.S.-Iran conflict at the end of February—leading to a complete reversal of global central bank interest rate cut expectations to rate hike expectations. The U.S. dollar strengthened temporarily, putting pressure on major asset classes such as stocks, bonds, and gold, raising market concerns that liquidity is approaching a tightening inflection point. AI-related assets are already in a state of high expectations, high valuations, and high crowding, making them particularly sensitive to changes in liquidity.
To comprehensively track the operation of global liquidity, CICC summarized the balance sheets of central banks in major economies such as China, the United States, the Eurozone, Japan, the United Kingdom, and Canada, as well as the total M1 and M2 scales, calculating their year-on-year growth rates. It was found that the trends of these three liquidity indicators are basically consistent. Although liquidity indicators have retreated since February 2026, a tightening inflection point has not yet been confirmed. M1 and M2 remain in the expansion range, while the growth rate of central bank balance sheets has slightly turned negative.
Chart 1: The year-on-year trends of M1, M2, and central bank balance sheets in major economies are consistent and currently remain in the expansion range
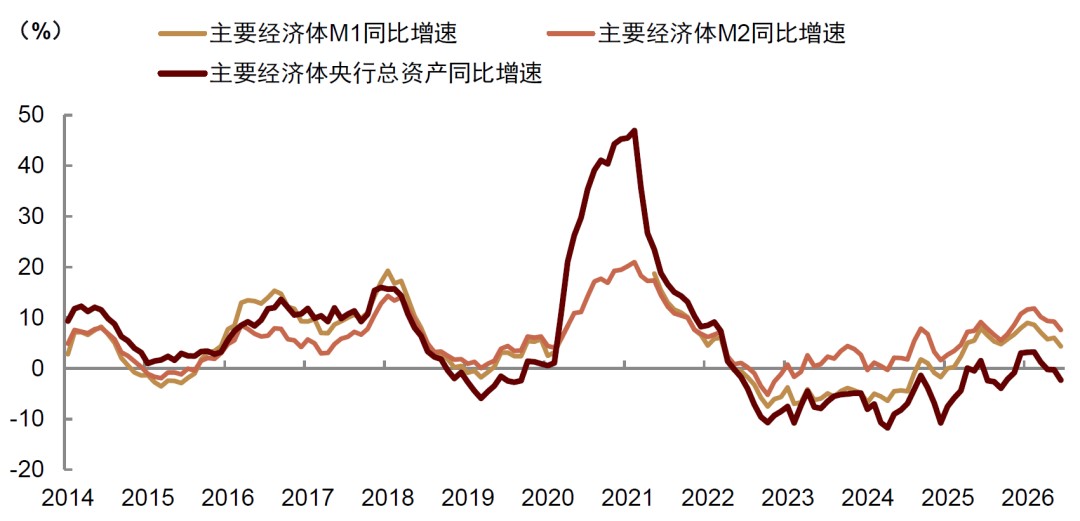
Note: Data as of June 2026, including data from China, the United States, the Eurozone, Japan, the United Kingdom, and Canada, converted to U.S. dollars at the end-of-period exchange rate.
Source: FRED, ECB, BoJ, PBoC, BoE, BoC, CICC Research Department
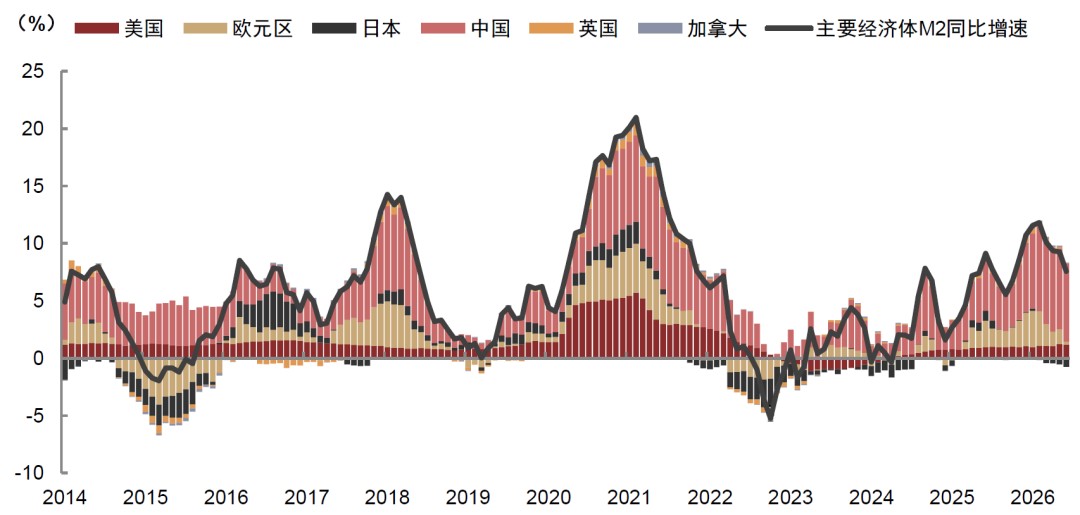
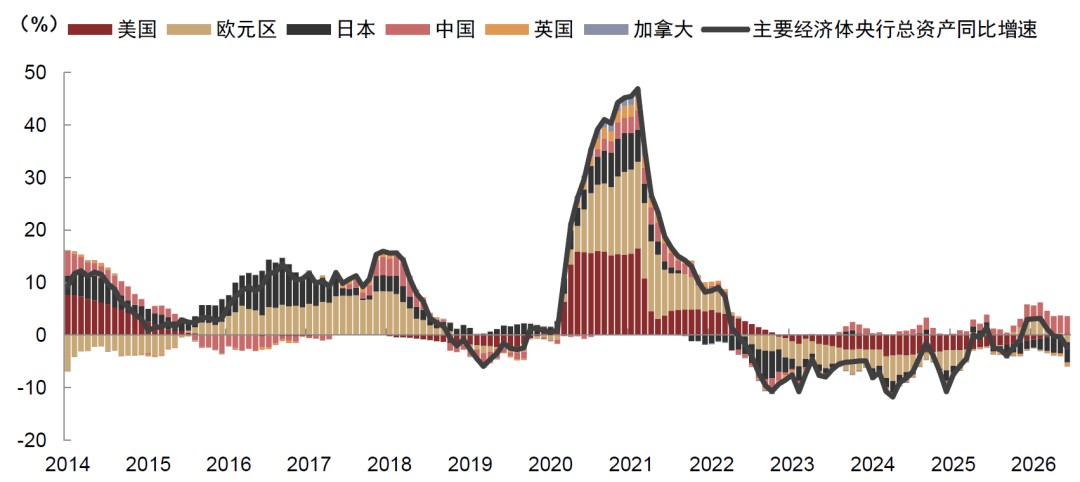
M2 is broad liquidity, covering a wider range and providing stronger guidance on overall liquidity than central bank balance sheets. The balance sheet reduction of some central banks or credit contraction in individual countries cannot simply be equated with a global "liquidity shortage." By country, China's current positive contribution to the growth of M1, M2, and total central bank assets among major economies is the most significant, while the U.S. also has a strong contribution to M1 growth. In contrast, Japan is the only economy with a negative contribution in M1 and M2, and its total central bank assets are still contracting.
Chart 2: China and the U.S. are the main contributors to M1 growth among major economies, while Europe, the UK, and Canada provide positive contributions, and Japan is contracting
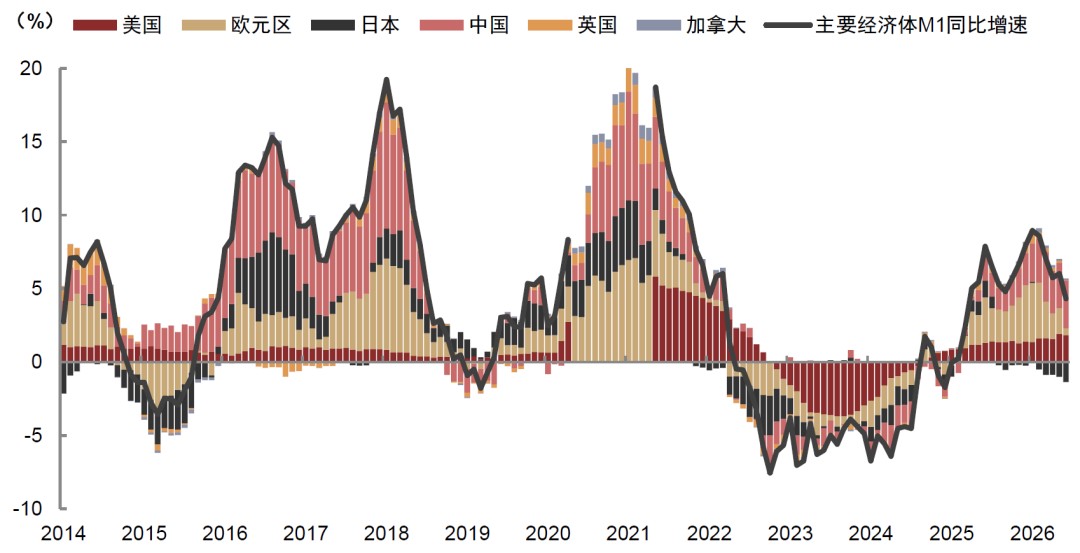 Note: The U.S. M1 has adjusted its statistical caliber since May 2020. To avoid the impact of caliber breakpoints, this chart does not include the year-on-year growth rate of U.S. M1 from May 2020 to April 2021.
Source: FRED, ECB, BoJ, PBoC, BoE, BoC, China International Capital Corporation Research Department
Chart 3: China is the main contributor to M2 growth among major economies, while Europe and North America provide positive contributions, and Japan is contracting
Source: FRED, ECB, BoJ, PBoC, BoE, BoC, China International Capital Corporation Research Department
Chart 4: China is the main positive contributor to central bank balance sheet expansion, Japan is the main negative contributor, overall year-on-year is negative but the decline is slowing
Source: FRED, ECB, BoJ, PBoC, BoE, BoC, China International Capital Corporation Research Department
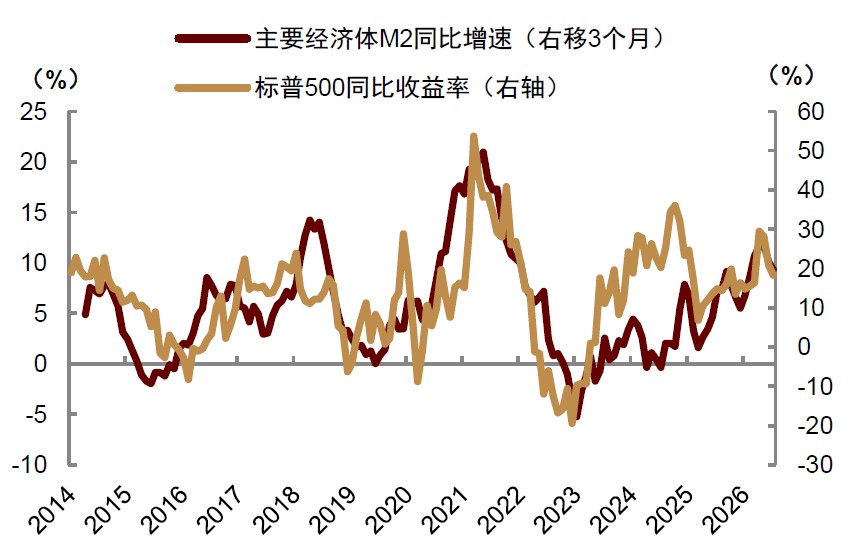
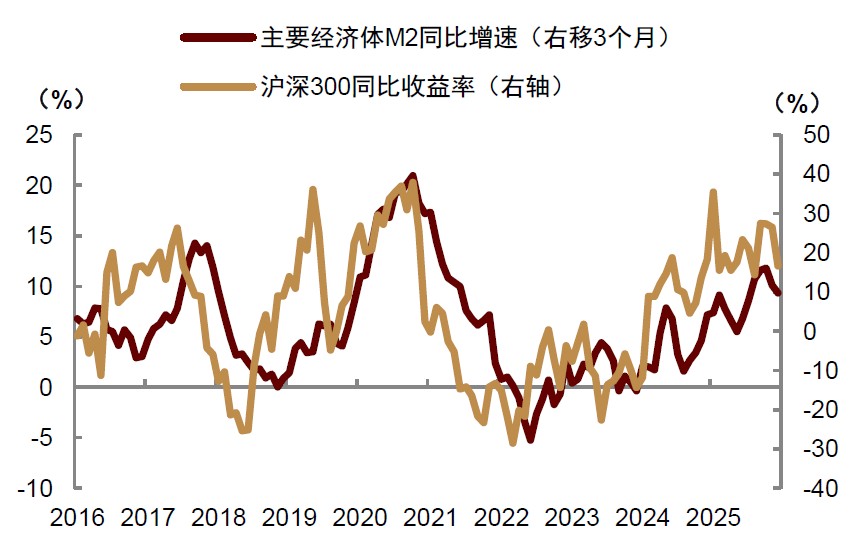
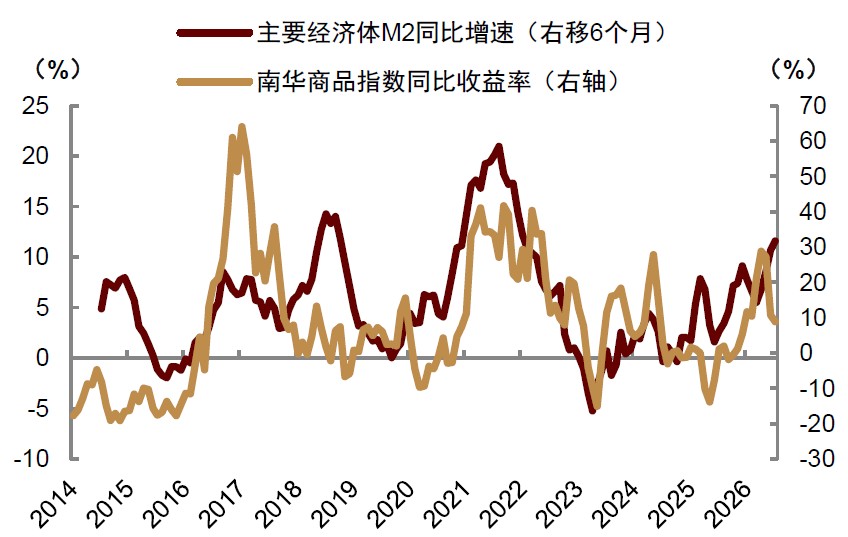
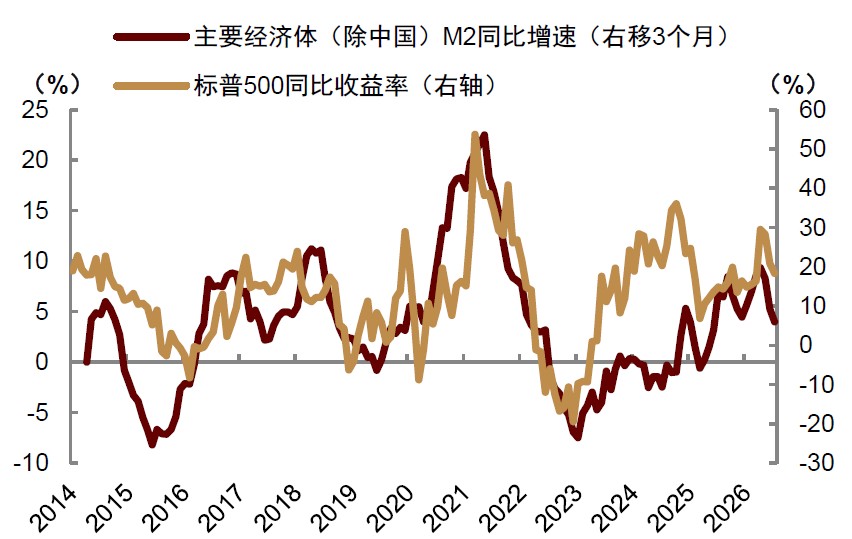
China International Capital Corporation has found that the year-on-year changes in M2 among major economies lead the performance of U.S. and Chinese stocks by about 3 months and lead commodity performance by about 6 months. Excluding China's M2, the growth rate of M2 in overseas countries still has a significant leading guiding effect on global assets. According to the above analysis, although liquidity expectations tightened significantly in the first half of the year, global liquidity has actually continued to trend towards easing.
Chart 5: Year-on-year growth rate of M2 among major economies leads the S&P 500 index by about 3 months
Source: FRED, BIS, ECB, Wind, Haver, China International Capital Corporation Research Department
Chart 6: Year-on-year growth rate of M2 among major economies leads the CSI 300 index by about 3 months
Source: FRED, BIS, ECB, Wind, Haver, China International Capital Corporation Research Department
Chart 7: Year-on-year growth rate of M2 among major economies leads the South China Commodity Index by about 6 months
 Data source: FRED, BIS, ECB, Wind, Haver, China International Capital Corporation Research Department
Chart 8: Excluding China, the year-on-year growth rate of M2 in other major economies also leads the S&P 500 index by about 3 months
Data source: FRED, BIS, ECB, Wind, Haver, China International Capital Corporation Research Department
Global liquidity is expected to further ease in H2 2026
Looking ahead, will global liquidity trend towards easing or tightening? In the asset outlook for H2 2026 released in early June, China International Capital Corporation suggested that market concerns about geopolitical escalation, inflation resilience, and Federal Reserve tightening may be "false risks." A more likely scenario in the second half of the year is a de-escalation of geopolitical conflicts, a downward trend in inflation, and a dovish shift in Federal Reserve policy, leading to further easing of global liquidity.
In the past two months, China International Capital Corporation's "anti-consensus" forecast has begun to materialize: regarding inflation, U.S. inflation has not shown resilience, with June CPI inflation significantly falling below expectations, nominal CPI decreasing by 0.4% month-on-month, and core CPI showing almost zero growth. On the policy front, the July FOMC meeting did not implement "preemptive rate hikes," but instead released clear dovish signals.
China International Capital Corporation has consistently believed that "preemptive rate hikes" lack fundamental support, and maintaining the policy interest rate unchanged in July was an appropriate policy decision, with the following logic:
-
Prior to the June meeting, U.S. inflation was as high as 4.2%, and employment data was strong. Faced with such pressure, the Federal Reserve chose not to raise interest rates. In contrast, before the July meeting, U.S. inflation had significantly fallen below expectations, and employment data had clearly slowed down, providing the Federal Reserve with even less reason to raise rates.
-
Although oil prices rebounded in July, the probability of the U.S.-Iran situation easing before the midterm elections is relatively high. If the Federal Reserve raises rates due to concerns about oil prices, and if Trump suddenly TACO, leading to a significant drop in oil prices, the Federal Reserve's policy would become extremely passive.
-
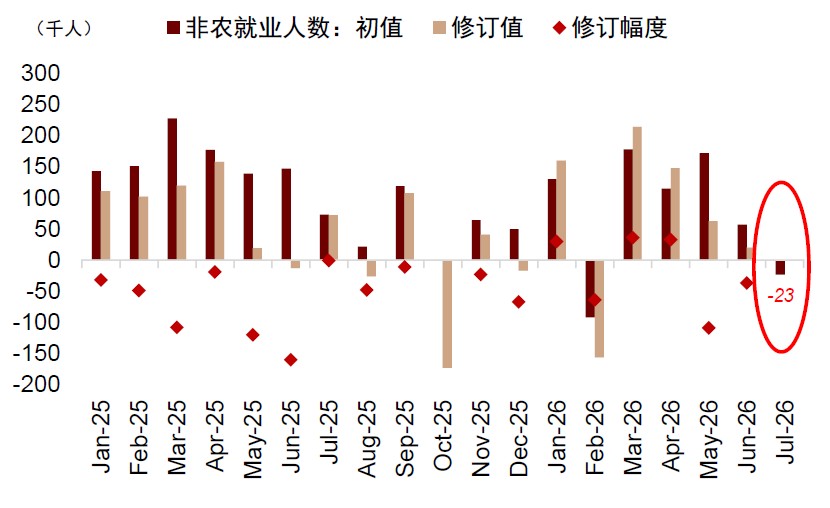
In the July asset allocation monthly report "Is the K-shaped divergence beginning to converge?", China International Capital Corporation judged that improvements in U.S. credit and PMI do not indicate a comprehensive economic recovery. The rebound in employment data from April to June reflects more data quality issues and a one-time impact from the World Cup. If the Federal Reserve raises rates, it could lead to economic downside risks. In July, U.S. non-farm payrolls decreased by 23,000, with the previous value significantly revised down, which was far below expectations, confirming earlier predictions.
Chart 9: U.S. non-farm employment added in July turned negative, previous value adjusted down
Data source: Haver, China International Capital Corporation Research Department
- The Federal Reserve has tolerated inflation above target for five years. Since it maintained patience in keeping interest rates unchanged at the June FOMC meeting, there is no need to suddenly lose patience just one month later and feel compelled to raise rates in July to control inflation Due to the preliminary validation of the viewpoint, China International Capital Corporation (CICC) is more confident in its prediction of a looser liquidity environment in the second half of the year:
From a geopolitical perspective, the game between the U.S. and Iran is not "asymmetric." As the U.S. midterm elections approach, Trump's TACO tendency may significantly strengthen, and the cooling of the U.S.-Iran situation is an inevitable trend;
In terms of inflation, the sub-models indicate that key components such as core goods and housing will continue to weaken, and U.S. inflation is expected to improve in the coming months. At the same time, the growth rate of personal consumption in the U.S. is still declining, and there are signs of cooling in the labor market, suggesting that future growth may slow down cyclically. The simultaneous weakening of inflation and employment may open up space for the Federal Reserve to ease.
On the policy front, Waller's public statements appear hawkish, but the real intention behind his downplaying of the dot plot, proposing new inflation indicators, and incorporating AI into the policy response function may be to provide new policy grounds for earlier interest rate cuts.
As the triple risks of geopolitics, inflation, and policy gradually diminish, global liquidity is expected to become more accommodative in the second half of the year.
Asset Insights: Technology growth remains the main theme of the market, optimistic about the U.S. and Chinese stock markets; overweight gold, non-ferrous metals, and other liquidity-sensitive assets.
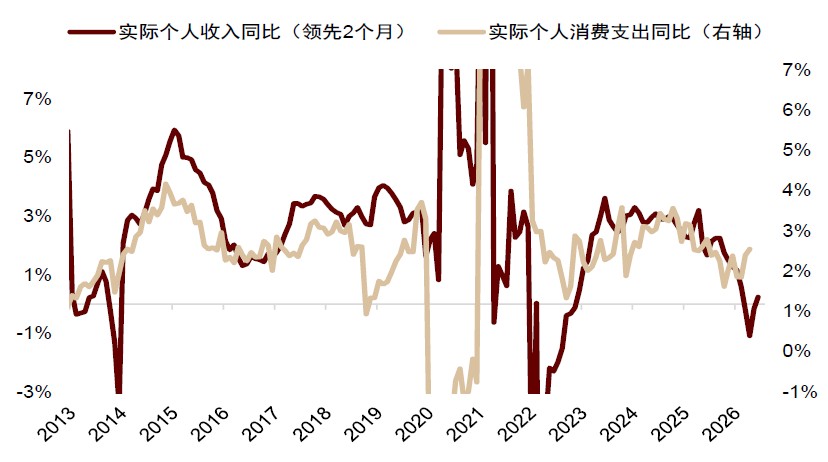
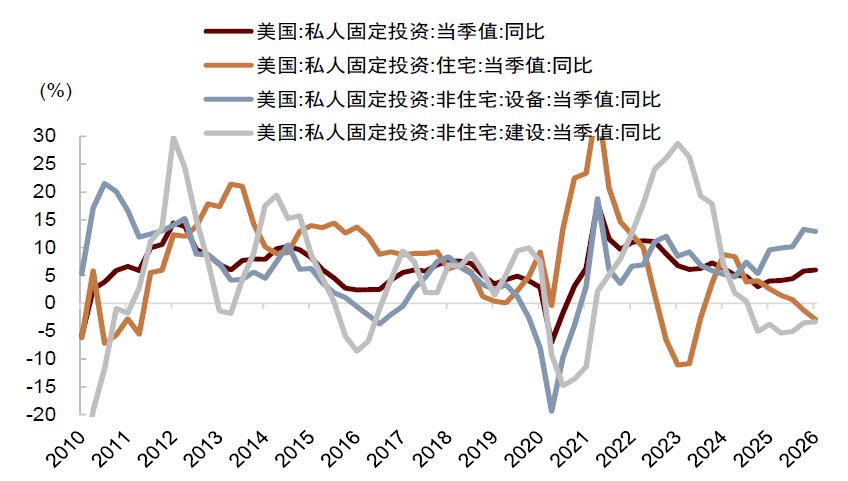
Global liquidity continues to ease, benefiting the technology growth sector, gold, and non-ferrous metals. Currently, the non-AI sector in the U.S. has not fully recovered, with employment, consumption, and residential investment all slowing down, and there is insufficient evidence of K-shaped convergence.
Chart 10: Leading indicators show that the growth rate of U.S. real consumer spending may continue to decline
Source: Haver, CICC Research Department
Chart 11: The growth rate of U.S. residential investment is still declining
Source: Haver, CICC Research Department
At the same time, the fundamentals of technology growth continue to materialize: in the second quarter, Microsoft's Azure revenue grew by 43% year-on-year, AWS revenue grew by 37% year-on-year, and major technology companies are maintaining or increasing their AI capital expenditures, with demand for computing power, cloud business growth, and AI commercialization mutually validating each other.
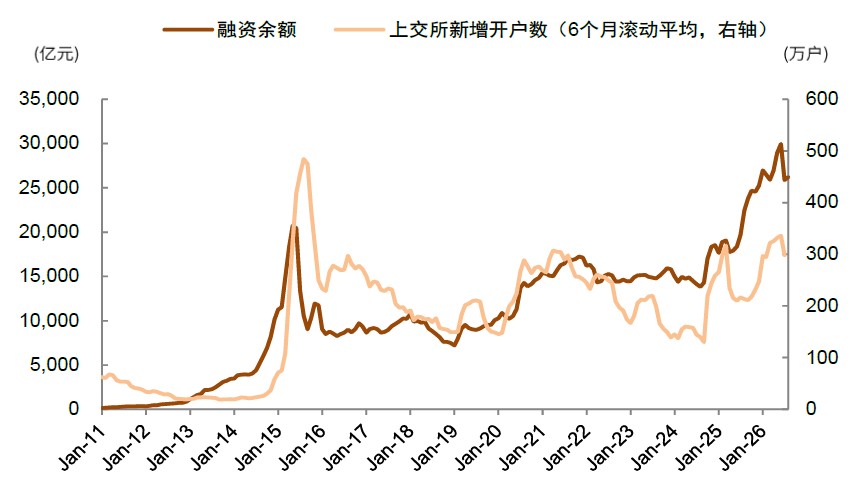
On the funding side, the recent adjustment in the global AI sector has already digested some of the high crowding and high valuation risks, and the risk-reward ratio for technology growth has improved: the proportion of A-share TMT trading volume has fallen from a historical high of 52% to 42%, and the financing balance has decreased by 387.6 billion yuan from the peak at the end of June, while the scale of leveraged ETFs in South Korea has also significantly declined. As fundamentals continue to materialize, combined with a decrease in crowding, the risk-reward ratio for technology growth has improved.
Chart 12: The A-share financing balance has significantly declined from the peak at the end of June
 Source: Wind, CICC Research Department
The recent rise in traditional sectors may not be sustainable, and evidence for style rotation is still insufficient. CICC remains firmly bullish on the AI and technology growth theme. Driven by the tech market, both the US and Chinese stock markets may perform well in the second half of the year. CICC recommends overweighting A-shares and Hong Kong stocks, while maintaining a benchmark allocation to US stocks.
Regarding gold, CICC advised reducing positions when valuations and crowding were high at the beginning of the year, and suggested increasing allocations when the market was extremely pessimistic about gold in June. CICC believes that the two narratives that previously suppressed gold are being falsified:
First, global liquidity has not truly entered a tightening cycle. As US inflation falls and growth slows, the economic fundamentals support a shift towards looser monetary policy. The "hawkish dove" stance of the Fed may open up space for future interest rate cuts.
Second, "de-dollarization" has not ended. The "balance sheet reduction" policy has objectively helped restore the credibility of the dollar, but this policy is subject to multiple constraints from financial markets and politics, leading to high uncertainty about its future implementation. Meanwhile, the structural erosion of dollar credit due to high debt, high deficits, and policy uncertainty may be difficult to reverse. Global central banks' net gold purchases rebounded to 289 tons in the second quarter, a year-on-year increase of 62%, setting a historical high for the second quarter, reflecting deep-rooted concerns about the dollar among global central banks. Reserve diversification will continue to support gold demand in the medium to long term. As global liquidity becomes more accommodative, the upward pressure on real interest rates and the dollar will ease, allowing gold to regain dual support from liquidity and diversification of the monetary system. CICC believes that the gold bull market has not ended, and the window for re-allocating after previous adjustments has opened, recommending continued overweighting of gold.
For US Treasuries, falling inflation, cooling employment, and expectations of a more accommodative Fed policy are favorable for lower interest rates, with high coupon rates providing a safety cushion. If US growth slows further, medium to long-term US Treasuries can hedge against equity asset volatility, and it is recommended to maintain a benchmark allocation to US Treasuries and increase positions on dips. Improved liquidity also supports Chinese bonds, but considering the low interest rate level, the return potential is limited, so a slight underweight in Chinese bonds is advised.
CICC believes that commodities may continue to differentiate internally. The demand for copper and aluminum is supported by AI data centers, grid expansion, and energy transition. Against a backdrop of strong supply constraints, non-ferrous metals combine the dual logic of improved liquidity and physical investment in AI, and an overweight position is recommended. Energy commodities like oil still have hedging value, but future volatility may increase, so it is advised to maintain positions without chasing highs.
July US CPI Preview: Month-on-month remains low, year-on-year continues to decline
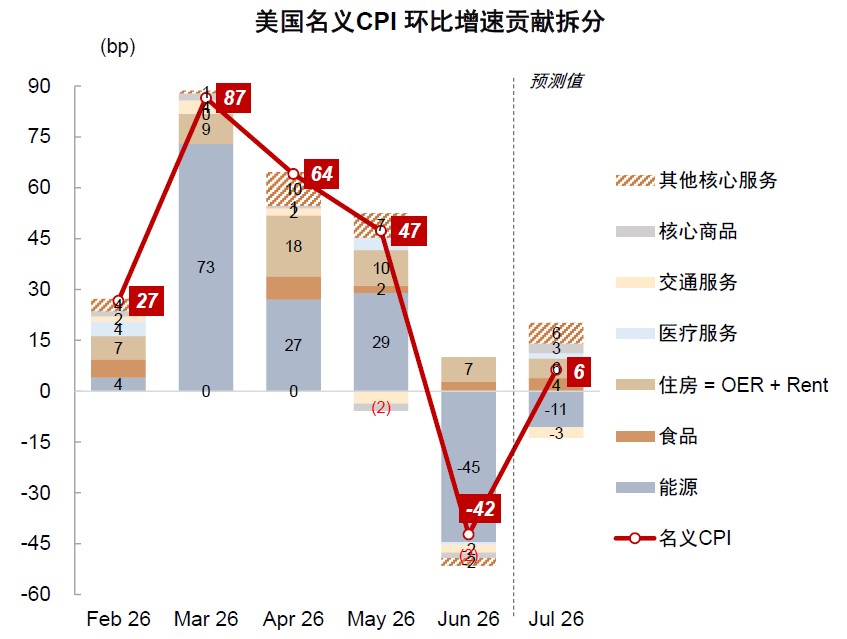
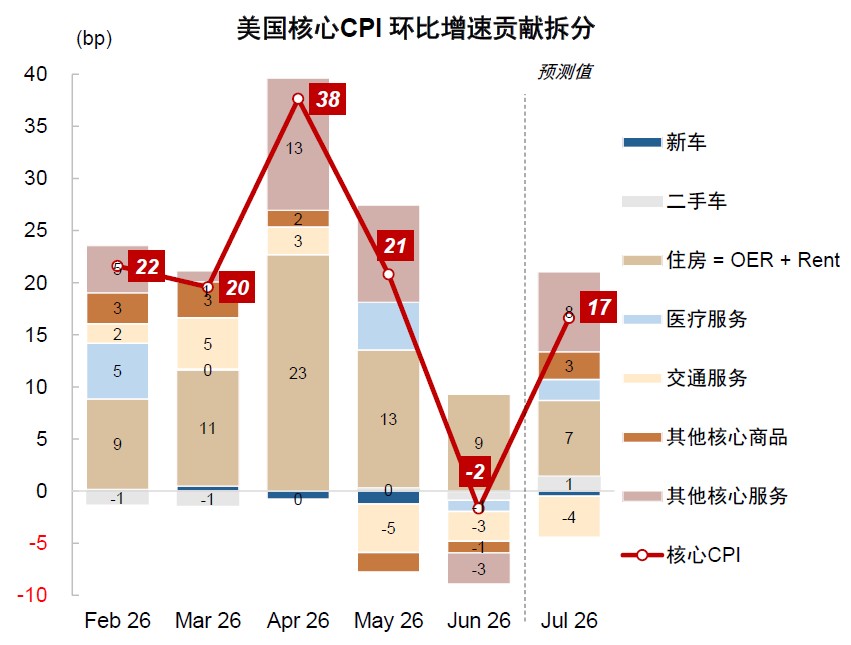
The US July CPI will be announced on August 12 (Wednesday). CICC's macro asset team expects the nominal CPI in July to rise by about 0.1% month-on-month (previous value -0.42%, consensus expectation 0.1%), and to decline to 3.4% year-on-year; the core CPI is expected to rise by 0.2% month-on-month (previous value -0.02%, consensus expectation 0.2%), and to decline to 2.5% year-on-year.
Chart 13: Breakdown and Forecast of Contributions to US Nominal CPI Month-on-Month
 Data Source: Haver, China International Capital Corporation Research Department
Chart 14: Contribution Breakdown and Forecast of U.S. Core CPI Month-on-Month
Data Source: Haver, China International Capital Corporation Research Department
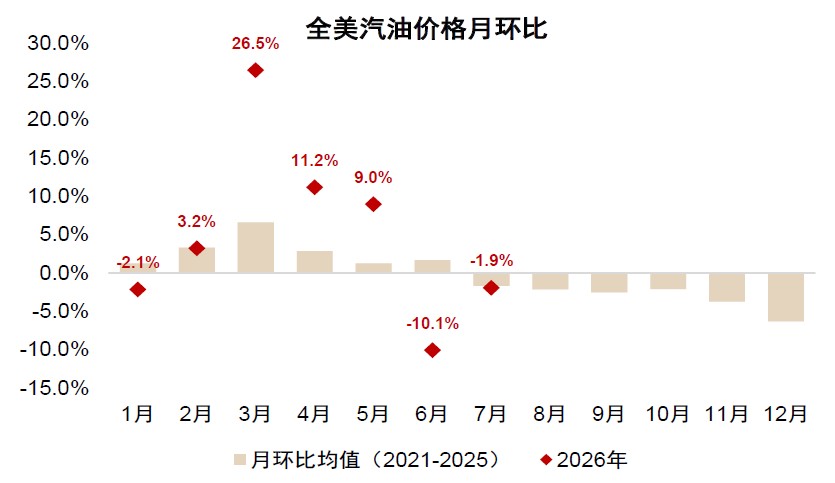
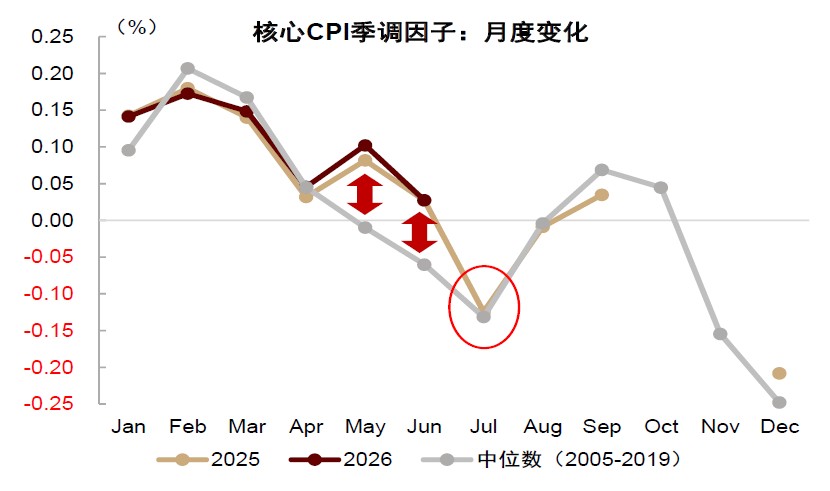
In June, the significant seasonal drop in gasoline prices, the unusual decline in some service prices, and the seasonal adjustment factors collectively suppressed inflation readings, leading to a negative month-on-month nominal CPI and a rare zero growth in core CPI. In July, as the month-on-month decline in oil prices narrowed, the suppressive effect of seasonal adjustment factors weakened, and core service prices reverted to the mean, the fading of these unusual factors may drive the month-on-month U.S. inflation to rise compared to previous values, but it will still remain at a low level.
Chart 15: Narrowing Decline in U.S. Gasoline Prices in July
Data Source: Bloomberg, China International Capital Corporation Research Department
Chart 16: Seasonal Adjustment Factors in May-June Were Relatively High Compared to Pre-Pandemic Levels, Lowering Seasonally Adjusted Inflation Readings; July Seasonal Adjustment Factors Returned to Long-Term Levels Before the Pandemic
Data Source: Wind, China International Capital Corporation Research Department
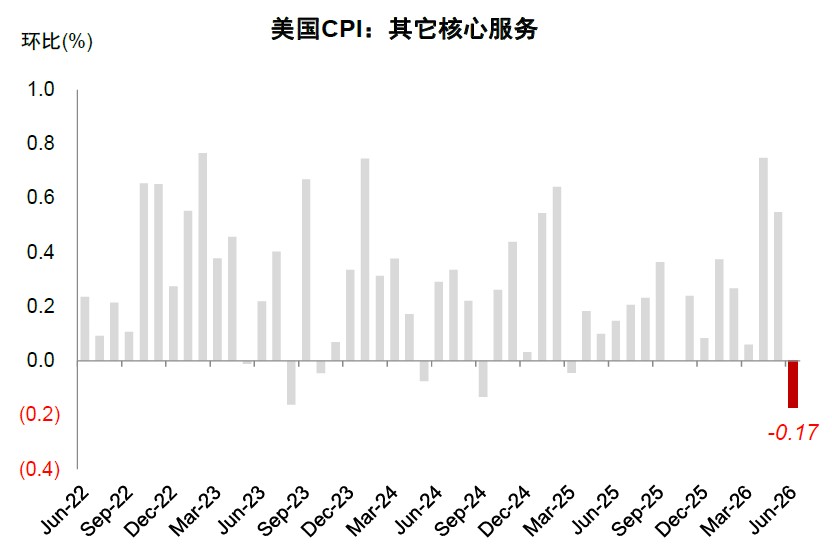
Chart 17: Other Core Service Inflation Turned Negative Month-on-Month in June, May Revert to Mean in the Future
Data Source: Haver, China International Capital Corporation Research Department
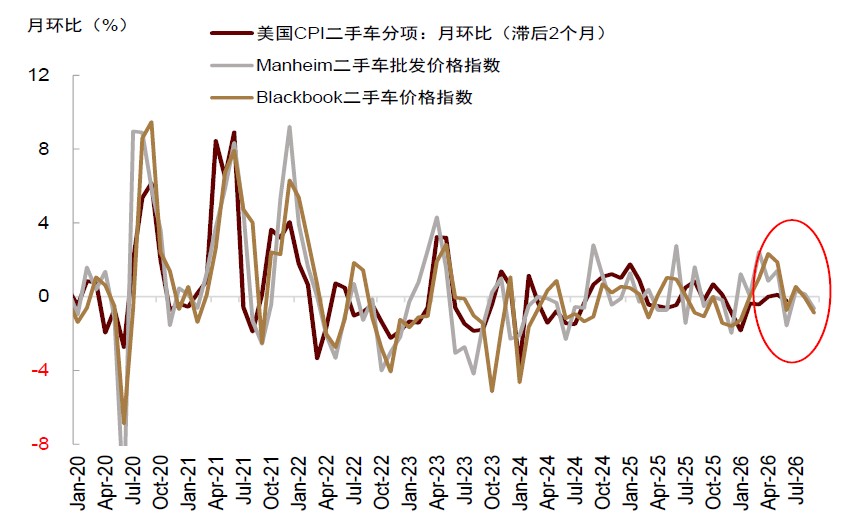
In terms of components, (1) high-frequency data indicates that the CPI for used cars in July may shift from a previous decline to slight positive growth, potentially boosting core goods inflation in July; (2) other core service inflation, excluding rent, transportation services, and medical services, may revert to the mean after a month-on-month decline of 0.17% in June, becoming the main source of the month-on-month rebound in core CPI.
Chart 18: Wholesale Prices Lead U.S. Used Car CPI by About 2 Months
 Source: Manheim, Haver, CICC Research Department
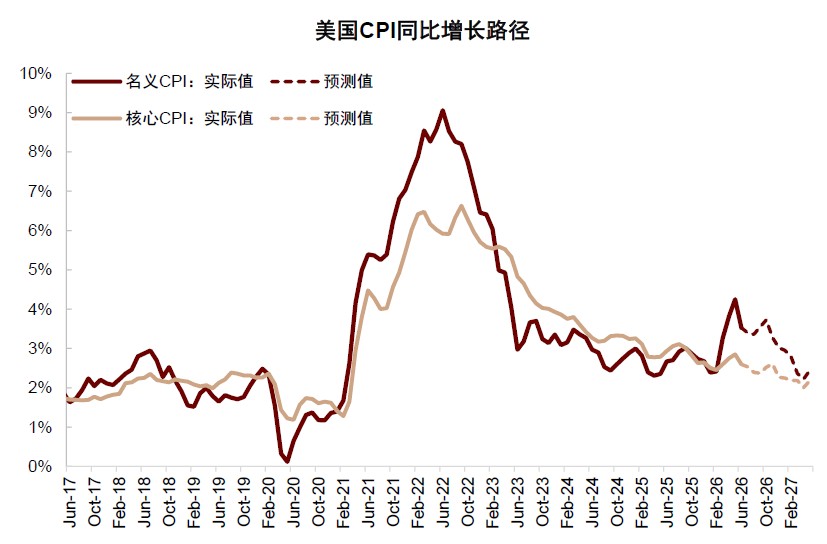
In the coming months, under the baseline scenario of no new significant supply shocks, core commodities, rents, and other key components of inflation may remain low. Even if the year-on-year readings may experience a slight rebound due to base effects after October, the overall trend of cooling inflation in the United States remains a prevailing direction.
Chart 19: Component model predicts that the peak of U.S. inflation has passed, and it will trend downward in the future
Source: Haver, CICC Research Department
Some viewpoints are concerned that recent price increases in certain electronic products will change the downward trend of inflation. However, CICC's calculations show that the weight of the "computers, peripherals, and smart home assistants" component in the U.S. CPI is only 0.3%. In an extreme scenario, even if the entire component's price rises by 20%, the maximum impact on CPI would only be about 0.06 percentage points, which is unlikely to change the overall downward trend of inflation.
If the July CPI forecast is realized as expected, U.S. inflation year-on-year will significantly decline for the second consecutive month. Coupled with a cooling job market, the Federal Reserve's tightening narrative may further reverse, and stocks, bonds, and gold are expected to continue benefiting from the return of easing trades