
Galaxy: 50-Week Moving Average - Market Focus After Bitcoin Rebound
 I'm LongbridgeAI, I can summarize articles.
Galaxy analyzes Bitcoin's moving averages, identifying the 200-week MA as a long-term 'bottom support level' and the 50-week MA as a bear market resistance ceiling. Historical data shows the 200-week MA is rarely breached significantly, with the 2022-2023 period being an outlier. Conversely, the 50-week MA typically caps rallies during downturns; regaining this level often signals the end of a bear market or confirms existing bottoms.
2021-2022: On June 19, 2022, the weekly closing price first fell below this moving average, but rebounded six weeks later; subsequently, from August 2022 to March 2023, it traded below the moving average for 30 consecutive weeks. The low point on November 9, 2022, was 34.2% lower than the moving average; during this round of market movement, a total of 47 weekly and 322 daily closing prices fell below the moving average. Even in this round, this moving average still holds significant reference value: in June and August/October 2023, the market twice tested below the moving average, with a maximum pullback of 6.7%, and both times recovered the moving average before attempting to reach new historical highs. Summary: Since 2014, out of 642 weekly charts, only 56 weekly closing prices have fallen below the 200-week moving average; of these, 36 occurred between August 2022 and March 2023. Excluding this period, over the past 12 years, only 20 weekly charts have briefly fallen below the 200-week moving average, with a maximum deviation of no more than 6.7%. Based on the historical performance of the 200-week moving average as a long-term support level, this report refers to it as a "bottom support level": this does not mean that this price level will never be broken, but rather that, except for one special market condition, all other breaks have been brief and minor.
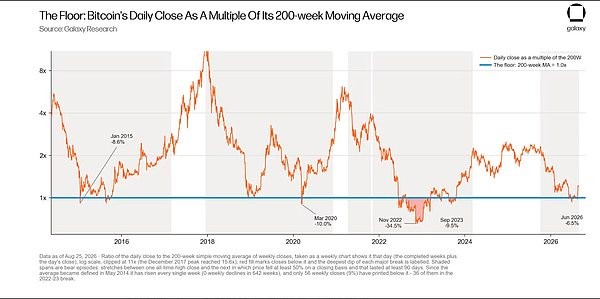
Chart 2: Daily closing prices displayed as multiples of the 200-week moving average since its inception in May 2014 (calculated daily using a simulated weekly chart). The 1.0 line represents the bottom support level; the red filled area marks the time period when the price ran below this line and marks the largest decline lows. The break below in 2022 and 2023 was the only sustained breach.
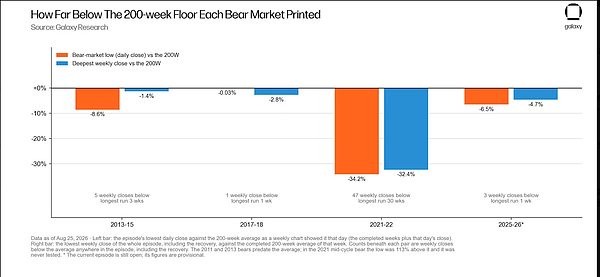
Chart 3: The extent to which the lows of each bear market were broken relative to the bottom support level (left bar), compared with the maximum decline in weekly closing prices during the entire market cycle (right bar), and the number of weekly closing prices below the moving average was also counted. The 2018 bear market low was only 0.03% lower than the moving average; 2022 was an outlier, with a breakdown of 34.2%.
... The 50-week moving average acts as a resistance ceiling in bear markets. Historically, the 50-week moving average has played the opposite role to the 200-week moving average. In the early stages of a bear market pullback, prices often fall below this moving average. In the five completed bear markets that have seen prices fall below the 50-week moving average, the first time the weekly closing price closed below it occurred in the 536th week after the historical high. From that week until the week before the bear market low, the 50-week moving average consistently acted as resistance. These five bear markets totaled 106 weeks, during which the weekly closing price only rose above the 50-week moving average three times, all occurring in the 2021-2022 bear market, specifically the two brief upward spikes in December 2021 and March 2022. Multiple rebounds have approached this moving average but failed to achieve a valid breakout: In 2018, the first rebound after breaking below the moving average stopped 0.6% below the 50-week moving average; the rebound in July 2018 was still 1.9% below the 50-week moving average; even the strongest rebound in 2014 was 6.6% below the 50-week moving average. The 2013 bear market was an exception: prices plummeted from $231 to $66.34, but its bear market low was still 45% above the 50-week moving average. However, prices regaining the 50-week moving average is a strong indicator of the end of a bear market. In the six bear markets that have ended, the weekly chart has regained the 50-week moving average a total of 13 times. These breakouts can be divided into three categories: The first category consists of 5 instances, representing the first time a price has broken through the bottom of a bear market (January 8, 2012; October 25, 2015; May 5, 2019; July 25, 2021; March 19, 2023). Following these breakouts, no lower price lows were reached. The second category consists of 6 instances, representing repeated breakouts during a rebound and recovery phase. The bear market bottom had already been confirmed by a previous signal of recovering the 50-week moving average (the price had risen 133% to 204% from the established bear market low). The third type saw two upward breakouts, occurring before the bear market bottom was established, but ultimately failed to hold above the moving average (December 26, 2021, and March 27, 2022, respectively 48 days and 139 days from the historical high in November 2021, when prices were only 25% and 31% lower than the historical high). Both breaks above the moving average lasted only one to two weeks. Overall, in the five bear markets that broke below the 50-week moving average, in four of them, the first time the weekly chart closed above the moving average again was a valid signal. The final valid break above the moving average in each round lasted between 21,139 weeks; after the bear market bottomed out and the 50-week moving average was recovered for the first time, the market needed 86,575 days to regain the previous historical high.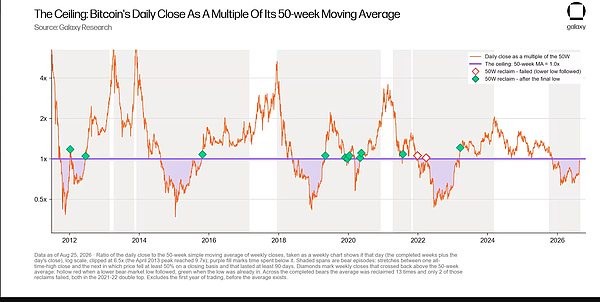
Chart 4: Daily closing prices since June 2011, displayed as multiples of the 50-week moving average. Shaded areas represent different bear market phases; purple fill marks periods when prices were below the moving average; diamond symbols mark the points when the weekly price crossed the moving average again upwards—a green diamond indicates that the bear market bottom has been established, and a hollow red diamond indicates that a new low was subsequently reached.
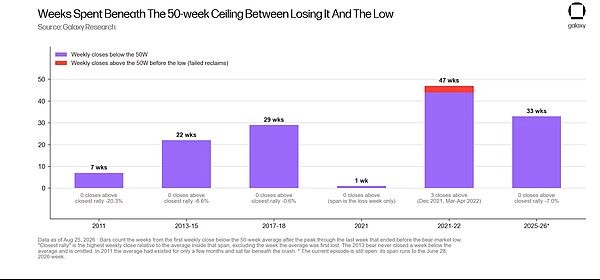
Chart 5: The number of weeks the price traded below the resistance level after breaking below it until the bear market low, and the number of weekly closing prices that broke through the resistance level within that range. This has happened only 3 times in the 106 weeks that the bear market has ended; it has happened 0 times in the current 33-week bear market.
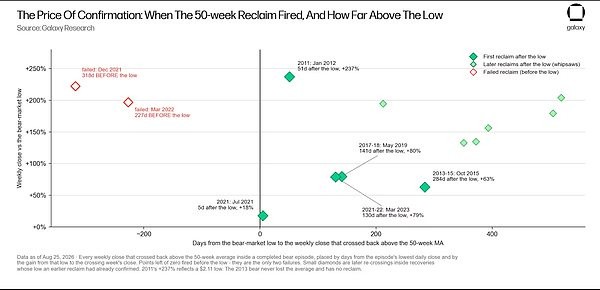
Chart 6: The Cost of Confirmation Signals: In a bear market that has ended, every time the weekly closing price reclaims the 50-week moving average, statistics are compiled based on the number of days since the bear market low and the increase from the low to that closing price. The first recovery after the bottom occurred 5,284 days after the low; the only two failed breakouts both occurred before the bear market bottomed out, in the 2021-2022 bear markets. The charts for the three major bear markets (2013-2015, 2017-2018, and 2021-2022) show that both moving averages played a role. In 2014-2015 (see Chart 7 below), the price slowly broke below the 50-week moving average in the 36th week after the peak. For the next 22 weeks, this moving average suppressed every rebound, while the 200-week moving average rose, approaching the low of January 2015. In October 2015, the price recovered above the 50-week moving average, 284 days after the low, and this sustained hold above it lasted for 135 weeks. In 2018 (Chart 8), prices broke below the resistance moving average in May; the subsequent two rebounds were only 1.9% away from the moving average at their highest points, both encountering resistance until the market fell back to the bottom support level in December; in May 2019, the price recovered the moving average, confirming the bottom of the bear market; in March 2020, there was only one brief dip below the bottom support level on the weekly chart, which was recovered the following week. In 2021 and 2022 (Chart 9), the market broke below the resistance moving average five weeks after peaking; in the following months, there were two false breakouts upwards (a total of three weekly closes above the moving average), and the moving average continued to exert downward pressure during the remaining downtrend; the bottom support failed in June 2022, lasting for six weeks, followed by a brief three-week recovery, before being broken again for 30 consecutive weeks. In March 2023, the price recovered the moving average, 130 days from the low point, and maintained this level for 139 weeks.
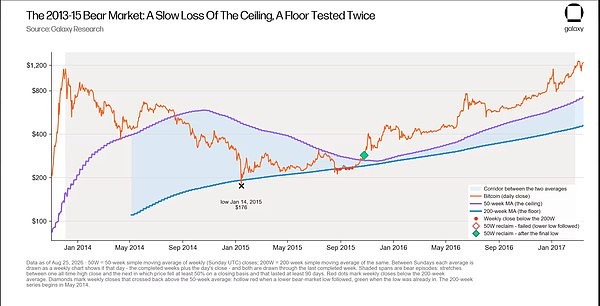
Chart 7: The 2013-2015 Bear Market. In August 2014, prices fell below the 50-week moving average, which then suppressed every rebound for the next 22 weeks. In January 2015, the low was 8.6% lower than the 200-week moving average, but the weekly closing price closed above it. During the pullback in August and September 2015, there were five weeks where the weekly closing price briefly broke below the support level, with the largest drop being 1.4%. After recovering the moving average in October 2015, this sustained hold above the average lasted for 135 weeks.
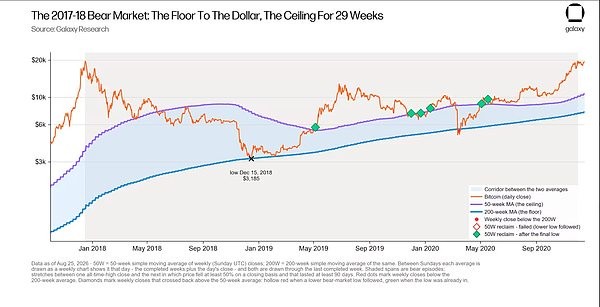
Chart 8: The 2017-2018 Bear Market and its Recovery. In May 2018, the price broke below the resistance moving average, and two rebounds were suppressed when they were only 0.6% and 1.9% away from the moving average, respectively; the closing price of the low point in December 2018 was $3185.07, and the 200-week moving average value on that day was $3185.93. The sharp drop in March 2020 marked the only time in this cycle that the weekly closing price broke below the bottom support level; the two recoveries in May 2019 and May 2020 defined a period of intense fluctuation around this support level.
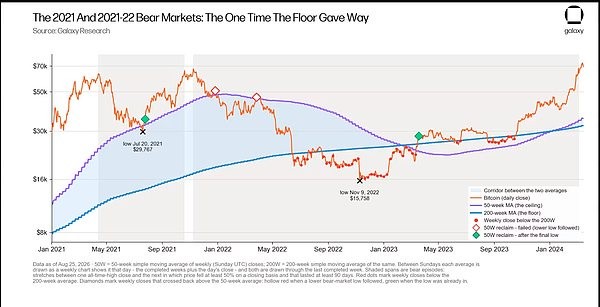
Chart 9: The bear market in the 2021 cycle and the 2021-2022 bear market. The only two instances of failed recovery signals (marked with hollow red bars) occurred in the initial months after the peak in November 2021; the bottom support level was broken for 30 consecutive weeks starting in August 2022; the moving average was recovered in March 2023, 130 days from the low, and held effectively for 139 weeks. Several dips below the support level in 2023 were all retracement tests initiated from above. During a bear market, resistance moving averages tend to decline (lower prices pull down the moving average values), while support moving averages continue to rise (the 200-week moving average never falls back). Therefore, as bear market retracements lengthen, the channel between the two moving averages narrows (see Chart 10 below). In the weeks following the lows of 2015, 2018, and 2021, the 50-week moving average was 2.48, 2.4, and 2.31 times the 200-week moving average, respectively. However, in the week following the low in November 2022, this ratio was only 1.31. Subsequently, the resistance moving average even fell below the support moving average for 47 consecutive weeks (from the week of February 19, 2023 to January 7, 2024, when the ratio fell to a low of 0.84). This is the only time on record that the two moving averages have inverted. In the week following the low on June 30th of this year, the 50-week/200-week moving average ratio was 1.41; except for the inverted ratio in November 2022, this value is lower than the ratio at all other bear market lows. The ratio subsequently narrowed further to 1.27. The narrowing of the channel at the bear market low is mainly due to two reasons: 1) the price did not significantly deviate from the long-term trend during the bull market; 2) the prolonged bear market significantly dragged down the 50-week moving average. 2022 falls into the second category, exhibiting the narrowest moving average channel among all bear market lows in history after a 77% retracement. The unique aspect of this bear market lies in its starting point. At the all-time high on October 6, 2025, the 50-week moving average was 1.88 times the 200-week moving average, and the price was 2.3 times the 200-week moving average. For comparison: the ratios for the December 2017 high were 2.9 and 15.6; for April 2021, they were 2.1 and 5.5; and for November 2021, they were 2.6 and 3.9. Compared to previous bull markets, the current bull market has deviated from its long-term trend by a much smaller margin, thus limiting the potential for further declines in the bear market. The current 53.1% retracement is only slightly higher than the 2021 bear market cycle (53.11% compared to 53.08% in 2021). These two retracements are the smallest among the seven market cycles analyzed in this report (of course, the current retracement percentage is a temporary figure and is subject to change).
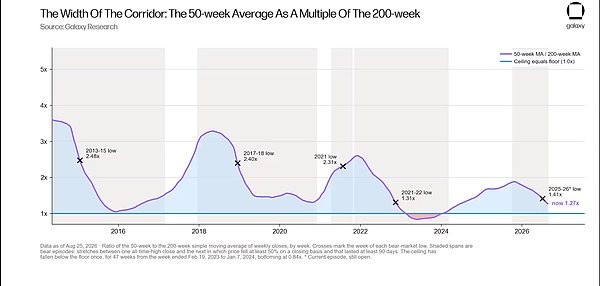
Chart 10: Weekly statistics, the multiple of the 50-week moving average relative to the 200-week moving average, and the low points of each bear market. The moving average channel multiples at the lows of 2015, 2018, and 2021 were 2.31 to 2.48 times, the low of 2022 was 1.31 times, and the low of June this year was 1.41 times; the moving averages inverted once, from February 2023 to January 2024. The current market performance is similar to that of the 2015 and 2018 bear markets in terms of bottom support levels; and its performance at resistance levels, except for one exception, is consistent with all other bear markets (see Chart 11 below). In the week of November 16, 2025, the fifth week after the all-time high in October, BTCUSD fell 25% from its all-time high, breaking below its 50-week moving average on the weekly chart. From November 2025, when it broke below the moving average, to the bear market low in June, a total of 33 weeks passed, during which no week's closing price closed above the 50-week moving average. There were five rallies that came within 14% of the moving average, but all were met with resistance and stalled. A rally on January 18th brought it only 7% away from the 50-week moving average. As of August 27th, the date of this writing, BTCUSD was trading at approximately $80,000, only 2.2% away from its 50-week moving average of $81,800. Last week (August 23, 2026) closed at $77,593, a 23.5% increase for the week, just 5% below the 50-week moving average of $81,796. This is the closest the weekly closing price has been to this resistance level since it was broken in November 2025. Meanwhile, the 50-week moving average has been converging on the price over the past two months, declining by an average of approximately $987 per week. (The moving average window currently moving out covers the weekly closing prices in the range of $108,707 to $123,524 from September to November 2025). If this week, which closes on Sunday, August 30, 2026, closes above $81,100, it will be the first time the weekly chart has closed above the 50-week moving average since the week of November 9, 2025.
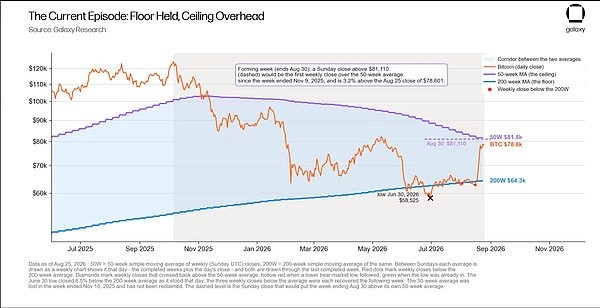
Chart 11: This round of market movement. The low point on June 30 held the bottom support level; for the past 41 weeks, the resistance moving average has suppressed all weekly closing prices. Last week's closing price was at $81,796, and the weekly closing price was 5.1% lower than that. The dashed price level of $81,110 represents the critical price at which the closing price on Sunday, August 30, could allow this week to rise above the 50-week moving average. Historically, a weekly chart breakout above the 50-week moving average is a very strong signal of the end of a bear market and the start of a bull market, but this conclusion is not unconditionally true. In the 13 instances where the weekly chart regained its position above the 50-week moving average after a bear market ended, only two of these breakouts resulted in new lows. In the five bear markets that broke below this moving average, four of the initial upward breakouts were valid signals (correctly confirming that the bear market bottom had been established). The five successful recoveries occurred 103,690 days after the previous all-time high, when the price had fallen 45% to 76% from that high. If the weekly close on August 30th completes this recovery at $81,110, it will have been 328 days since the all-time high. In this bear market, the bottom support level has remained intact; if the weekly closing price rises above the 50-week moving average resistance level, it could be a strong signal that the bear market has bottomed out.