
 I'm LongbridgeAI, I can summarize articles.
VNET Group Inc (VNET) stock fell 7.71% on Aug 31, underperforming its sector due to persistent negative momentum from Q2 results. Despite revenue beating estimates, a widened net loss and margin compression from rising depreciation costs triggered selling pressure. Institutional investors remain cautious regarding high leverage, aggressive capital expenditure guidance, and refinancing risks. Technically, the stock broke below key moving averages, triggering automated selling.
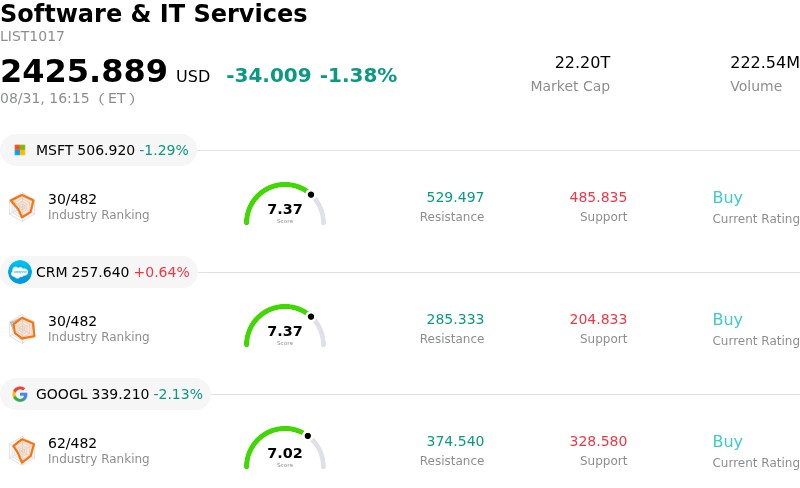
VNET Group Inc (VNET) closed down by 7.71%. The Software & IT Services sector is down by 1.38%. The company underperformed the industry. Top 3 stocks by turnover in the sector: Microsoft Corp (MSFT) down 1.29%; Salesforce Inc (CRM) up 0.64%; Alphabet Inc Class A (GOOGL) down 2.13%.
What is driving VNET Group Inc (VNET)’s stock price down today?
VNET Group experienced strong selling pressure as persistent negative momentum following its second-quarter financial results continued to weigh on market sentiment. Although the carrier-neutral data center operator delivered top-line revenue that exceeded consensus expectations, its net loss expanded significantly, resulting in an earnings-per-share miss against Wall Street estimates. The financial results highlighted margin compression driven by rising depreciation costs associated with rapid data center capacity expansion, alongside fair value losses on financial instruments, overshadowing solid growth in its wholesale internet data center segment.
Institutional investors remain cautious regarding VNET’s balance sheet leverage and aggressive capital commitments. The company’s heavy capital expenditure guidance coincides with high debt ratios and a negative working capital position. The substantial funding needed to construct gigawatt-scale infrastructure has intensified market concerns over potential refinancing risks, elevated interest expenses, and prospective return on invested capital, prompting institutional investors and risk-averse funds to trim exposure.
From a structural perspective, the recent weakness pushed the equity below key technical support levels, including its 50-day and 200-day moving averages, reaching new multi-month lows. This technical breakdown triggered automated trend-following selling and distribution by momentum traders. Combined with mixed analyst sentiment and ongoing profitability challenges, the technical deteriorating pattern and high leverage overhang continue to drive short-term downside pressure.
Technical Analysis of VNET Group Inc (VNET)
Technically, VNET Group Inc (VNET) shows a MACD (12,26,9) value of -0.113, indicating a sell signal. The RSI at 35.705 suggests neutral condition and the Williams %R at 98.711 suggests oversold condition. Please monitor closely.
Fundamental Analysis of VNET Group Inc (VNET)
VNET Group Inc (VNET) is in the Software & IT Services industry. Its latest annual revenue is $1.44B, ranking 153 in the industry. The net profit is $-37.24M, ranking 477 in the industry. Company Profile
Over the past month, multiple analysts have rated the company as Buy, with an average price target of $14.18, a high of $25.04, and a low of $11.00.
More details about VNET Group Inc (VNET)
Company Specific Risks:
- Widening Net Losses and Gross Margin Contraction: VNET reported a Q2 net loss attributable to the company of RMB 135.6 million ($20.0 million), widening substantially from RMB 11.9 million in the prior-year period, alongside a gross margin drop to 18.2% from 22.5% due to rising depreciation expenses from rapid infrastructure expansion.
- Elevated Capex Burden and Cash Flow Strain: Management reiterated a heavy full-year 2026 capital expenditure target of RMB 10 billion to RMB 12 billion without upgrading full-year revenue outlook, intensifying analyst concerns over persistent negative free cash flow and delayed monetization of capital outlay.
- High Balance Sheet Leverage and Debt Refinancing Risk: With a net debt-to-annualized adjusted EBITDA ratio of 4.6x, negative working capital, and approximately RMB 5 billion in debt obligations maturing in 2027, the company faces growing solvency concerns and debt-servicing risks in a elevated cost environment.
- Execution and Customer Ramp-Up Delays: Slower-than-expected customer move-in timelines following capacity expansions and strategic transactions (such as the CATL partnership) have created near-term revenue friction, leaving large-scale wholesale buildouts underutilized relative to upfront investment costs.
Find out more