
 I'm LongbridgeAI, I can summarize articles.
SanDisk (SNDK) stock rebounded 5.5% on August 31, driven by strong fundamentals including rising NAND prices and AI demand, with Q3 revenue up 51% to $8.965 billion. Technical analysis indicates a forming head-and-shoulders bottom pattern, suggesting medium-term stabilization. Analysts predict the stock could return to $2,000 if it breaks resistance at $1,952, while support lies at $1,400.
TradingKey - As of August 31, Eastern Time, SanDisk (SNDK) stock rebounded strongly, closing up 5.5% for the day and reaching an intraday high of $1,572.69, with a trading volume of approximately 23.38 million shares, significantly higher than recent average levels. However, compared with the high of $2,354.39 reached earlier this year, SanDisk is still down about 33% from its peak, with the stock currently in a consolidation and recovery phase following the previous sharp rally.
SanDisk's fundamentals remain supported by rising NAND prices and AI data center demand. The company's latest quarterly revenue reached $8.965 billion, up 51% quarter-over-quarter, with data center revenue reaching $2.977 billion, up 103% quarter-over-quarter; full-year revenue for fiscal year 2026 grew 175% year-over-year. The company also further expanded its share repurchase program and expects next quarter's revenue to reach $10.3 billion to $10.8 billion.
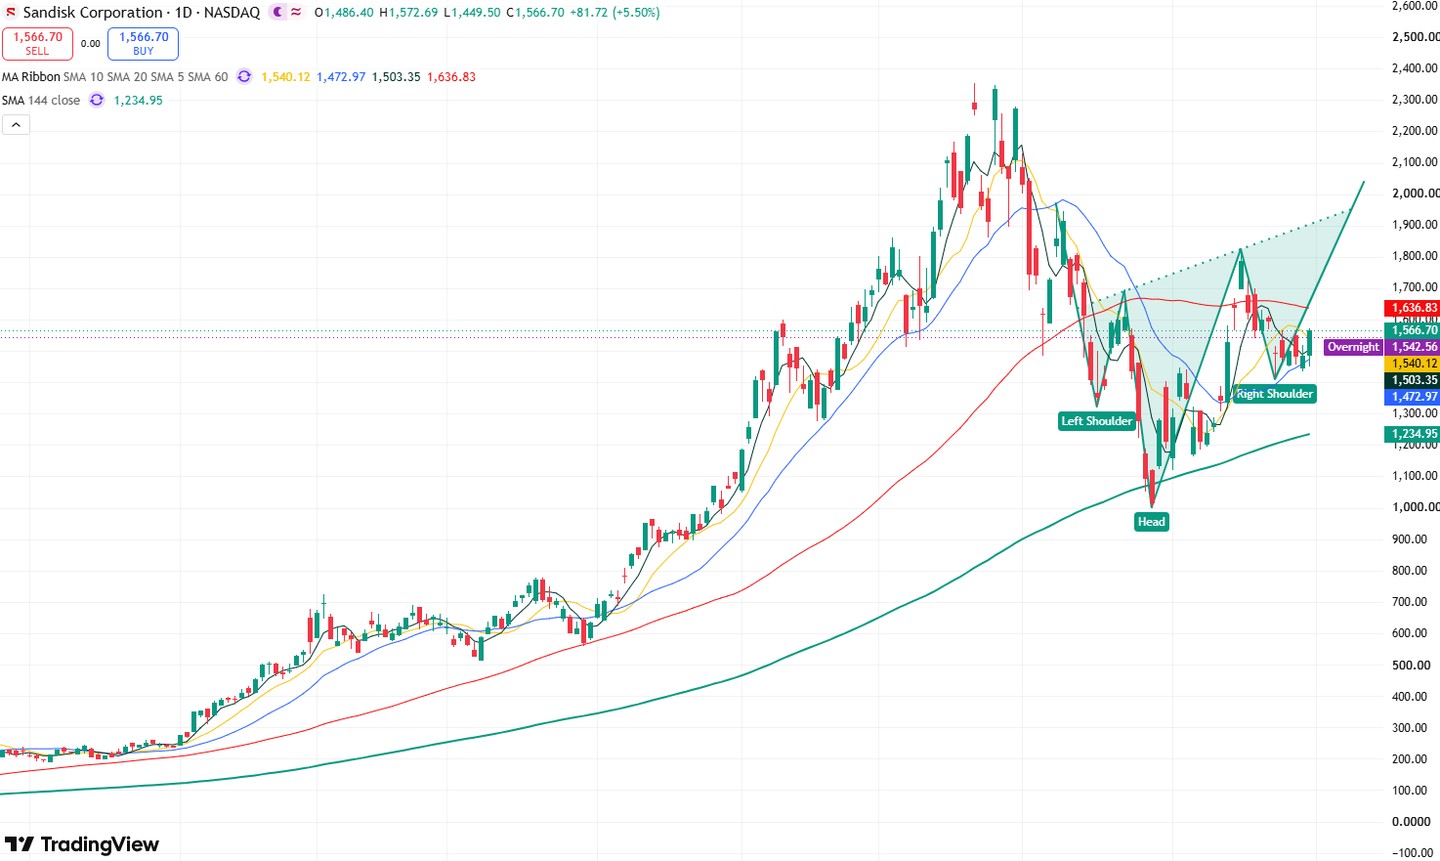
SanDisk stock daily chart, Source: TradingView
Looking at the daily chart of SanDisk's stock price, SanDisk experienced a sharp pullback after surging above $2,300 earlier this year, but the stock gradually stabilized after bottoming near $1,000 and is currently forming a clear head-and-shoulders bottom pattern. The left shoulder is located near $1,300, the head low is close to $1,000, and the right shoulder is forming near $1,400, indicating that the medium-term bottoming structure is improving.
Currently, as the head-and-shoulders bottom pattern takes shape, market bullish momentum has strengthened significantly. The primary upside target for the stock will be testing the rebound high of $1,952.59 set on July 9. If it breaks through this level, the stock will further challenge the $2,000 mark and may even test the historical high of $2,354.39.
On the downside, the primary initial support level to watch is $1,400. If this level fails to hold, the stock may test the $1,300 mark, and if it continues to fall, the stock could drop back toward $1,000.
Find out more