
 I'm LongbridgeAI, I can summarize articles.
In the last two pieces, Dolphin Research outlined the technical logic and roadmap behind the 'memory power' trade. This note shifts back to the company lens, focusing on the flagship of this cycle’s HBM rally — $SK Hynix.US.
SK hynix sits in a delicate spot: DRAM pricing is surging and HBM stays tight, lifting earnings, with the stock up ~10x within half a year at one point. Yet Samsung and Micron are rapidly qualifying into Nvidia and other core customers’ supply chains, moving hynix’s edge from 'exclusive' to merely 'lead'.
As a manufacturer, results boil down to 'price and volume': price is set by industry supply vs. demand, and volume in tight cycles largely follows installed capacity. Customer mix and LTA coverage define pricing power and visibility. We discuss three questions:
1) Will the supply–demand gaps in DRAM (DDR and HBM) widen or narrow, and what does that imply for price?
2) Which major customers are most tightly tied to hynix, can new LTAs smooth the cycle, and what flexibility vs. risk does hynix’s LTA strategy entail?
3) How much can hynix’s capacity and earnings grow, and is the current valuation reasonable?
Below is the main text:
I. Decisive factor — DRAM industry supply–demand outlook
Even in the AI era, memory tech content has risen but same-generation performance gaps across vendors remain limited, with standardized specs and broadly homogeneous products. As a result, memory makers do not set price; they take price set by supply–demand.
Since sales volume is largely capacity-bound and relatively stable, most revenue and margin elasticity comes from price. Therefore, supply–demand for DRAM is the single most important driver of results and share prices.
1.1 Industry demand: nearly all incremental demand from servers
We split total DRAM demand into three buckets: a) conventional end-products, e.g., PCs, smartphones, automotive, TV; b) DDR used in general-purpose servers; c) DDR+HBM for AI servers.
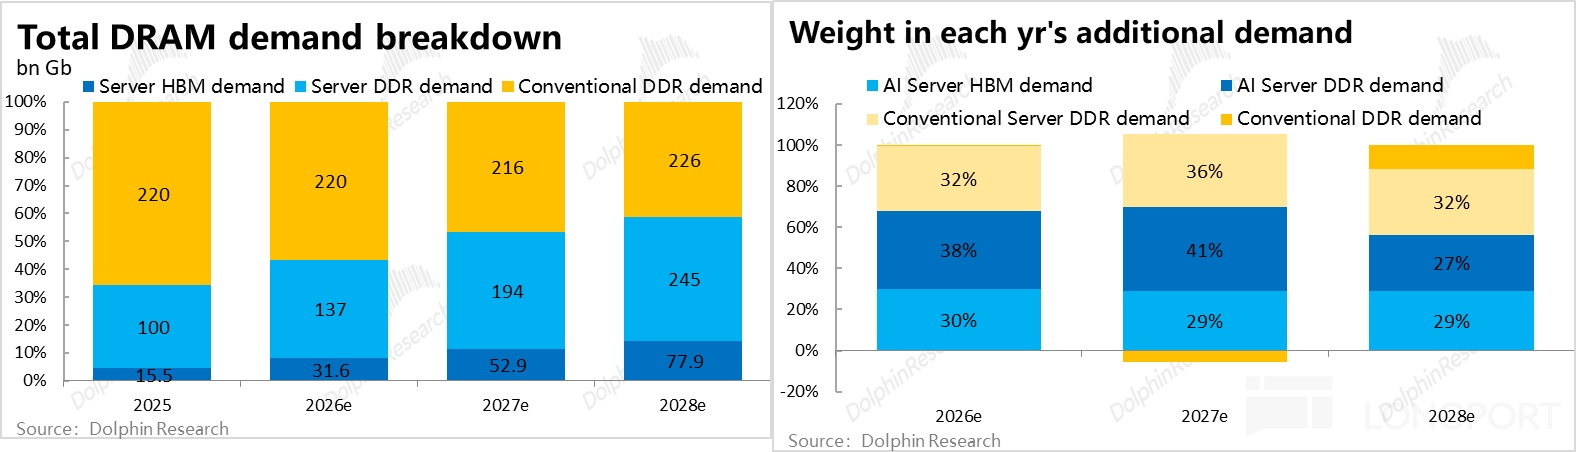
Bottom line: industry DRAM demand (incl. HBM, excl. inventory swings) rises from ~336 bn Gb in 2025 to ~549 bn Gb in 2028, ~18% CAGR. General-purpose servers, AI server DDR and HBM each contribute roughly one-third of the incremental demand, while conventional products contribute ~3%. Server (incl. AI) share of total demand climbs from ~34% to ~59%.
a. Conventional end-demand: price squeeze, but capacity per device is sticky
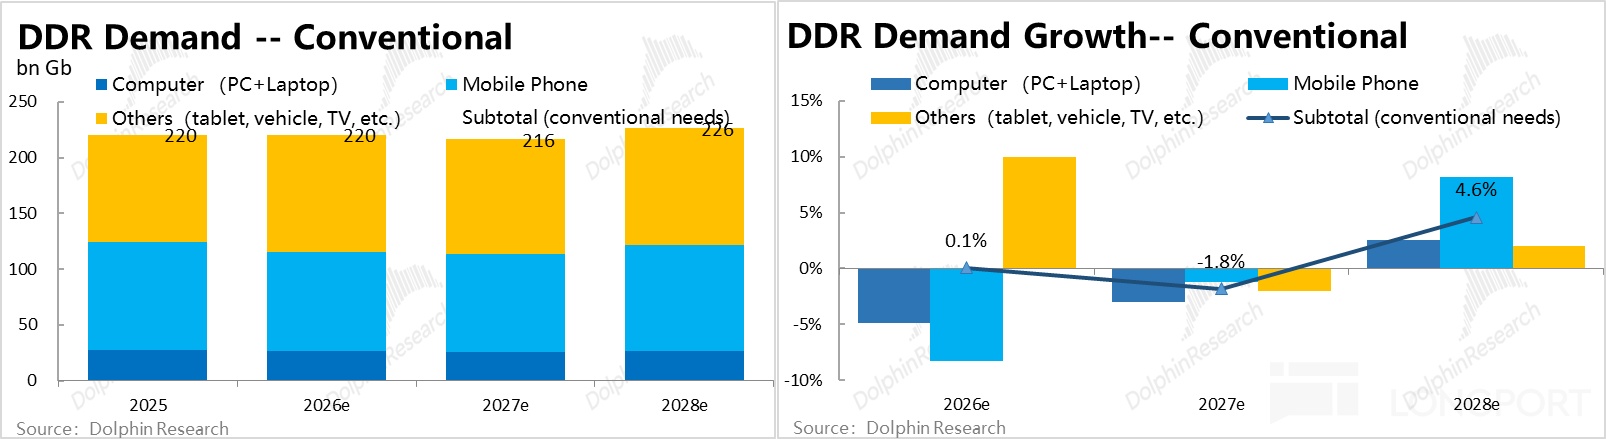
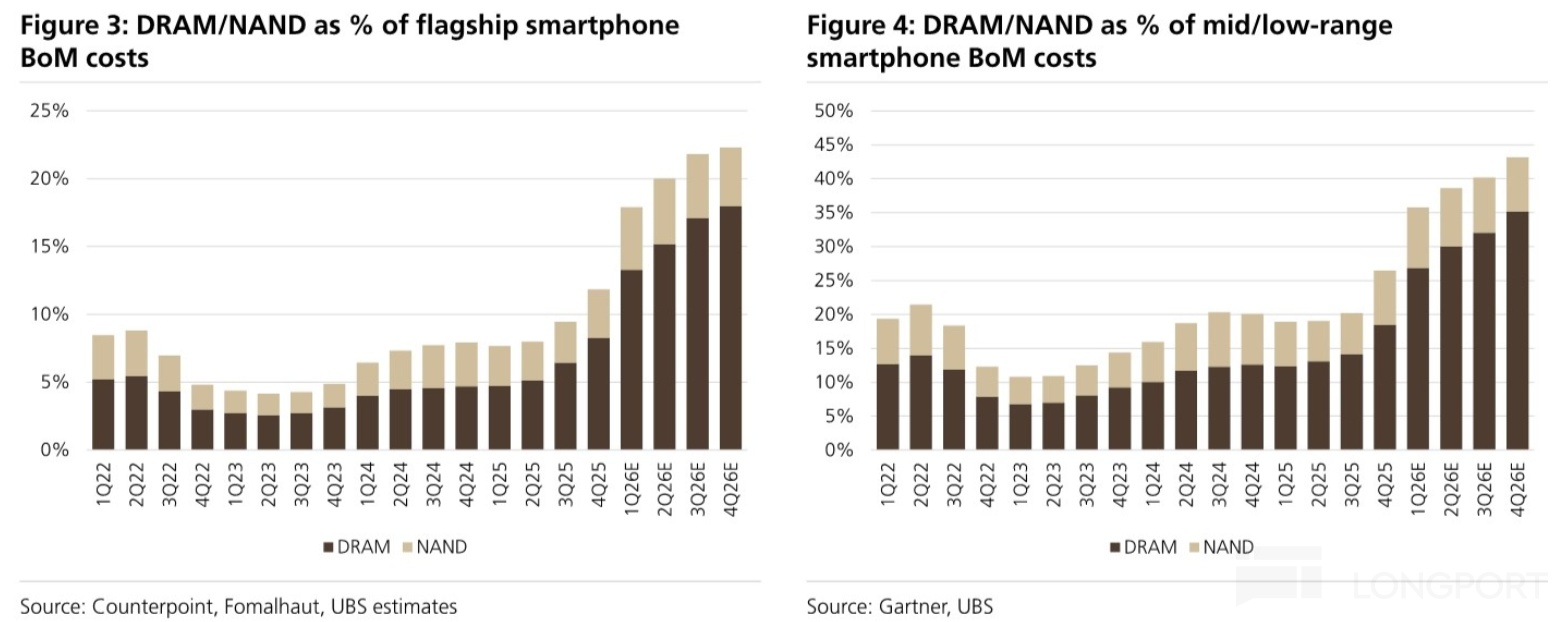
For PCs, phones, tablets, autos, TVs and others, conventional DRAM demand in 2026–28 stays roughly flat (~216–226 bn Gb), with share dropping from ~66% to ~41%. The key driver is higher DRAM prices suppressing shipments (e.g., memory now accounts for a doubled share of smartphone BOM costs).
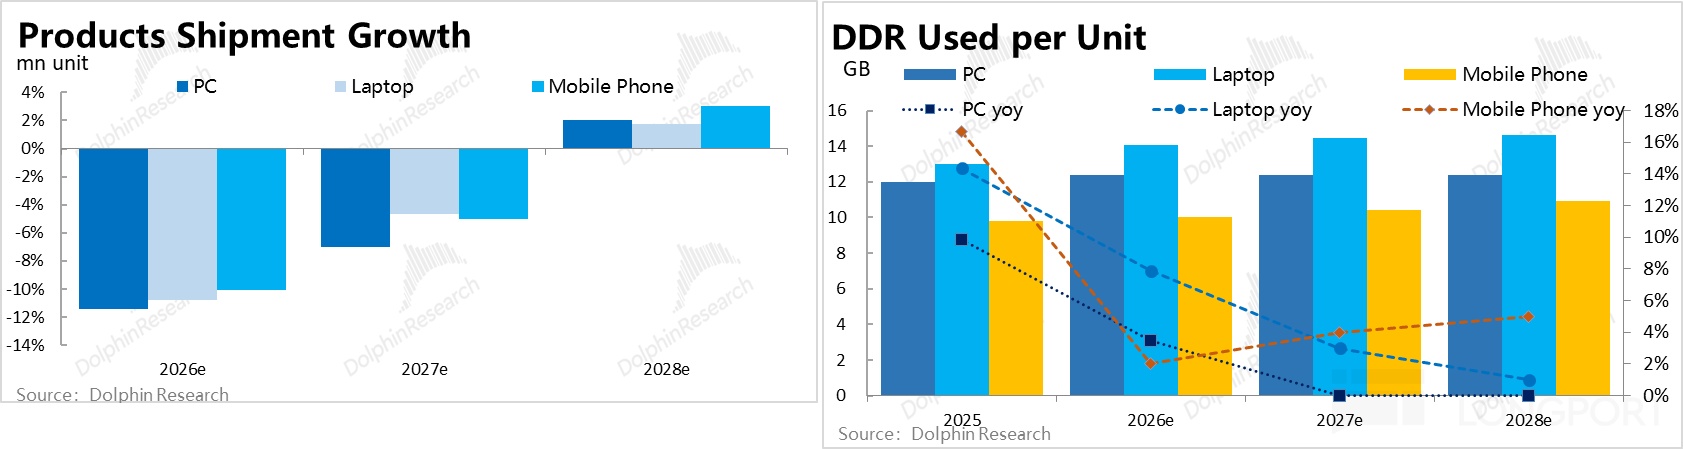
Consensus sees PC and handset shipments down ~10% in 2026, then down another ~5–7% in 2027. We think per-device memory capacity is relatively non-discretionary and unlikely to be cut, to preserve user experience.
Overall, conventional DRAM is the 'buffer' in memory demand: squeezed demand is mostly deferred and will re-emerge as prices ease, providing a floor in a down cycle.
Risks go both ways: sustained price hikes could deepen the squeeze; on the other hand, if on-device AI scales, per-device memory could step up notably, adding demand.
b. General-purpose servers: overlooked incremental driver, doubles in three years
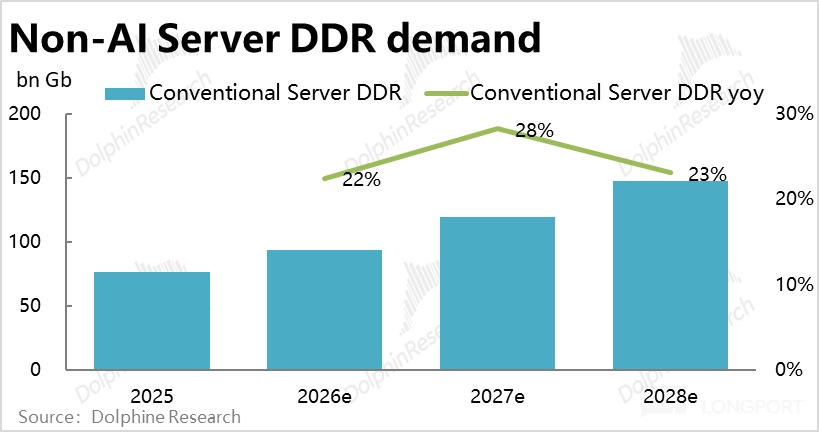
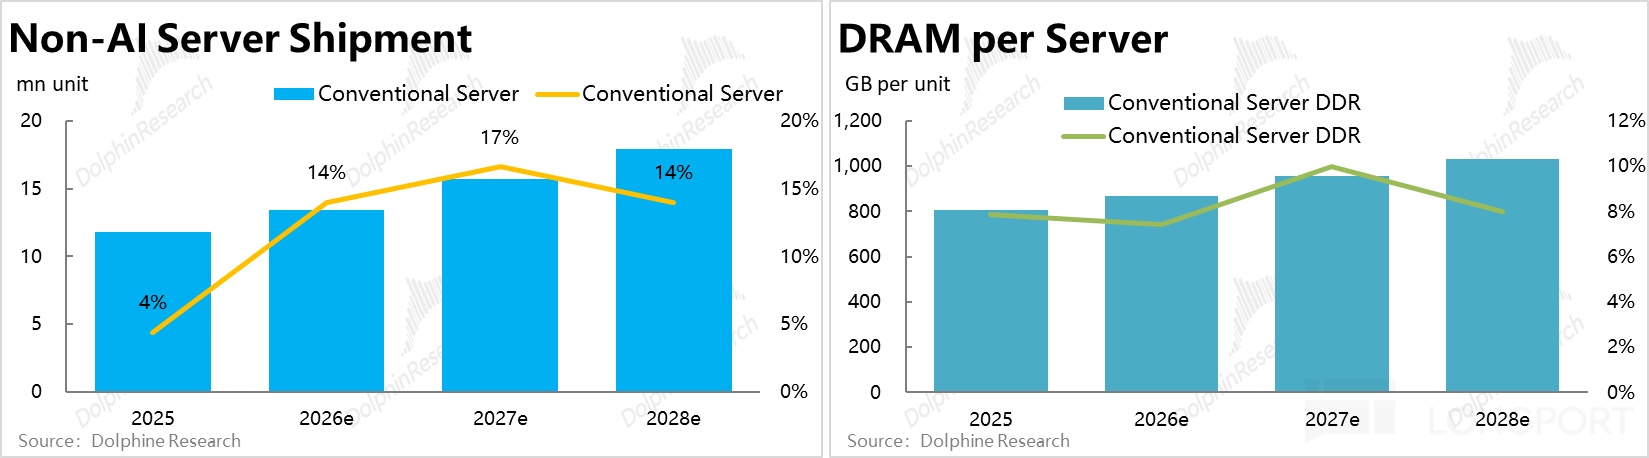
General-purpose servers are CPU-centric and use conventional DDR, and were the main shipment base pre-AI. We estimate their DDR demand rises from ~76 bn Gb to ~148 bn Gb in three years, ~25% CAGR — an often overlooked but material source of incremental demand.
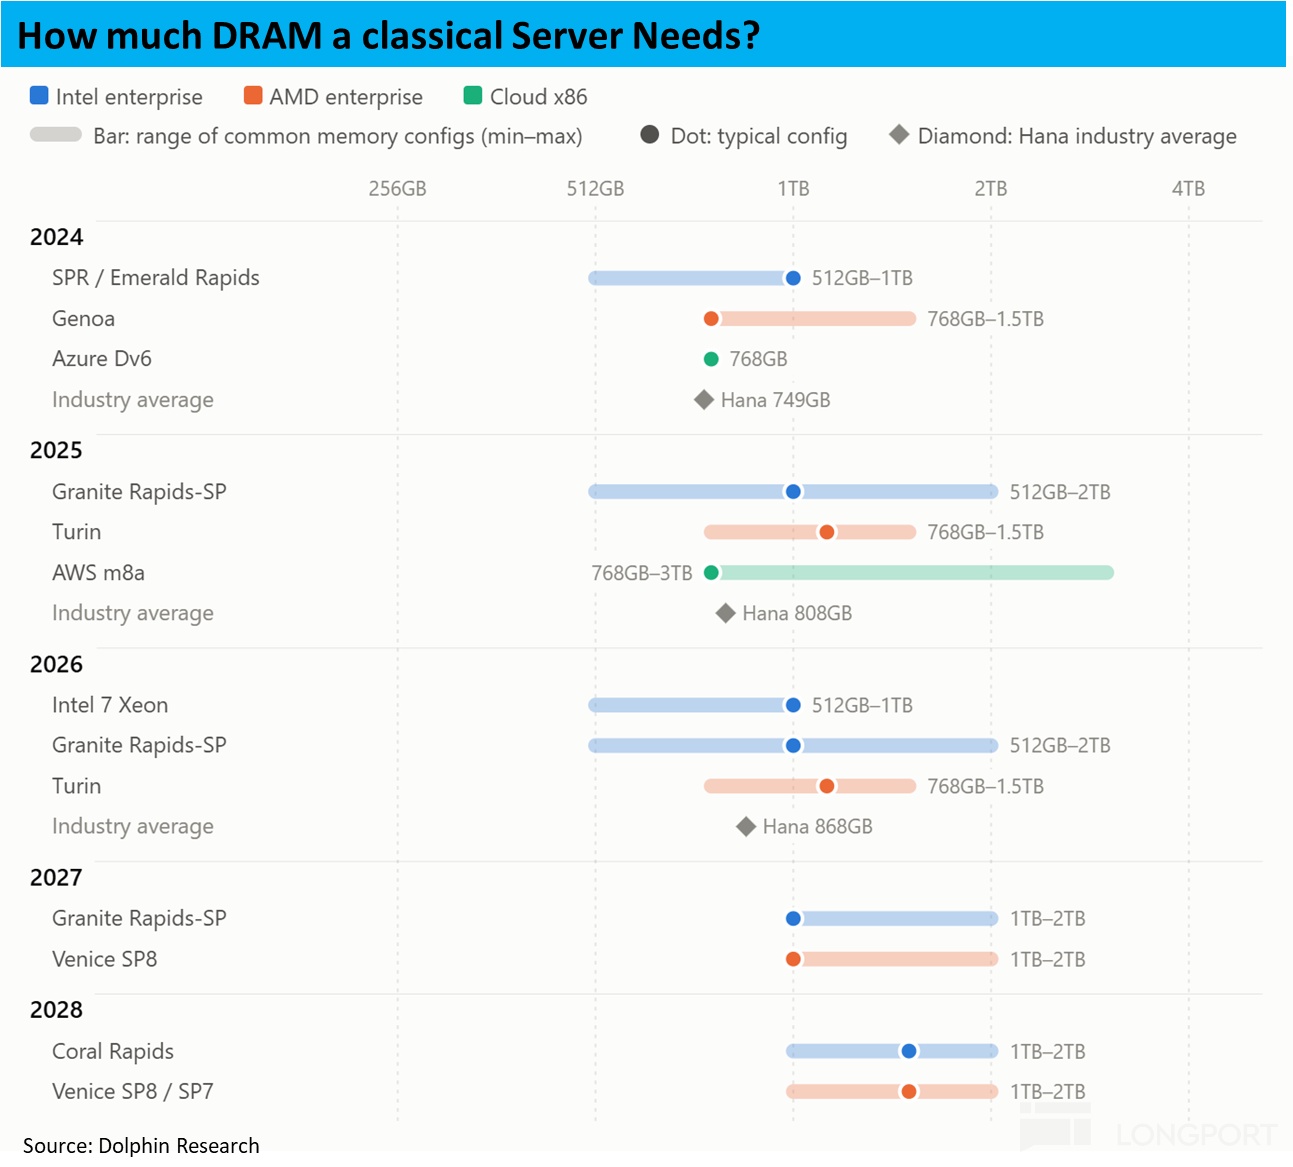
Drivers are price and volume. On volume, servers bought during the pandemic are entering refresh, and Agent-driven general compute needs lift shipments to ~15% growth in 2026–28. On price, industry expects DDR per box to rise ~7–10% p.a. from ~800 GB to >1 TB in 2025–28.
Historical server configs support this: per-box DRAM climbs from several hundred GB in 2024–25 to a 1 TB baseline in 2027–28.
c. AI servers: the biggest swing factor
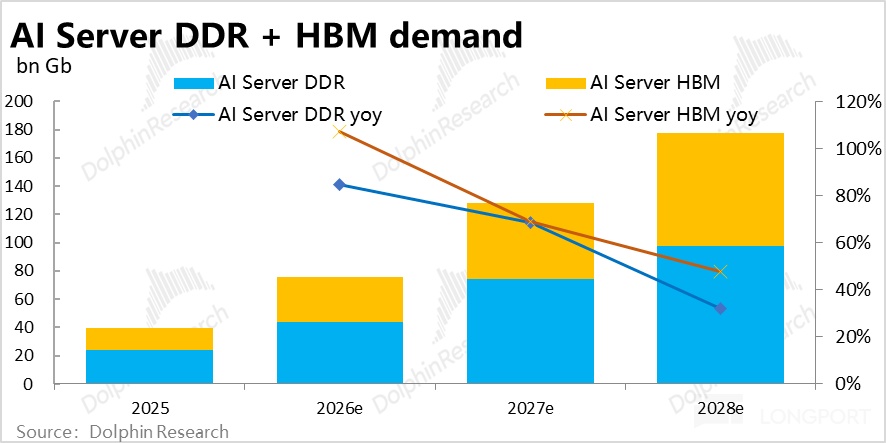
AI servers are the largest incremental driver, with total DRAM (HBM+DDR) rising from ~39 bn Gb in 2025 to ~176 bn Gb in 2028, contributing nearly two-thirds of total demand growth (ex-inventory).
Specifically, HBM rises from ~15.5 bn Gb to ~78 bn Gb, 71% CAGR in 2026–28. AI server DDR increases from ~24 bn Gb to ~98 bn Gb, with incremental increases from DDR and HBM broadly similar in magnitude.
① Shipments: almost triple in three years, ASIC becomes the main driver.
(Note: shipment lens here is XPU units, previously we used system units.)
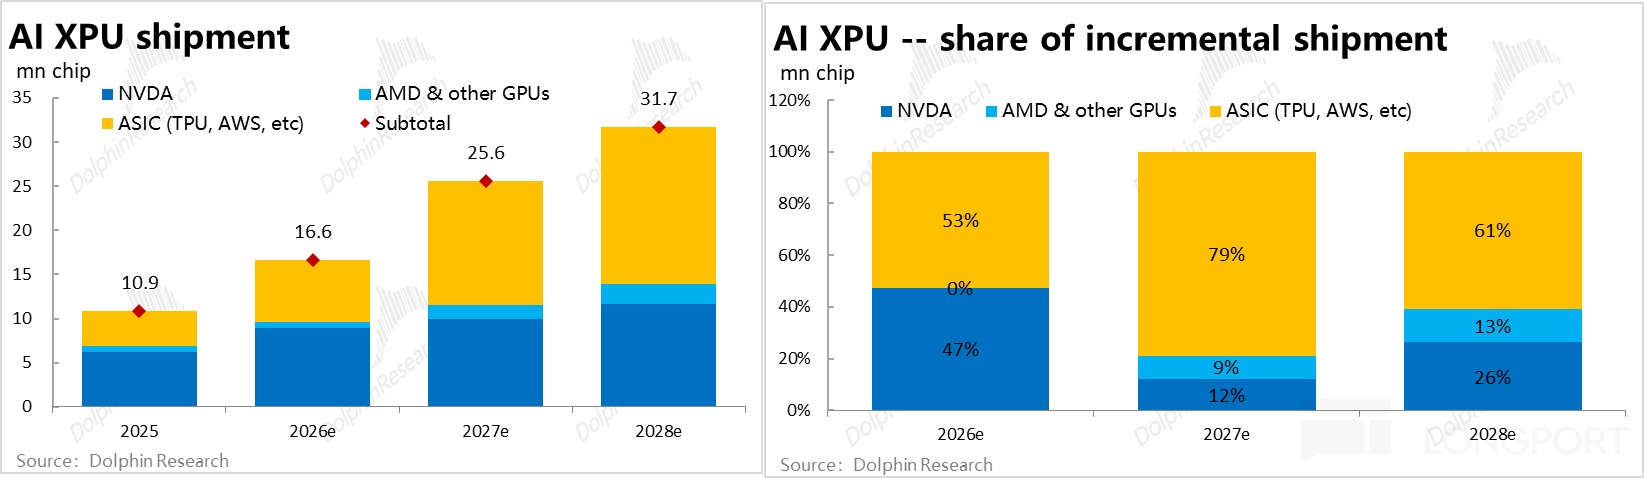
Constrained by TSMC CoWoS, we estimate global AI accelerators rise from ~10.9 mn units in 2025 to ~31.7 mn in 2028, ~43% CAGR. Nvidia grows relatively steadily, while ASIC accelerators rise from ~4.0 mn to ~17.8 mn units, surpassing Nvidia from 2027, becoming the key growth engine.
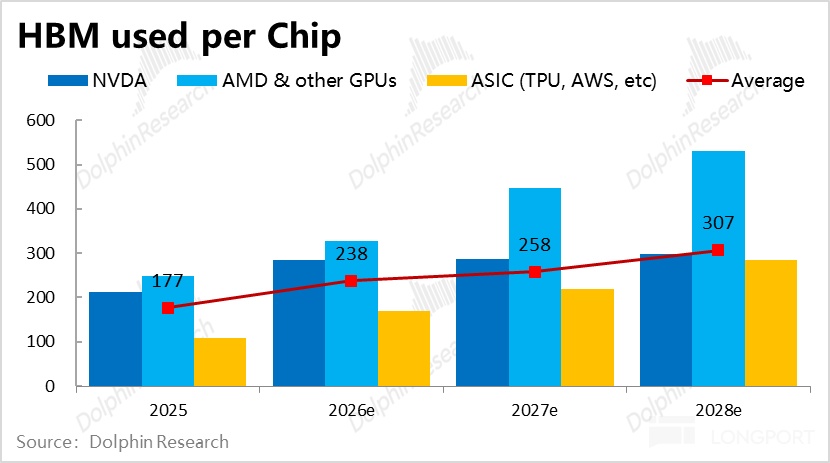
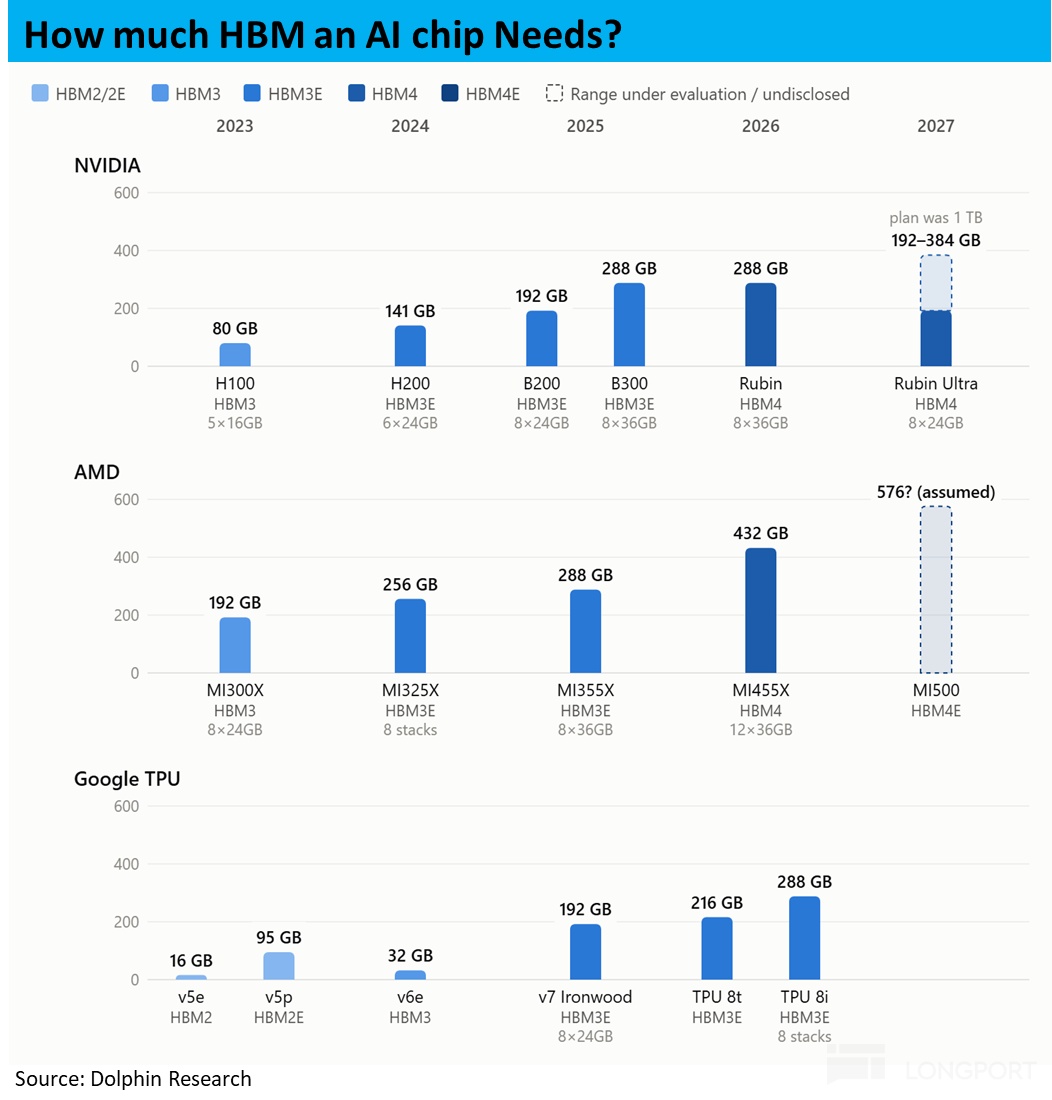
② HBM per XPU: capacity per die is capped, but mix-led lift continues. Adding more stacks raises process complexity and wafer loss, so HBM per die capacity is no longer climbing.
Nvidia’s Rubin keeps per-die capacity similar to GB300, and Rubin Ultra may even step down from 288 GB to 192 GB. However, ASICs historically had lower HBM per die and are trending up toward Nvidia GPUs (from 192 GB to 288 GB), while AMD competes with more HBM per package (MI455X at 432 GB per module). As their shipment shares rise, Avg. HBM per XPU can still grow ~14% p.a. in 2026–28.
③ DDR per XPU: AI servers also consume substantial DDR.
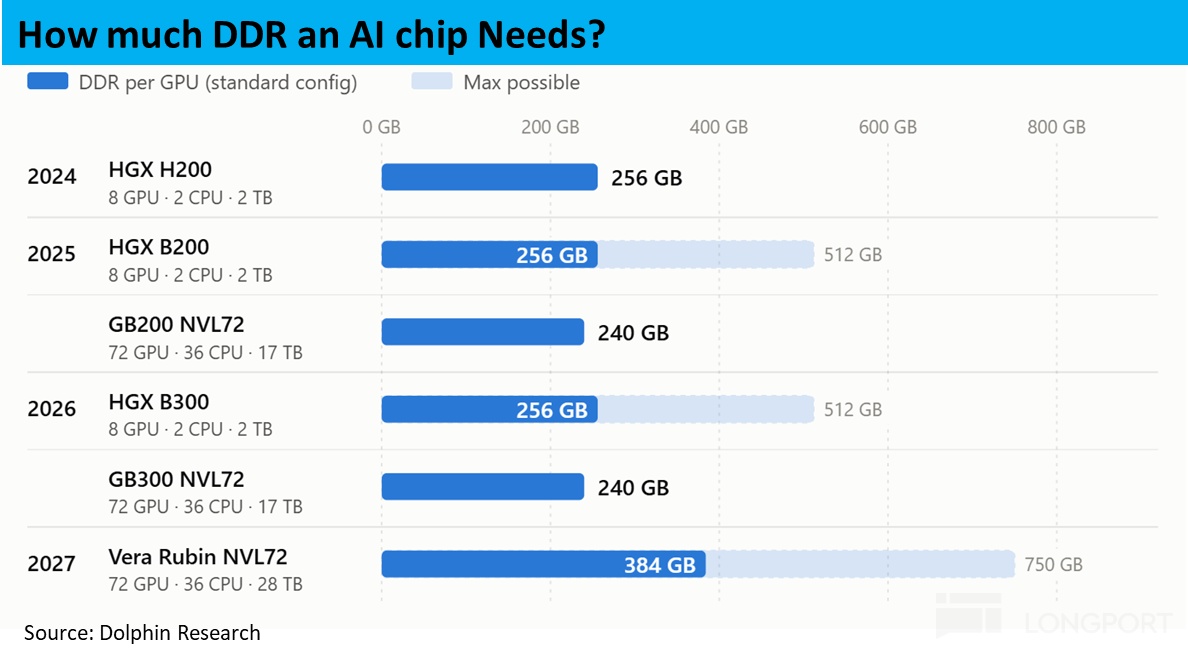
AI XPUs do not use DDR directly, but CPUs in AI servers do. For Nvidia B200, eight GPUs pair with two x86 CPUs and 2 TB of memory, implying ~256 GB DDR per GPU.
As CPU:GPU ratios in AI servers rise (B200 at 1:4, VR series already at 1:2), per-system memory demand keeps increasing. Weighted by shipments, we estimate host memory per XPU rises from ~220 GB in 2025 to ~290 GB in 2028.
AI clusters also include inference servers without HBM, CPU compute nodes, and storage nodes, all consuming DDR. These are hard to forecast by product, so we add ~25–33% extra DDR for this category.
d. Demand summary: servers take center stage
Server (incl. AI) demand share rises from ~34% in 2025 to ~59% in 2028. From 2025–28, general-purpose servers, AI DDR and HBM each contribute ~30% of demand growth; conventional products contribute less than 10%.
Implication: the pricing anchor shifts from consumer electronics to cloud capex — buyers are more capitalized and price hikes transmit more easily, but demand concentration raises cyclical risk if AI spend cools. Also, tightness is not only HBM: incremental DDR for servers (~145 bn Gb) is over 2x HBM’s (~62 bn Gb), so conventional DRAM is also tight.
2.2 Industry supply: 2026 is a lull, 2028 sees concentrated release
Supply is more visible than demand. In short, DRAM output depends on two drivers: wafer capacity and bit output per wafer.
Wafer additions are constrained by cleanroom build timing, typically 2–3 years from ground-breaking to volume, making 2–3 year capacity fairly set today. Bit per wafer depends on node, HBM yield, and wafer allocation between DDR vs. HBM.
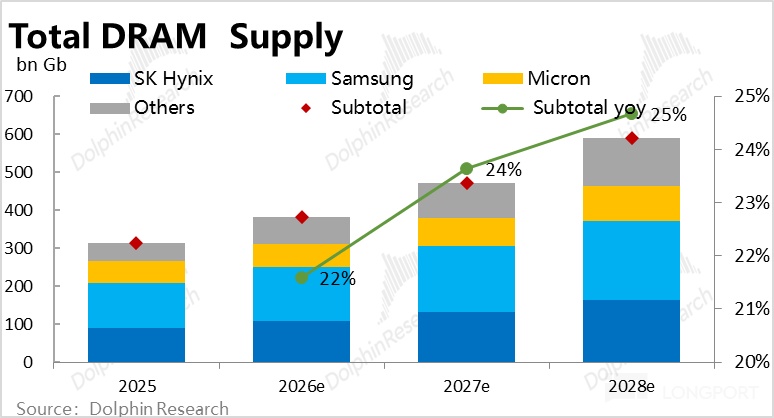
We estimate industry DRAM bit supply (incl. HBM, adjusted for CoWoS losses) rises from ~314 bn Gb in 2025 to ~589 bn Gb in 2028, growing ~22–25% p.a. in 2026–28.
a. Wafer capacity — three majors expand in parallel, HBM prioritized
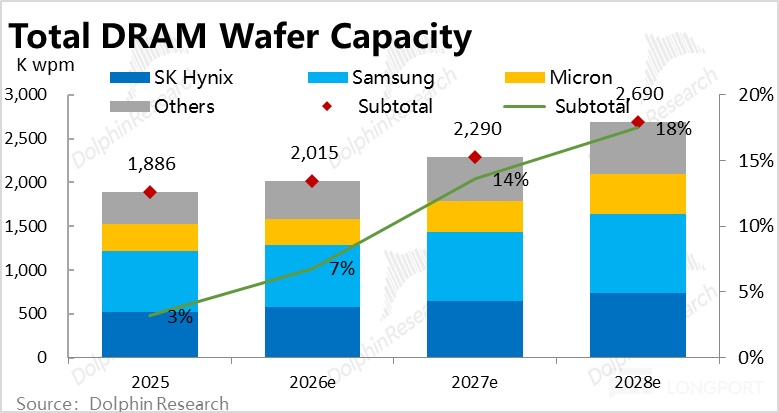
At the wafer base, industry DRAM wafer capacity (monthly) rises from ~1.89 mn to ~2.69 mn, up ~40%, back-end loaded with new capacity releasing meaningfully from 2027.
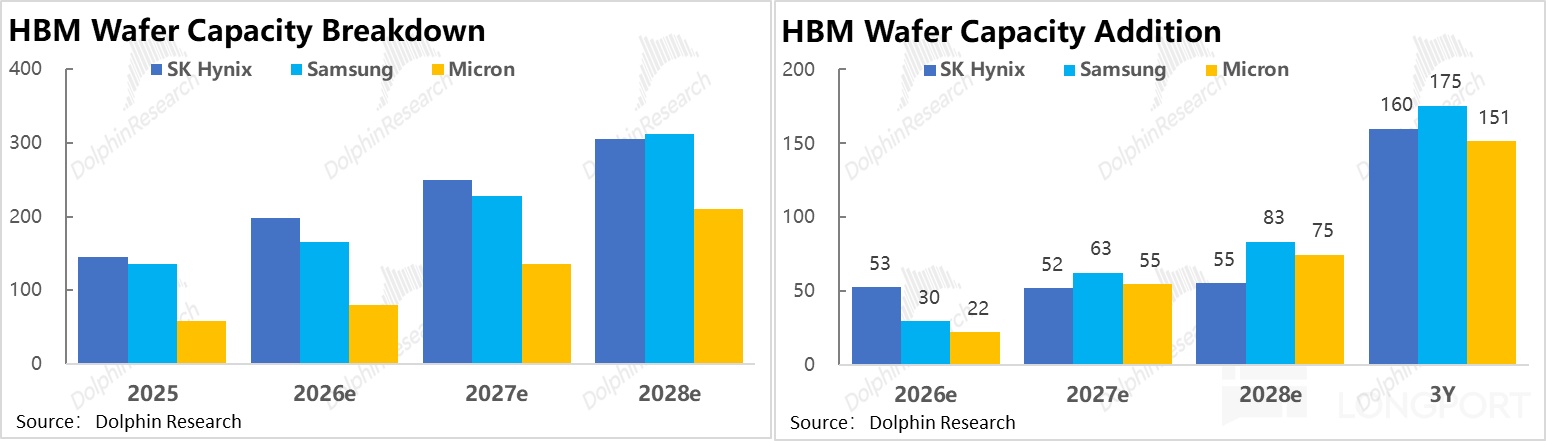
Among the big three, hynix’s gross additions roughly match Samsung, adding just over 200 kpwm in 2025–28. Micron adds ~140 kpwm, less in absolute but largest in relative terms (+46%). HBM wafer additions are similar among the three.
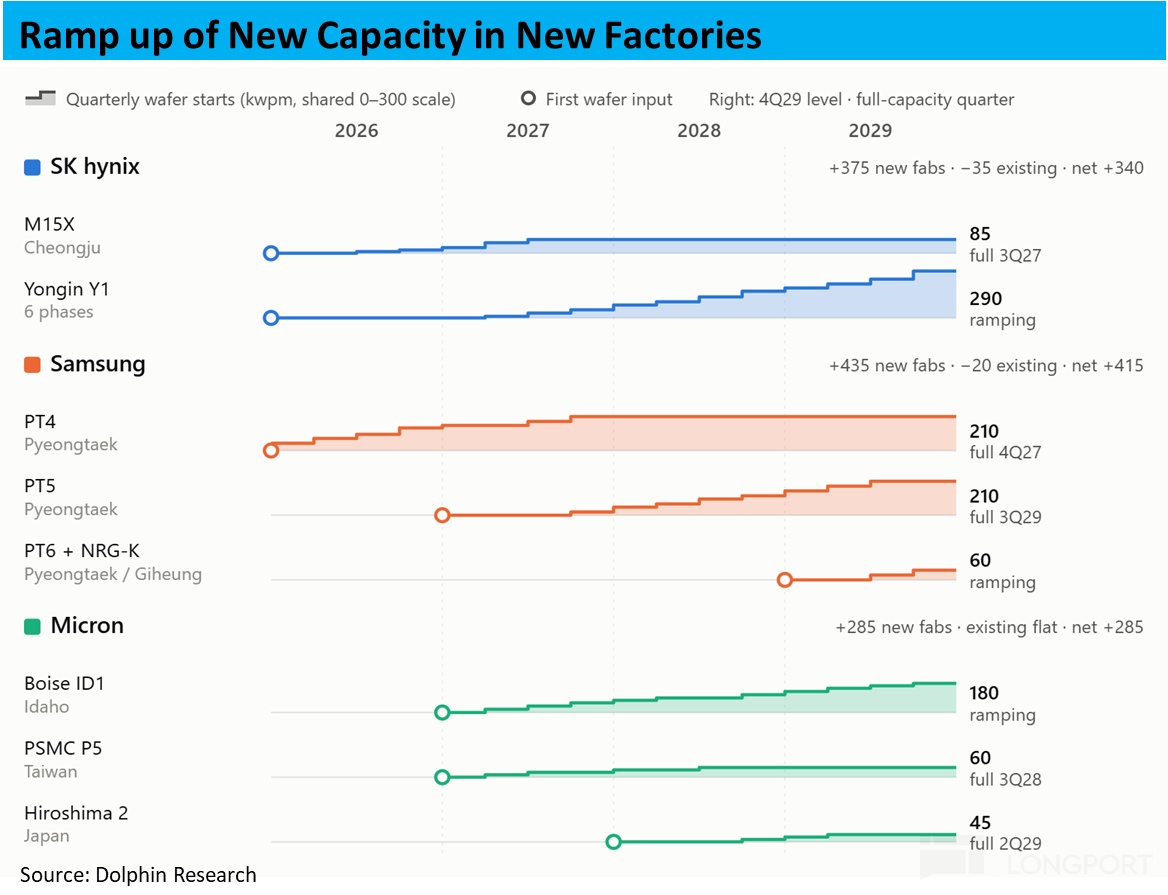
① New fabs come online post-2027; 2026 is a 'lull'
Tight supply partly reflects late-start expansions: in the 2023 downturn, capex was cut and fab timelines delayed. Thus, only a few projects add capacity in 2026, e.g., hynix Cheongju M15X and Samsung Pyeongtaek P4. From 2027–28, hynix Yongin Phase 1, Samsung P5, and Micron’s new Idaho fab ramp, lifting capacity growth.
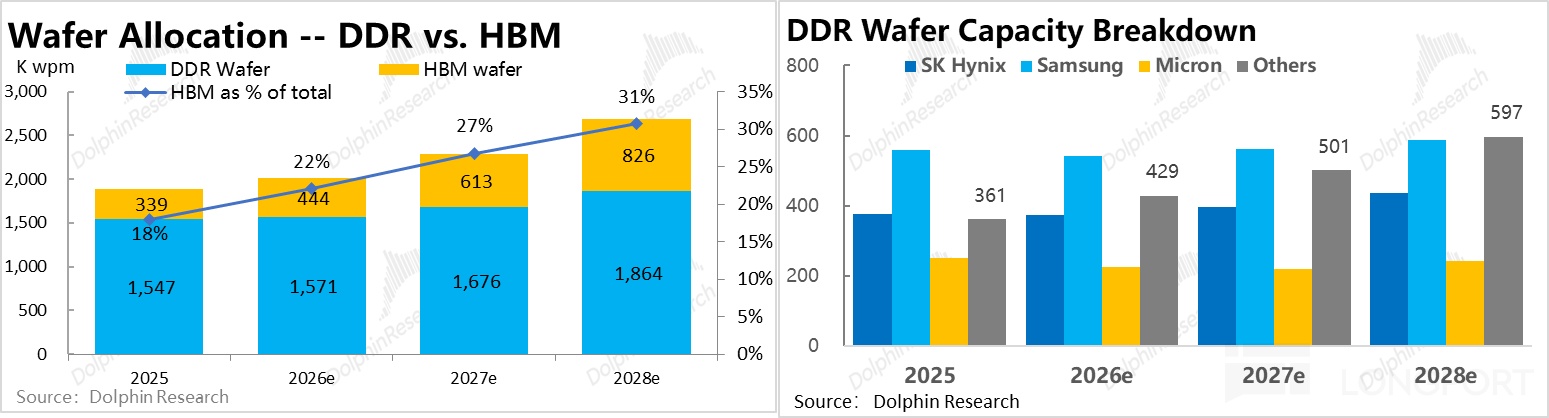
② HBM absorbs most incremental wafers. HBM-usable wafers rise from ~340 kpwm to ~830 kpwm in 2025–28, lifting share from ~18% to ~31%. Meanwhile, DDR-usable wafers at the big three rise only ~7% over three years.
With new wafer additions prioritized for HBM, DDR wafer capacity is effectively flat, underpinning tightness in conventional DDR.
③ China players drive DDR wafer additions
As the big three largely hold DDR capacity steady, DDR wafer growth comes mainly from China players like CXMT, whose share rises from ~23% to ~32%.
Since conventional DDR has limited tech barriers, if domestic capacity keeps rising and AI demand peaks, conventional DDR tightness could reverse materially.
b. Capex broadly maps to new capacity
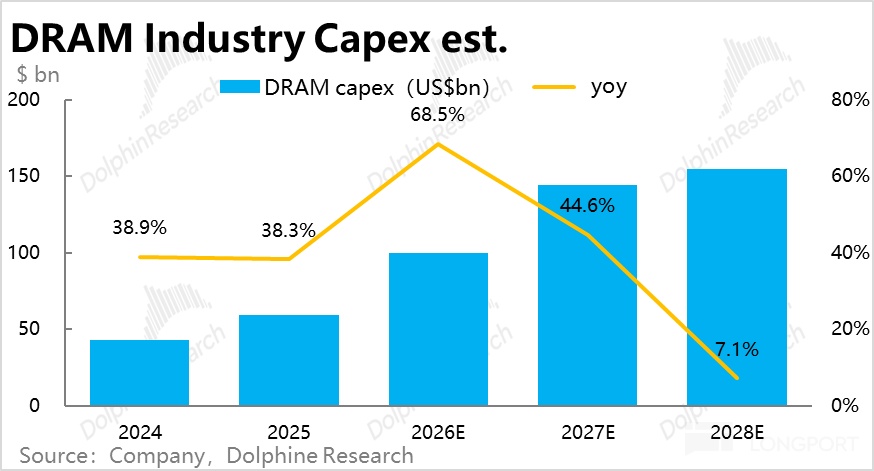
Wafer capacity forecasts can be cross-checked with capex. Industry DRAM capex rises from ~$43 bn in 2024 to ~$100 bn in 2026, peaking in 2026 (~+69%).
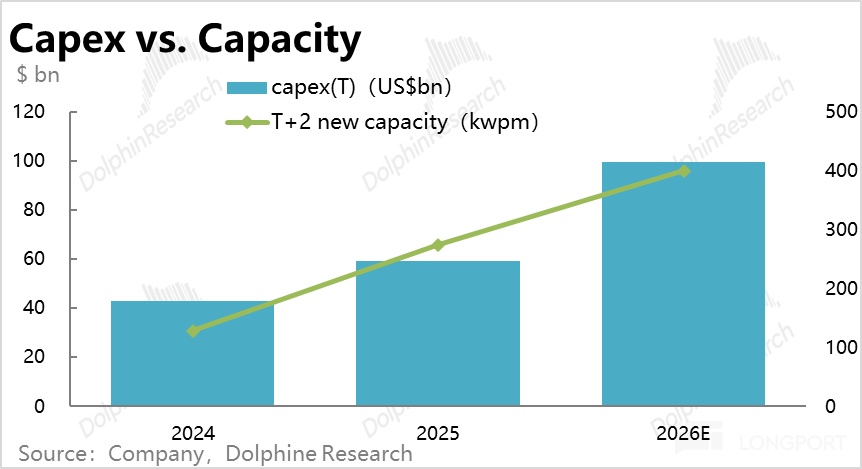
Market then expects capex growth to slow, falling to ~7% in 2028 (implying 2029–30 capacity growth slows, though forecasts can be off). With capex leading capacity by ~2 years, 2024–26 spend largely sets 2026–28 capacity. Historically, ~$2.2–3.3 bn capex per 10 kpwm maps to 2026–28 additions, broadly stable.
c. Bits per wafer: DDR via node migration, HBM via more wafers
① DDR leverages node migration:
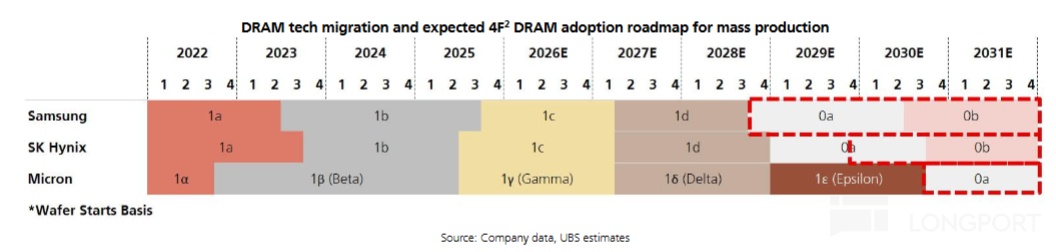
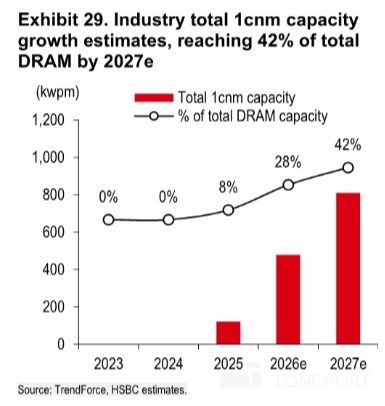
Since DDR-usable wafers grow little by 2028, DDR bit growth relies on node advances lifting bits/wafer. Starting in 2026, the big three ramp 1c nodes, then trial 1d in 2027–28, with 1c reaching ~50% share around 2027.
We assume DDR bits/wafer up ~18% in 2026, then ~14–10% in 2027–28, based on multi-source references.
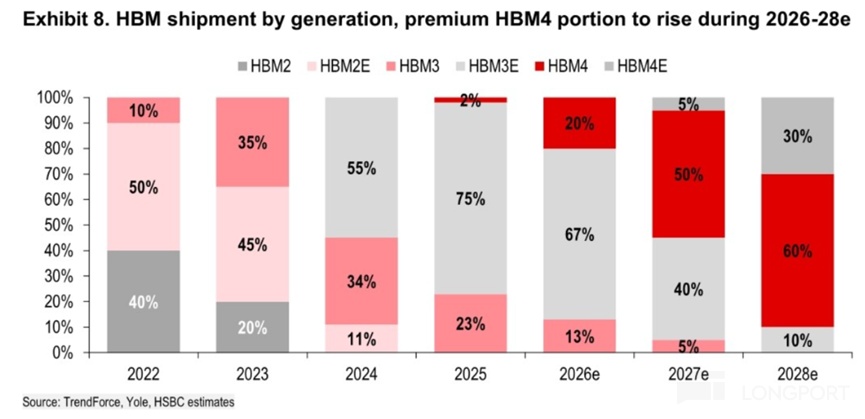
② HBM bits/wafer rise more slowly: node gains are offset by generational shifts. From 2026, output moves from HBM3E toward HBM4/4E, with higher stack counts and tougher processes increasing losses.
We estimate hynix HBM bits/wafer up only ~2–6% p.a., with bit growth relying on more wafers. Samsung and Micron, lagging previously in output, close the gap as Samsung’s utilization/yield improves post certification with Nvidia and Google, unlocking previously 'idle' HBM capacity.
③ Net bit output: HBM is the 'pump' drawing from DDR supply
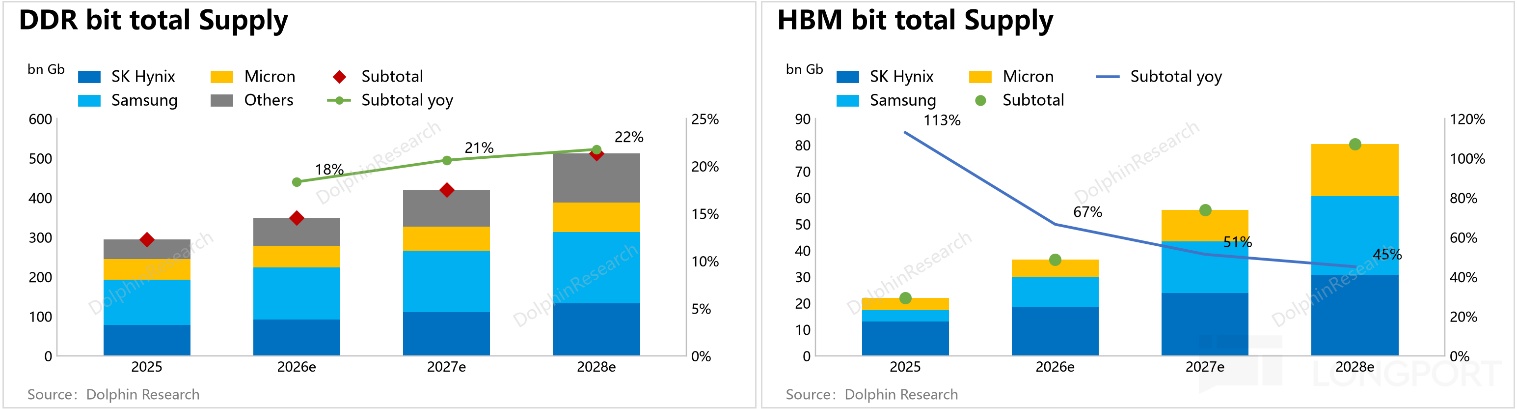
HBM growth rate far outpaces DDR, but DDR adds more absolute bits. From 2025–28, DDR bit supply rises from ~295 bn Gb to ~512 bn Gb, ~20% CAGR accelerating each year. HBM (pre-packaging) rises from ~22 bn Gb to ~80 bn Gb, ~54% CAGR decelerating.
By vendor, total bit supply grows ~18–22% p.a. across the big three, with different mixes: hynix’s HBM grows slowest (~33%), DDR fastest (~20%); Samsung’s HBM output rises ~7x with over half from bits/wafer catch-up; Micron channels most new wafers to HBM, with growth concentrated after its 2028 fab launch.
④ HBM shifts from 'one dominant' to 'three-way', with hynix’s HBM share falling from ~59% to ~38%, roughly tied with Samsung. Since new HBM wafers added are similar (~150–180 kpwm) among the three, Samsung yield ramp is the key variable for hynix’s share.
d. Capacity adjusted for CoWoS
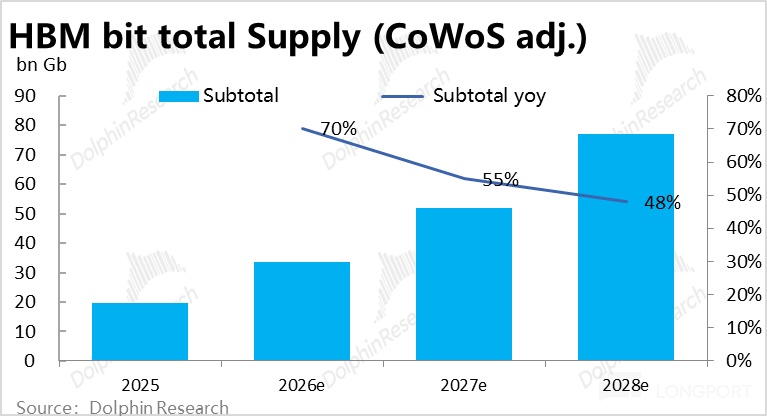
HBM is co-packaged with GPUs/ASICs via CoWoS. Assuming CoWoS yield rises from ~90% in 2025 to ~96% in 2028, net HBM supply rises from ~19.7 bn Gb to ~77 bn Gb. As noted earlier, advanced packaging also constrains AI chip output, not just memory.
2.3 Supply–demand gaps: peak in 2026, DDR and HBM diverge
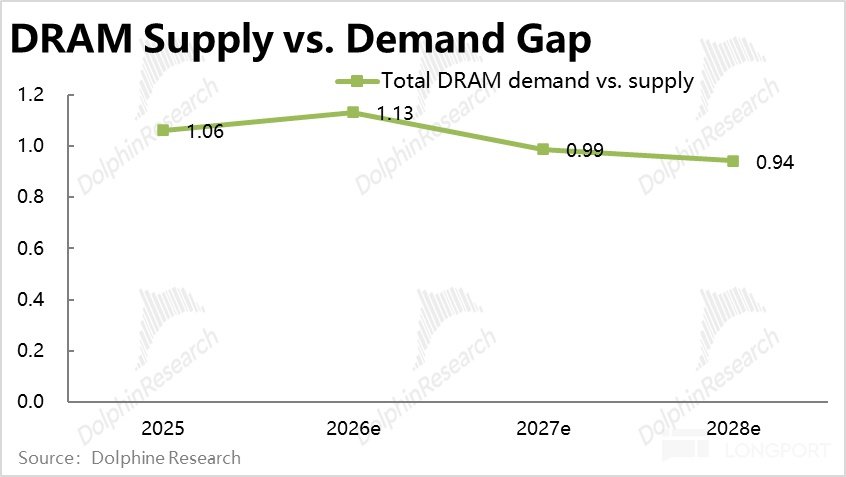
Combining the above demand and supply, we expect industry DRAM (incl. HBM) supply–demand tightness to peak in 2026 (demand ~13% above supply), balance in 2027, and tip slightly into surplus in 2028.
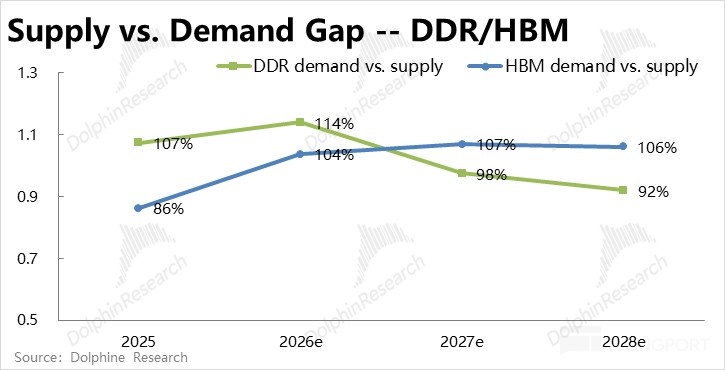
Structurally, DDR vs. HBM diverge: DDR is tightest in 2026 and loosens in 2027–28, while HBM tightens. Pricing-wise, conventional DRAM sees the sharpest price hikes in 2026, slower increases in 2027, then more pressure to decline in 2028; HBM retains pricing support in 2027–28.
a. Conventional DRAM: loosens in 2027
We estimate DDR supply–demand ratio (supply/demand) moves from 1.07 in 2025 to 1.14 in 2026, then down to 0.98 and 0.92 in 2027–28 (2026 shortfall ~49 bn Gb, 2028 surplus ~41 bn Gb).
Even if DDR loosens overall, falling prices could trigger demand rebound in traditional endpoints, and could also push vendors to reallocate wafers faster from DDR toward HBM. This would make DDR a bit tighter and HBM a bit looser at the margin.
b. HBM: tightness rises from 2027, supporting higher prices
HBM supply–demand (incl. customer stock) moves from ~1.04 in 2026 to ~1.06–1.07 in 2027–28, gradually lifting scarcity. This supports consensus that HBM pricing rises materially (per-GB ASP from ~$15 to $20–30).
Note, however, HBM is most sensitive to AI XPU shipments. In 2027, a 10% swing in XPU shipments shifts HBM S/D ratio by ~0.1 — a 10% drop could flip HBM to ~4% surplus, and a 10% rise could widen the shortfall to ~17%.
c. Inventory: 2026 tightness is inflated; watch for destock in 2027
Inventories amplify supply–demand swings: downstream customers pre-buy and sometimes double-order in price-up cycles. UBS estimates ~40 bn Gb of customer restocking in 2026 (~10% of DDR demand). If accurate, ~80% of the 2026 DDR shortfall is restocking-driven.
Thus, a key 2027 risk is whether customers destock, hinging on their view of future tightness. Since DDR S/D is roughly balanced in 2027 on our numbers, inventory release could swing to surplus sooner, pulling forward price pressure from 2028 into 2027.
At this point, we have finished our full analysis of the DRAM industry supply‑demand landscape. 2026 will be a supply gap window where DDR tightness peaks. DDR supply will ease in 2027‑2028, while HBM takes over as the bottleneck.
Supply and demand lay the foundation for memory chip earnings. Yet industry trends alone tell only part of the story. SK Hynix’s client partnerships and long‑term agreements will define its actual gains and downside risks amid this cycle.
Industry upcycle does not guarantee easy profits at the company level. This note stays on SK hynix, examining its partnerships with NVIDIA, major ASIC customers, the three vendors’ LTA playbooks, and our forward estimates and valuation.
In the AI era, incremental memory demand concentrates with a handful of XPU and cloud players, and products are increasingly customized. Becoming a primary supplier to top customers is therefore critical. In this pricing round, LTAs have also become the main tool for both sides to lock in supply and demand. We first review customer share (bit basis unless noted), then LTAs.
At this point, we have finished our full analysis of the DRAM industry supply‑demand landscape. 2026 will be a supply gap window where DDR tightness peaks. DDR supply will ease in 2027‑2028, while HBM takes over as the bottleneck.
Supply and demand lay the foundation for memory chip earnings. Yet industry trends alone tell only part of the story. SK Hynix’s client partnerships and long‑term agreements will define its actual gains and downside risks amid this cycle.
This analysis continues in Part 2, where we break down its key‑client landscape, pros and cons of long‑term contracts, and project earnings plus fair valuation. Read Part 2 here.
<End of full text>
Historical Dolphin Research on SK hynix:
‘Memory Power Takes the Baton from Compute Power: Why Did HBM Stand Out?’
‘From HBM Height Limits to NAND Spec Bumps: Nvidia vs. Memory Power — Who Holds the Leverage?’
I. Dolphin Research AI Memory series
SanDisk (Part 1): ‘AI Inference Boom: Can 'Unlucky' SanDisk Rise Like a Phoenix?’
SanDisk (Part 2): ‘NAND’s 'Prolific' Nature: How Can SanDisk Hold 80% GPM?’
SanDisk (Part 3): ‘From Supporting Role to Center Stage: How AI Inference Can Flip the Script for NAND?’
II. Dolphin Research AI DC Interconnect series
CPO sector
‘AI Hyper-Connectivity: Racing Toward Light?’ ‘The 'Copper' Lady Won’t Leave! CPO: Real Opportunity or Mirage?’
Networking architectures
Nvidia networking: ‘AI Era DC Interconnect: Beyond Single Chips, Win by 'Net' — Is There a China Angle?’
DC networking — AMD vs. Nvidia: ‘AMD Arm-Wrestles Nvidia: Is Helios Ready?’
Google networking: ‘Challenging Nvidia’s Hegemony: What Powers Google’s 'Optical Network'?’
Single names
Lumentum (Part 1): ‘From Optical Interconnect Veteran to 'Universal Arms Dealer': What Makes Lumentum Tick?’
Lumentum (Part 2): ‘Lumentum: Capacity Crunch — What Else Is in the Toolkit of the 'Universal Arms Dealer'?’
III. Dolphin Research AI XPU series
Agents and CPUs: ‘Muse Goes Viral: Is This CPU’s ChatGPT Moment?’
…For more, visit Longbridge Dolphin Research.
Risk disclosure and statements: Dolphin Research Disclaimer and General Disclosures