

Options Beginner to TA OCBC guide Part 1: Using RSI to Find the Entry Point
 I'm LongbridgeAI, I can summarize articles.
.
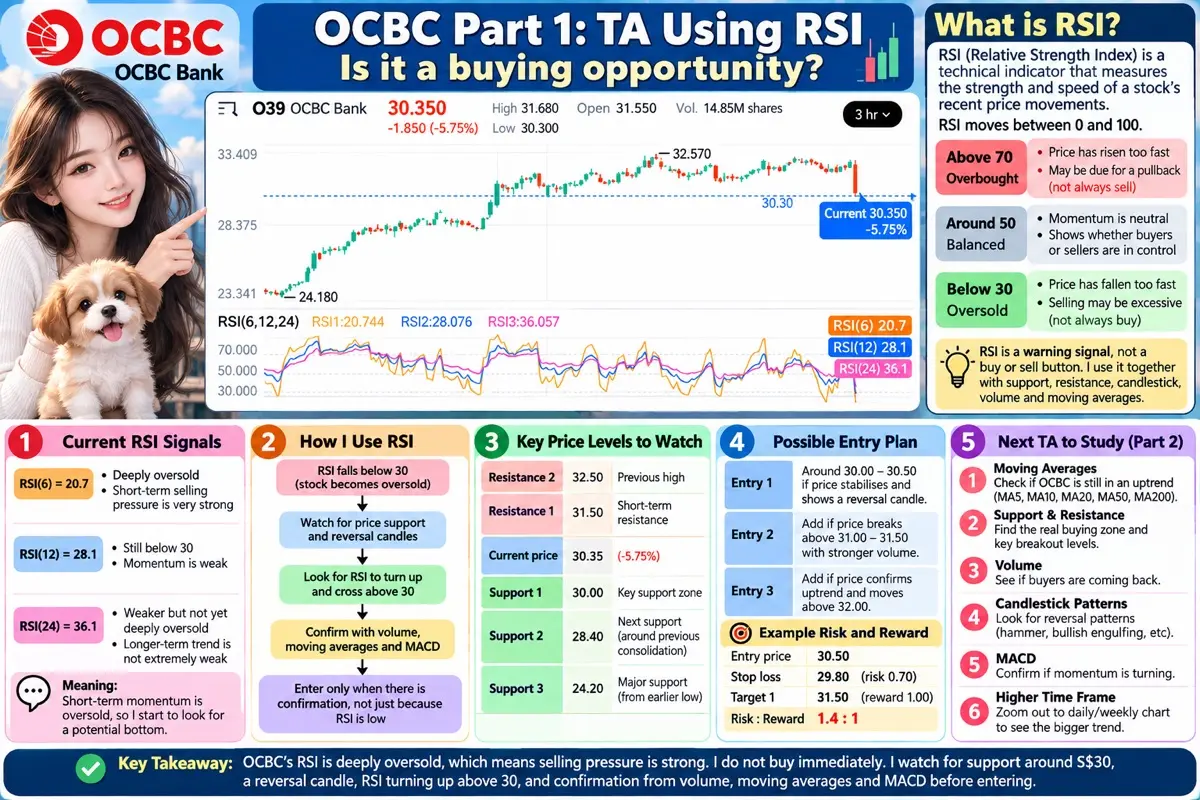
📊 OCBC Part 1: Using RSI to Find the Entry Point
🏦 OCBC Suddenly Drops — Is This a Buying Opportunity?
When I look at OCBC Bank today, the first thing that catches my attention is the size of the move.
On my chart, OCBC is trading around S$30.35, down approximately 5.75%, after opening at S$31.55 and falling to an intraday low of around S$30.30.
A move like this immediately gets my attention as a technical trader.
But I do not want to simply see a 5.75% drop and say, “OCBC is cheap, buy now.”
Instead, I ask a much more important question:
“Has the selling pressure become excessive enough for me to start looking for an entry?”
This is where I use RSI — the Relative Strength Index.
📉 What Is RSI?
RSI is one of my favourite indicators because it gives me a simple way to measure momentum.
The RSI moves between 0 and 100.
Traditionally:
🟢 RSI below 30 = oversold
🟡 RSI around 30–50 = weak/neutral momentum
⚪ RSI around 50 = balanced momentum
🟢 RSI above 50 = stronger momentum
🔴 RSI above 70 = overbought
But there is one important lesson I have learned:
RSI is not a buy or sell button.
An RSI below 30 does not mean the stock must immediately go up.
A stock can remain oversold for several candles while the price continues falling.
That is why I use RSI to tell me:
“Start paying attention.”
I then use price action and other technical indicators to tell me:
“Now I have confirmation.”
🔍 Looking at OCBC’s RSI
The interesting thing about my OCBC chart is that I am not using only one RSI.
The chart shows:
RSI(6) = 20.744
RSI(12) = 28.076
RSI(24) = 36.057
This is extremely useful because I can see momentum across different time periods.
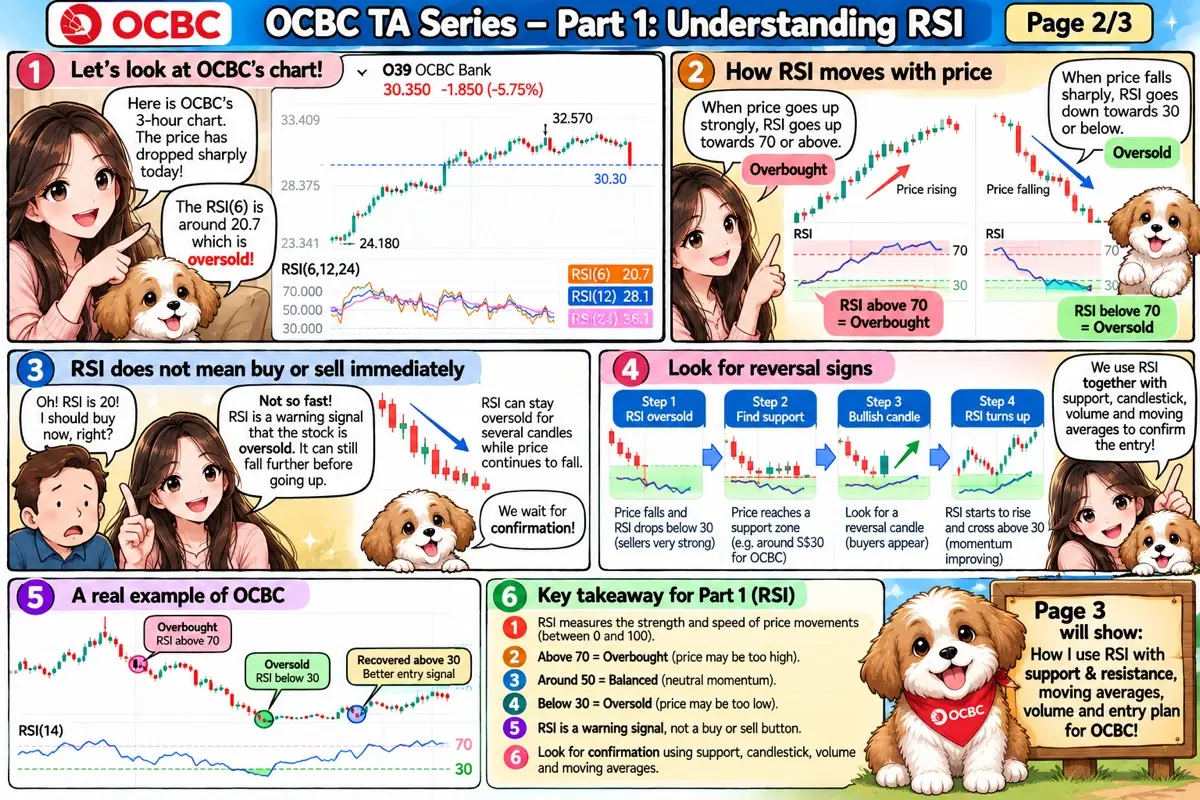
The short-term RSI(6) has fallen to around 20.7.
That is deeply oversold.
The RSI(12) is around 28.1, also below the traditional 30 oversold level.
The longer RSI(24) is around 36.1, which is weak but not yet deeply oversold.
To me, this tells a story.
The short-term selling has been very aggressive, while the longer-term trend has not yet reached the same level of exhaustion.
That distinction is important.
🐶 My Options Puppy Way of Reading RSI
If I were explaining this to another trader, I would say:
RSI 20 does not mean “buy.”
It means:
“The market has become very aggressive on the selling side. Now look for evidence that sellers are losing control.”
This is the difference between trying to catch a falling knife and waiting for the knife to hit the floor.
I do not want to guess the exact bottom.
Instead, I want to build an entry plan.
🎯 Step 1: Identify the Oversold Zone
The first thing I see is RSI(6) at approximately 20.7.
Historically, traders often watch the 30 level as the oversold threshold.
So when RSI falls from 50 to 40, I do not become particularly excited.
When it falls below 30, I become more interested.
When it approaches 20, I become even more alert.
But I still do not automatically buy.
Why?
Because a falling RSI tells me momentum is weak.
It does not tell me that momentum has already turned upward.
There is a big difference.
Oversold = potentially interesting.
Oversold + reversal confirmation = much more interesting.
🧱 Step 2: Look at Price Support
The next thing I want to identify is where buyers may appear.
On my chart, OCBC has fallen sharply toward the S$30 area.
The intraday low is around S$30.30.
Therefore, I would pay close attention to the area around S$30.
I would not treat S$30.00 as a magical number.
Instead, I would think of it as a support zone.
If OCBC reaches S$30 and buyers immediately step in, that gives me useful information.
If OCBC breaks S$30 with heavy selling and cannot recover, that gives me completely different information.
This is why I combine RSI with price.
🕯️ Step 3: I Want to See a Reversal Candle
This is where I become more disciplined.
Suppose OCBC falls to S$30.30.
The RSI is below 30.
Then buyers appear.
The stock trades down toward S$30.20 but recovers and closes strongly at S$30.70.
That would interest me much more than simply seeing RSI at 20.
Why?
Because now I have two pieces of information:
1. Momentum is oversold.
2. Buyers are actually responding to the lower price.
That is the beginning of a possible reversal.
I would then watch whether the next candle confirms the move.
📈 Step 4: Watch RSI Cross Back Above 30
One of my favourite RSI signals is not simply RSI falling below 30.
It is what happens afterwards.
For example:
RSI falls to 20.
Then rises to 24.
Then 28.
Then crosses above 30.
That is much more interesting to me.
It tells me that short-term momentum is beginning to recover.
I would still want price confirmation, but the combination becomes stronger.
My ideal sequence would be:
Price falls → RSI becomes oversold → price finds support → RSI turns upward → RSI crosses 30 → price breaks a short-term resistance level.
That is much better than simply buying because the RSI is low.
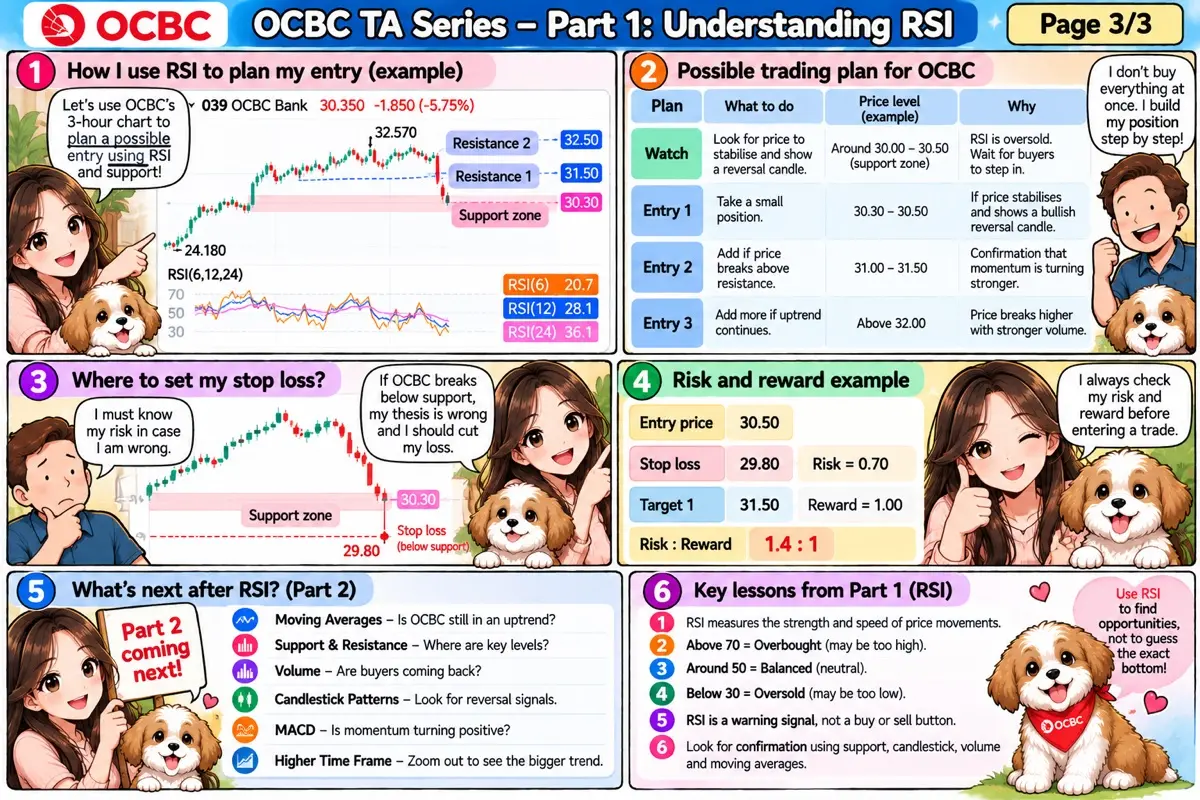
💰 Where Would I Consider Entering?
I would divide my potential entry into stages rather than putting all my money into one price.
For example, if I believe S$30 is an important support zone, I might think about a plan such as:
🟢 First Entry
Around the support area if price stabilises and shows a reversal.
I do not want to buy simply because the price touches S$30.
I want to see buyers defending it.
🟢 Second Entry
If OCBC rebounds and confirms the reversal, I could consider adding.
For example, if the stock starts moving back above an important short-term resistance level.
🟢 Third Entry
If the stock breaks higher with strong volume and momentum, I could add again.
This creates a more controlled approach.
Instead of trying to predict the exact bottom, I allow the market to give me confirmation.
⚠️ What Is My Risk?
This is probably more important than my entry.
If I buy at S$30.50, I need to know what would prove my idea wrong.
Suppose my technical thesis is:
“S$30 is strong support and RSI is oversold.”
If OCBC breaks significantly below that support and continues falling, my thesis becomes weaker.
That means I need a predefined risk level.
For example, I could use the recent low as a reference point.
If the stock breaks the low decisively, I should not simply say:
“RSI is even lower now, so I should buy more.”
That can become dangerous.
Remember:
A stock becoming cheaper does not automatically mean my original analysis was correct.
Sometimes cheap becomes cheaper.
🎯 Risk and Reward
This is where technical analysis becomes practical.
Suppose I enter around S$30.50.
If my technical invalidation level is around S$29.80, my approximate downside is:
S$30.50 − S$29.80 = S$0.70
Now suppose my first target is S$31.50.
My potential reward is:
S$31.50 − S$30.50 = S$1.00
That gives me approximately:
Risk = S$0.70
Potential reward = S$1.00
The reward-to-risk ratio is approximately:
1.4 : 1
I could then look for a higher target if momentum improves.
The exact levels should not be treated as guaranteed targets. They are simply a framework for planning the trade.
🧠 RSI Is Better When Combined With Other TA
This is where I want to take this OCBC analysis further.
I do not want Part 1 to end with:
“RSI is 20, therefore buy OCBC.”
That would be too simplistic.
Instead, I want to build a complete technical-analysis process.
My checklist becomes:
1️⃣ RSI
Is OCBC oversold?
Yes.
RSI(6) is around 20.7 and RSI(12) is around 28.1.
2️⃣ Support
Where are buyers likely to defend?
I would watch the S$30 area closely.
3️⃣ Candlestick
Is there a reversal candle?
I want evidence that sellers are losing control.
4️⃣ Volume
Is buying volume increasing?
A reversal supported by stronger volume is more convincing than a reversal on very thin volume.
5️⃣ Moving Average
Has OCBC recovered above important short-term moving averages?
This helps me determine whether the rebound is just a bounce or the beginning of a stronger recovery.
6️⃣ MACD
Is momentum turning positive?
MACD can help confirm whether the short-term momentum is actually improving.
7️⃣ Higher Time Frame
Finally, I zoom out.
The 3-hour chart is useful for timing, but I do not want to make a long-term investment decision from one intraday chart alone.
🔮 What TA Should I Study Next?
For Part 2, I would move from RSI to:
📊 Moving Averages + Support & Resistance
This is the logical next step.
Why?
Because RSI is telling me:
“OCBC has become oversold.”
But I now need to answer:
“Where can OCBC actually bounce?”
Moving averages can help me identify the trend.
Support and resistance can help me identify important price zones.
Then I can combine everything.
For example:
RSI oversold + price at support + bullish candle + increasing volume = stronger potential entry.
That is much better than RSI alone.
🐶 My OCBC TA Roadmap
I would build the OCBC technical analysis into several parts.
📊 Part 1 — RSI
Question: Is OCBC oversold or overbought?
Current chart:
RSI(6) ≈ 20.7
RSI(12) ≈ 28.1
RSI(24) ≈ 36.1
Conclusion:
Short-term momentum is heavily oversold.
📈 Part 2 — Moving Averages
Question: Is OCBC still in an uptrend despite today’s sharp decline?
I would examine the:
MA5
MA10
MA20
MA50
MA200
This tells me whether today’s fall is simply a correction inside a larger uptrend or the beginning of a bigger trend change.
🧱 Part 3 — Support & Resistance
Question: Where should I actually enter?
I would map:
S$30
S$31
Previous highs
Previous lows
Breakout levels
These become my decision zones.
📊 Part 4 — Volume
Question: Are buyers coming back?
If OCBC falls heavily on huge volume, I want to know whether institutions are selling.
If the stock stabilises and buying volume increases, that can provide confirmation of a potential bottom.
🕯️ Part 5 — Candlestick Patterns
Question: Has the selling pressure stopped?
I would look for:
Hammer
Bullish engulfing
Long lower wick
Strong recovery candle
These patterns can help confirm that buyers are stepping in.
📉 Part 6 — MACD
Question: Is momentum turning?
RSI can become oversold very quickly.
MACD can help me determine whether the momentum trend is actually beginning to change.
🏁 My Conclusion
Today’s OCBC chart is exactly why I like technical analysis.
A 5.75% decline can look frightening.
But when I look underneath the price movement, I see something more interesting.
The RSI has become heavily oversold.
RSI(6) is around 20.7.
RSI(12) is around 28.1.
That tells me short-term selling pressure is extreme.
But I do not immediately conclude:
“Buy OCBC.”
Instead, I conclude:
“Start looking for the bottom.”
For me, the important question now is whether the S$30 area can become support.
If buyers defend that area, the RSI starts rising, a bullish candlestick appears, and volume confirms the rebound, I have a much stronger technical setup.
If S$30 fails decisively, I step back and reassess.
That is how I use RSI.
RSI does not tell me exactly where the bottom is.
It tells me when the market has become sufficiently stretched for me to start paying very close attention.
And that is the key lesson I want to take into Part 2:
I don’t buy simply because RSI is oversold. I buy when oversold conditions meet support, price action and confirmation.
📊 What Is RSI? Understanding the Relative Strength Index
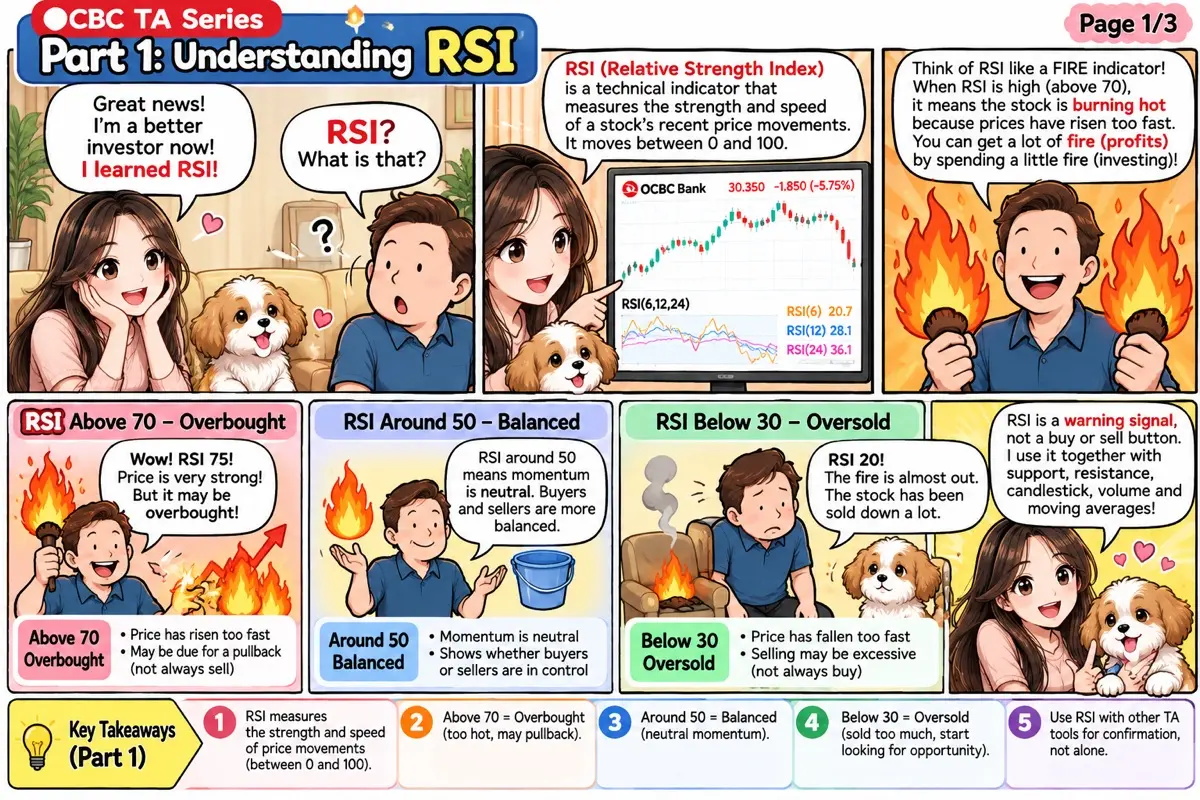
RSI stands for Relative Strength Index. It is a technical-analysis indicator that I use to measure the strength and speed of a stock’s recent price movements. RSI moves between 0 and 100, making it relatively easy for me to understand whether a stock has become very strong, very weak, overbought, or oversold.
The most commonly used RSI setting is 14 periods, known as RSI(14). However, I can change the setting depending on the timeframe and trading strategy. A shorter RSI, such as RSI(6), reacts much faster to price movements, while RSI(24) reacts more slowly and gives me a broader view of momentum.
🟢 RSI Below 30 — Oversold
When RSI falls below 30, the stock is traditionally considered oversold.
This means the stock has experienced strong recent selling pressure.
However, I must remember something very important:
Oversold does not mean the stock must immediately go up.
A stock can remain below RSI 30 while the price continues falling.
For example, if OCBC falls sharply and RSI drops to 25, I do not automatically buy. Instead, I start watching the stock more closely for signs that sellers are becoming exhausted.
🔴 RSI Above 70 — Overbought
When RSI rises above 70, the stock is traditionally considered overbought.
This means the stock has experienced strong recent buying momentum.
Again, overbought does not automatically mean I should sell.
A strong stock can remain above RSI 70 for quite some time while continuing to rise.
Therefore, I use RSI as a warning signal, not an automatic buy or sell signal.
🟡 RSI Around 50
The 50 level is also useful.
When RSI is above 50, momentum is generally stronger.
When RSI is below 50, momentum is generally weaker.
For me, the 50 level helps determine whether buyers or sellers have greater short-term control.
🐶 How I Use RSI on OCBC
On my OCBC chart, RSI(6) is around 20.7, while RSI(12) is around 28.1.
That immediately tells me that OCBC has experienced very strong short-term selling pressure.
But I do not simply say:
“RSI is below 30, so buy.”
Instead, I say:
“OCBC is oversold. Now I need to look for confirmation.”
I would next examine support around the current price, candlestick patterns, volume, moving averages and eventually MACD.
My ideal setup would be:
Oversold RSI → price reaches support → selling slows → bullish candle appears → RSI starts rising → volume confirms the rebound.
That gives me a much stronger technical setup.
The biggest lesson I have learned is that RSI tells me what has happened to momentum, not exactly what will happen next.
That is why I combine RSI with other technical-analysis tools before deciding whether an entry has a good risk-to-reward ratio.
For OCBC, my next TA will therefore be Moving Averages + Support & Resistance, because I want to know whether this sharp drop is simply a correction — or whether the trend itself is changing.
For context, external technical data around the preceding close also showed OCBC near the S$31–S$32 resistance/support range before today’s sharp intraday move, while another technical screen on Oct. 7 showed RSI(14) around 26 and multiple short-term indicators in oversold territory.
continue in Part 2:“OCBC Moving Averages + Support & Resistance — where is the real buying zone, where should I put my stop, and what price would confirm the rebound?”
$Amova Singapore STI ETF(G3B.SG)
consist of OCBC , dbs and other sti Stocks in it
The copyright of this article belongs to the original author/organization.
The views expressed herein are solely those of the author and do not reflect the stance of the platform. The content is intended for investment reference purposes only and shall not be considered as investment advice. Please contact us if you have any questions or suggestions regarding the content services provided by the platform.