

🐶📈 Options Puppy OCBC Technical Analysis — Part 2: MACD for Beginners
 I'm LongbridgeAI, I can summarize articles.
🐶📈 Options Puppy OCBC Technical Analysis — Part 2: MACD for Beginners
Singapore bank stocks • OCBC (SGX: O39) • Technical analysis series
After Part 1, where I explored the Relative Strength Index (RSI), it is time for me to learn another useful technical analysis tool: MACD — Moving Average Convergence Divergence.
🐶💰 As Options Puppy, I do not want to buy OCBC just because its share price is rising, nor do I want to sell simply because the price falls for a day. I want to understand the momentum behind the movement, identify possible changes in trend, and plan my entry, exit and risk management more carefully.
MACD can help me do that. However, it is not a crystal ball, and it cannot guarantee that OCBC will rise or fall.
1️⃣ 🐶 What is MACD?
MACD stands for Moving Average Convergence Divergence. It is a technical indicator that helps me understand whether the momentum behind a share price is strengthening or weakening.
Imagine OCBC’s share price is a puppy running in a park. 🐶
- 🟢 When the puppy runs faster, buying momentum may be increasing.
- 🟡 When the puppy starts slowing down, the upward momentum may be weakening.
- 🔴 When the puppy begins running downhill, selling momentum may be taking over.
MACD tries to measure these changes by comparing two moving averages of OCBC’s share price.
Unlike RSI, which measures the speed and magnitude of recent price movements on a scale from 0 to 100, MACD focuses on the relationship between moving averages. I can use both indicators together to look for stronger trading signals.
2️⃣ 📊 The three parts of MACD
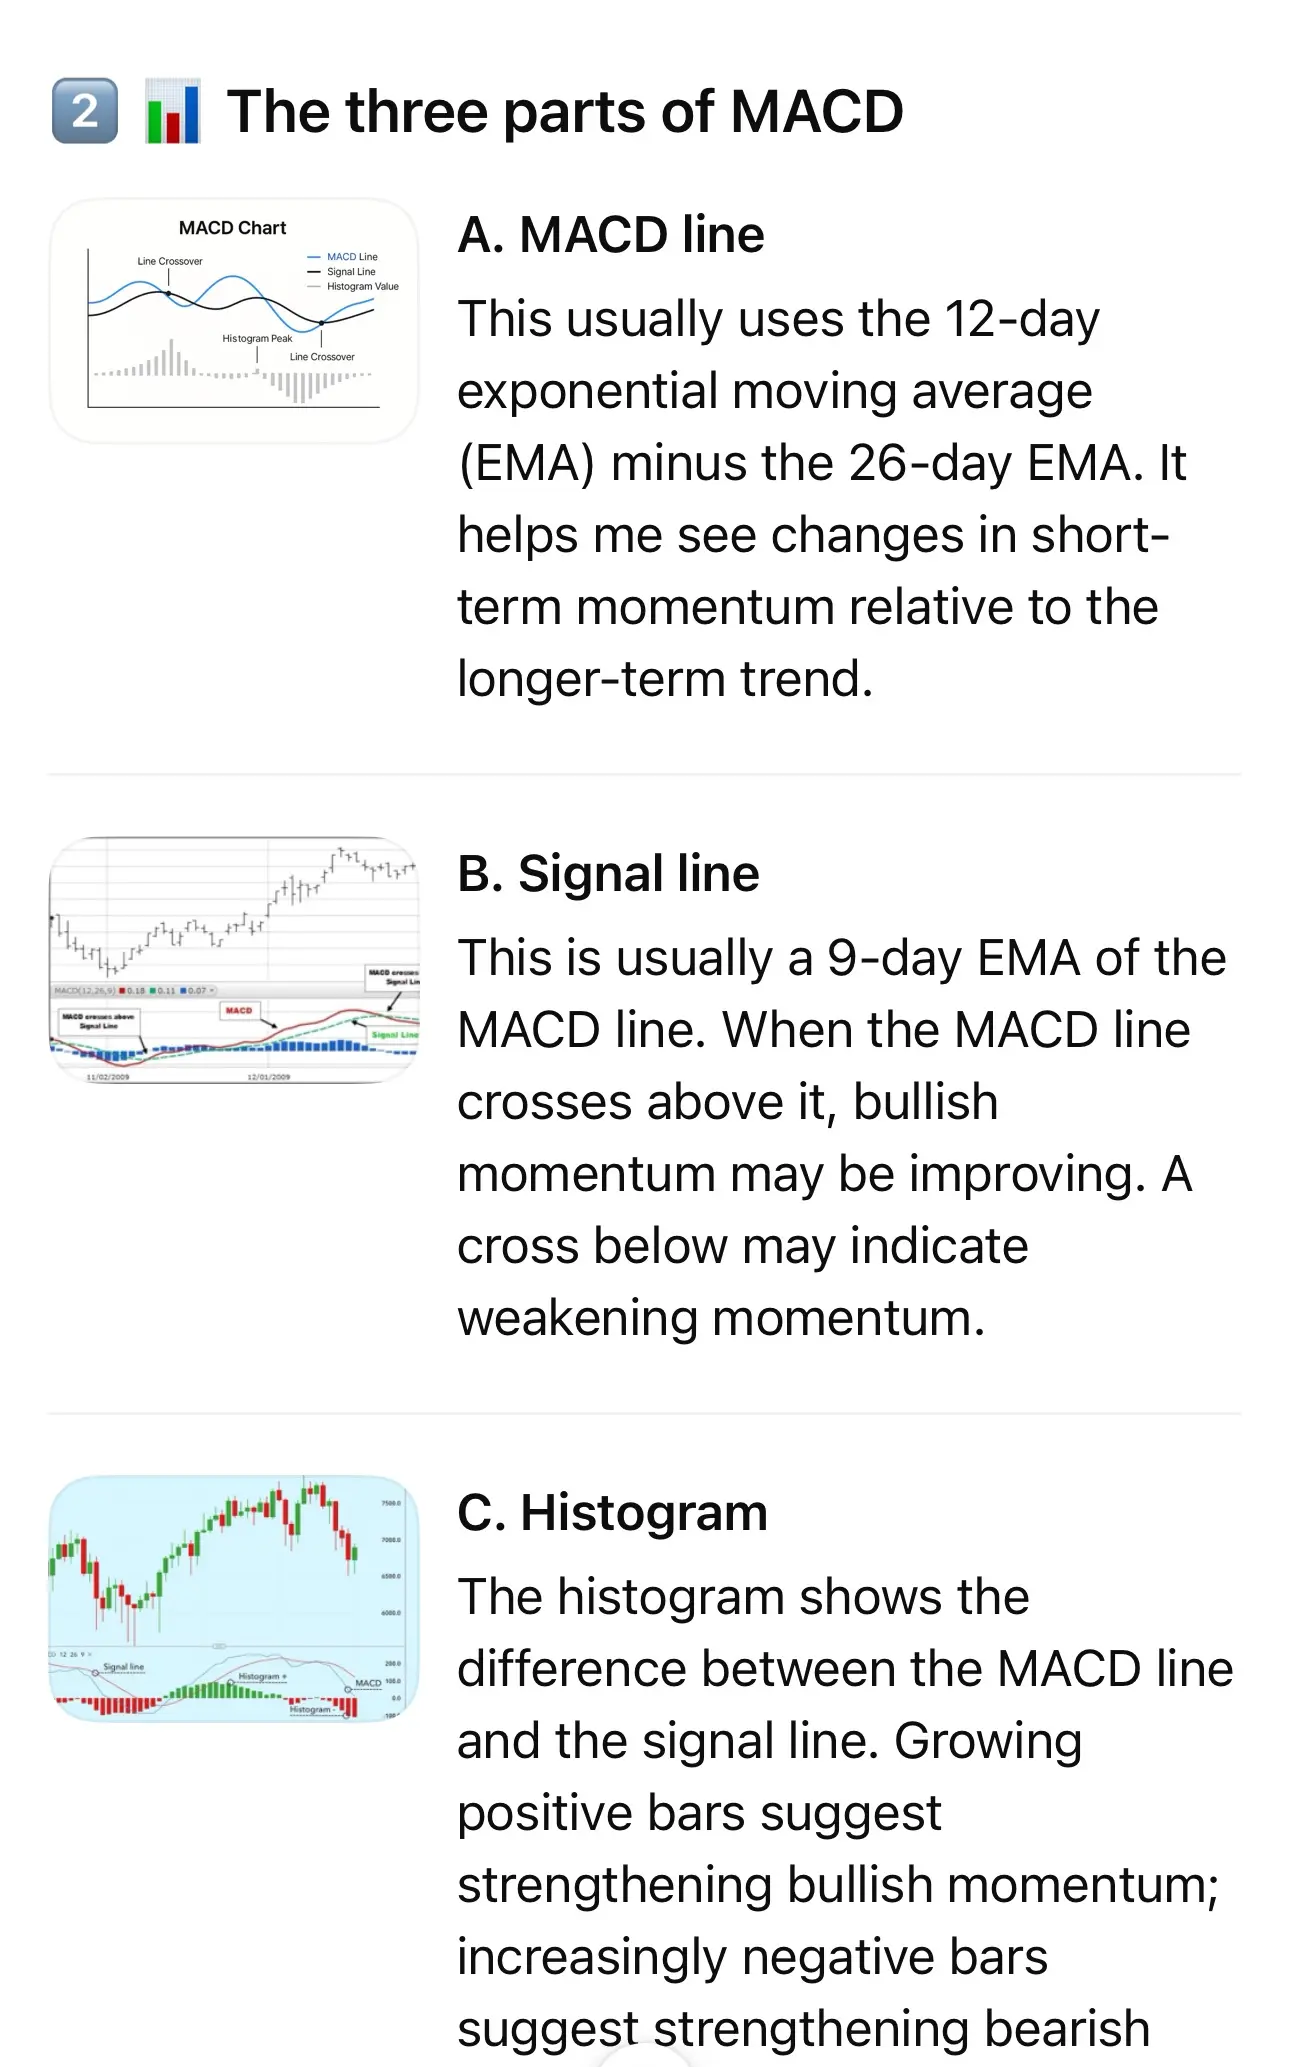
A. MACD line
This usually uses the 12-day exponential moving average (EMA) minus the 26-day EMA. It helps me see changes in short-term momentum relative to the longer-term trend.
B. Signal line
This is usually a 9-day EMA of the MACD line. When the MACD line crosses above it, bullish momentum may be improving. A cross below may indicate weakening momentum.
C. Histogram
The histogram shows the difference between the MACD line and the signal line. Growing positive bars suggest strengthening bullish momentum; increasingly negative bars suggest strengthening bearish momentum.
These are the standard MACD settings of 12, 26 and 9. Different settings can produce different signals, so I should keep my settings consistent when comparing charts.
3️⃣ 🟢 What does a bullish MACD crossover mean?
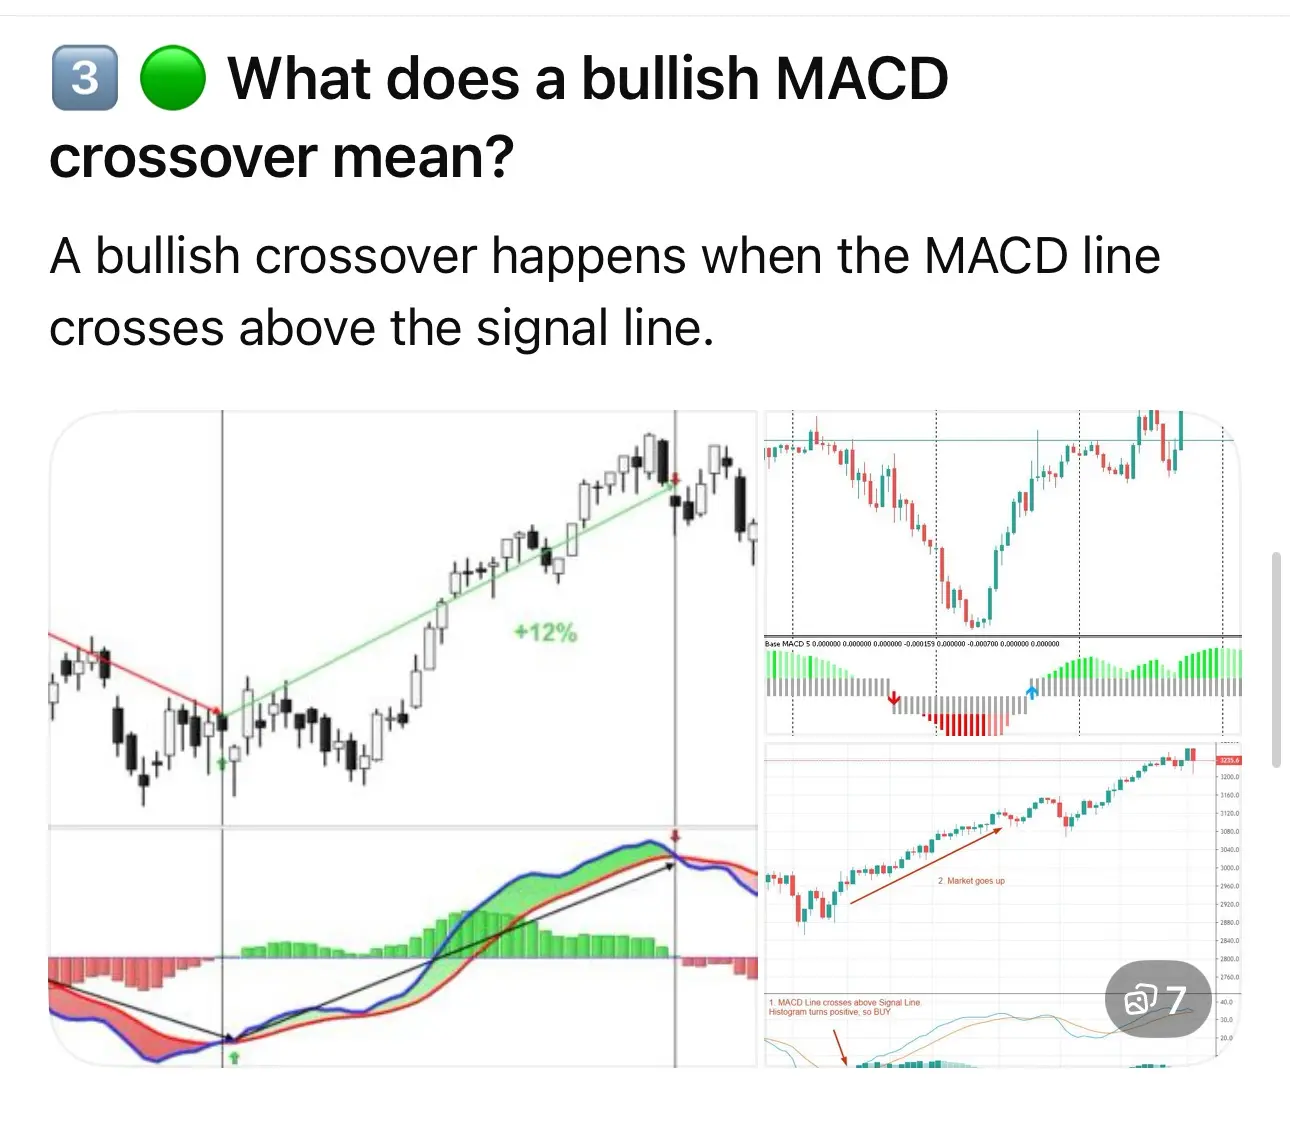
A bullish crossover happens when the MACD line crosses above the signal line.
For example, imagine OCBC has been falling for several trading sessions. The MACD line is below the signal line, and the histogram shows negative bars.
Then something changes:
- OCBC stops falling as quickly.
- The negative histogram bars begin shrinking.
- The MACD line crosses above the signal line.
- OCBC’s share price starts forming higher lows.
🐶 My interpretation: selling pressure may be fading, and buyers could be returning.
However, a bullish crossover is not an automatic buy signal. Sometimes OCBC may bounce for two days before continuing its decline. I would look for confirmation from price action, support levels, trading volume and RSI.
4️⃣ 🔴 What does a bearish MACD crossover mean?
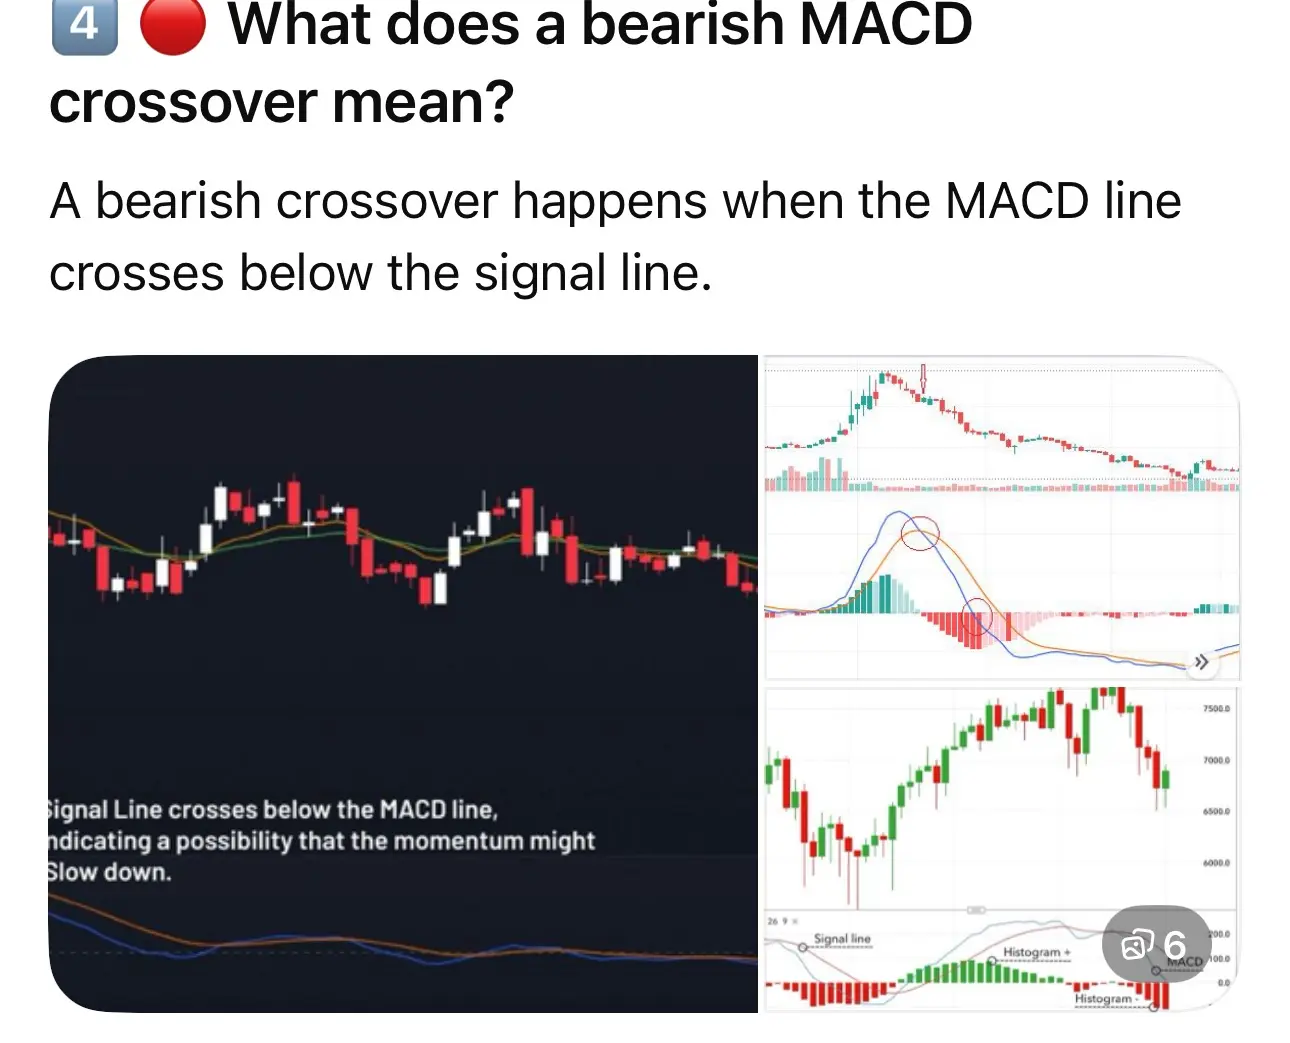
A bearish crossover happens when the MACD line crosses below the signal line.
Imagine OCBC has rallied strongly for several weeks. Buyers have pushed the price higher, but the momentum starts slowing.
I might observe:
- The MACD line crosses below the signal line.
- The positive histogram bars become smaller.
- OCBC struggles to break above resistance.
- The price begins forming lower highs.
This tells me the rally could be losing strength.
It does not necessarily mean OCBC must crash. The share price could consolidate sideways, experience a normal pullback or continue rising after a brief pause.
My job is to watch whether the price confirms the warning.
5️⃣ 📍 Why the zero line matters
The MACD zero line is another useful reference point.
MACD position | What I learn |
Above zero | The 12-day EMA is above the 26-day EMA, suggesting a stronger short-term trend |
Below zero | The 12-day EMA is below the 26-day EMA, suggesting a weaker short-term trend |
Crossing above zero | Momentum may be shifting towards a stronger bullish trend |
Crossing below zero | Momentum may be shifting towards a weaker bearish trend |
A signal-line crossover and a zero-line crossover are different things.
For example, MACD could cross above its signal line while remaining below zero. This may indicate that downward momentum is easing, but the broader trend has not necessarily turned bullish.
For a beginner, this distinction is important. I do not want to confuse a short-term rebound with a confirmed uptrend.
6️⃣ 🏦 Applying MACD to OCBC shares
When analysing OCBC Bank, I want to combine MACD with the price chart rather than look at the indicator alone.
A technical-analysis report published on 12 October 2026 described OCBC’s price as having weakened below its 50-day moving average, with negative MACD histogram momentum. This is an example of why I should check the latest chart rather than assume that a historically strong bank stock will always move upwards.
Here is the framework I would use:
Scenario A: MACD bullish crossover near support
If OCBC approaches a support zone, selling pressure fades and MACD crosses above its signal line, I would watch for a possible rebound. A stronger setup would include a bullish price candle and improving volume.
Scenario B: MACD bearish crossover near resistance
If OCBC rallies towards resistance but MACD crosses below its signal line, I would become more cautious about chasing the rally. I would check whether the price also breaks a short-term support level.
Scenario C: MACD is below zero but improving
This could indicate that bearish momentum is easing. However, I would wait for stronger price confirmation instead of assuming that a bottom has formed.
These are hypothetical scenarios, not confirmed trading signals for today’s session.
7️⃣ 💰 How I combine MACD with RSI
In Part 1, I covered RSI. Now I can use both indicators together.
RSI | MACD | My interpretation |
RSI recovering from below 30 | Bullish crossover | Possible rebound; wait for price confirmation |
RSI around 40–60 | MACD above zero | Potentially constructive trend, depending on price action |
RSI above 70 | Bearish crossover | Momentum may be weakening after a rally |
RSI below 50 | MACD below zero | Caution; bearish momentum may still dominate |
Neither indicator should be treated as a guarantee. In a strong trend, RSI can remain elevated for a long time, while MACD can give late signals because it is based on moving averages.
For OCBC, I would also check its earnings, dividend announcements, interest-rate expectations and the broader Singapore banking sector. Technical indicators describe price behaviour; they do not explain every fundamental reason the share price moves.
8️⃣ 🐶 My Options Puppy entry, risk and reward plan
I would not buy OCBC simply because MACD turns green. I would first define the trade.
Hypothetical trade example
Illustration only — not a current OCBC price forecast or recommendation.
Entry price
S$30.00
Stop level
S$29.40
Target price
S$31.20
Risk-to-reward
1:2
- Entry to stop: S$0.60 per share at risk.
- Entry to target: S$1.20 per share potential gain.
- For 100 shares, the illustrative risk is S$60 and the potential gain is S$120, before costs and slippage.
My plan would be to wait for MACD confirmation and a price setup that supports the trade. I would place my stop according to the actual chart structure and my risk tolerance, rather than choose an arbitrary level just to achieve a 1:2 ratio.
A stop order also cannot guarantee the exact exit price during a sharp market move.
9️⃣ ⚠️ The biggest MACD mistakes beginners make
- Buying every bullish crossover: sideways markets can generate repeated false signals.
- Selling every bearish crossover: an uptrend can experience temporary momentum pullbacks.
- Ignoring the share price: a crossover without support, resistance or price confirmation can be misleading.
- Using only one timeframe: a bullish daily MACD may conflict with a bearish weekly trend.
- Ignoring fundamentals: bank earnings, credit quality, interest rates and dividend expectations can overwhelm a technical setup.
For my OCBC analysis, I would start with the daily chart to understand the near-term trend, then check the weekly chart for the bigger picture.
🔟 🐾 My final Options Puppy checklist
Before I consider buying or adding to OCBC, I would ask myself:
Is OCBC holding a meaningful support zone?
Has the MACD line crossed above its signal line?
Are the histogram bars improving?
Does RSI support the possibility of a rebound?
Is price action confirming the signal?
Have I calculated my downside risk and exit plan?
0 of 6 checks completed
Reset
My conclusion: MACD helps me understand momentum, while RSI helps me assess the strength of recent price movements. Combining both with support, resistance and sensible risk management gives me a more structured way to analyse OCBC.
I do not need to catch the exact bottom. I need a clear plan, a reasonable entry and a risk level I can afford.
🐶💰 Options Puppy reminder: Protect the puppy’s capital first. The next profitable trade can wait.
Next in Part 3: I would study moving averages (MA20, MA50 and MA200) to learn how to identify OCBC’s trend, potential dynamic support and resistance, and possible golden-cross or death-cross signals.
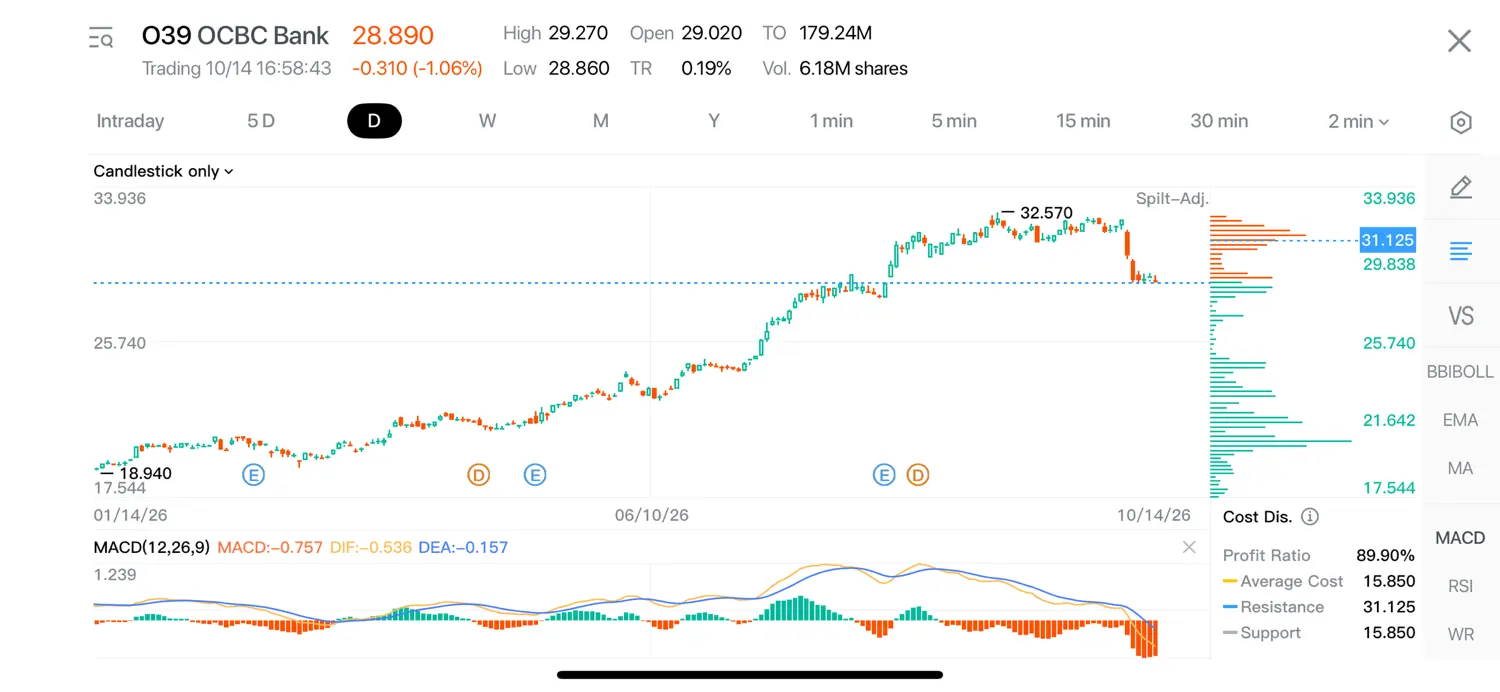
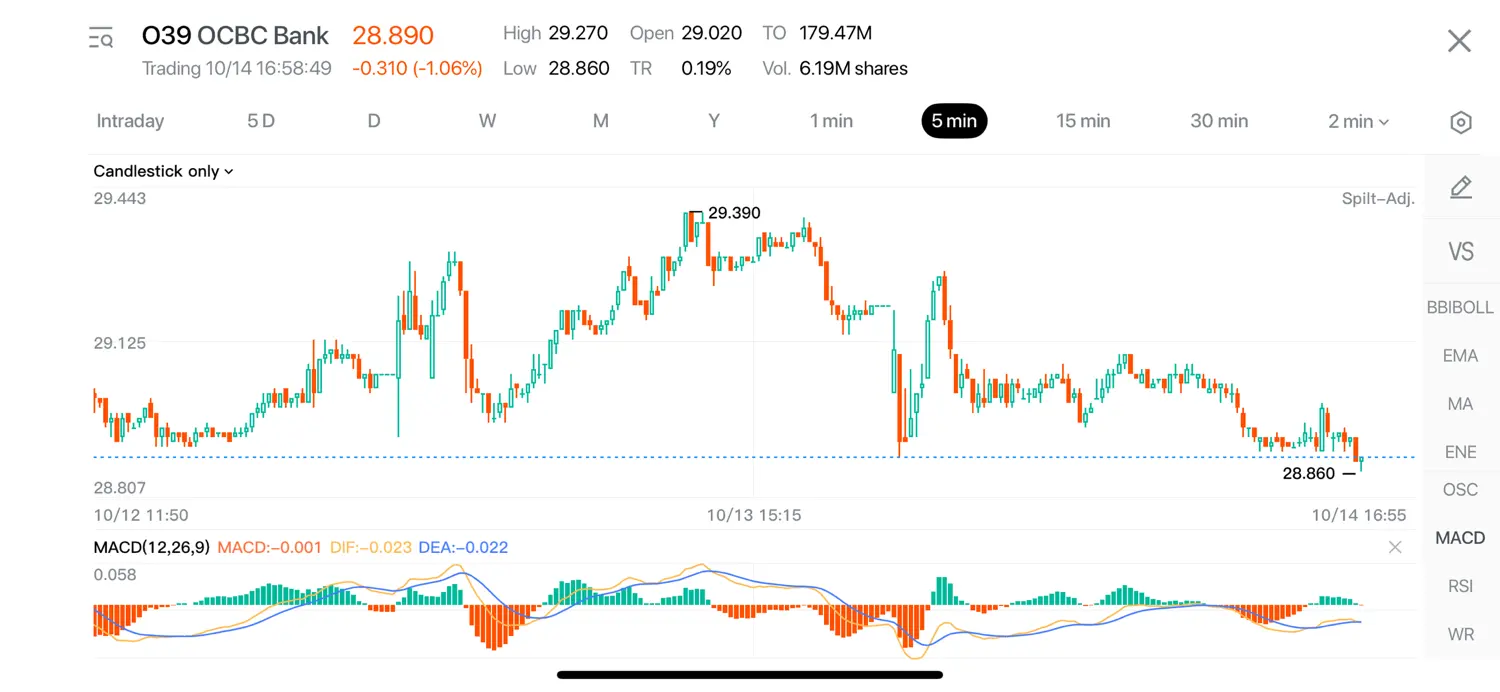
$Amova Singapore STI ETF(G3B.SG) stietf consist ocbc


The copyright of this article belongs to the original author/organization.
The views expressed herein are solely those of the author and do not reflect the stance of the platform. The content is intended for investment reference purposes only and shall not be considered as investment advice. Please contact us if you have any questions or suggestions regarding the content services provided by the platform.