
D
Feb 11, 2025 at 10:41 PM
SMIC (Minutes): Capital expenditure plan remains the same as last year
 I'm LongbridgeAI, I can summarize articles.
SMIC (0981.HK/688981.SH) released its fourth quarter financial report for the fiscal year 2024 (ending December 2024) after the Hong Kong stock market closed on February 10, 2025, Beijing time. The key points from the conference call are as follows:
The following is a summary of the conference call regarding Semiconductor Manufacturing International Corporation's fourth quarter 2024 performance. For the financial report interpretation, please refer to “Semiconductor Manufacturing International Corporation: With 'National Subsidy' in Hand, Can It Withstand the Cycle?”
1. $SMIC(00981.HK) Core Financial Information Review:
24Q4: Revenue of $2.207 billion, a quarter-on-quarter increase of 1.7%. Gross margin of 22.6%, a quarter-on-quarter increase of 2.1 percentage points. Operating profit of $217 million. EBITDA of $1.28 billion, EBITDA margin of 58%. Net profit attributable to shareholders of $108 million.
For the entire year of 2024: Revenue of $8.03 billion, a year-on-year increase of 27%. Due to increased expenses such as depreciation, the gross margin was 18%, a year-on-year decrease of 1.3 percentage points. Operating profit was $474 million. EBITDA was $4.38 billion. EBITDA margin was 54.5%. Profit attributable to the company was $493 million. Capital expenditure was $7.326 billion.
As of the end of 2024, the company's total assets were $49.2 billion, of which cash and cash equivalents were $15 billion. Total liabilities were $17.3 billion, of which total debt was $11.6 billion, and total equity was $31.9 billion. The debt-to-equity ratio was 36.4%, and the net debt-to-equity ratio was -10.6%.
Cash Flow: In 2024, cash generated from operating activities was $3.176 billion. Net cash used in investing activities was $4.518 billion. Net cash generated from financing activities was $1.608 billion.
2025Q1 Guidance: Revenue is expected to increase by 6% to 8% quarter-on-quarter, with gross margin expected to be between 19% and 21%.
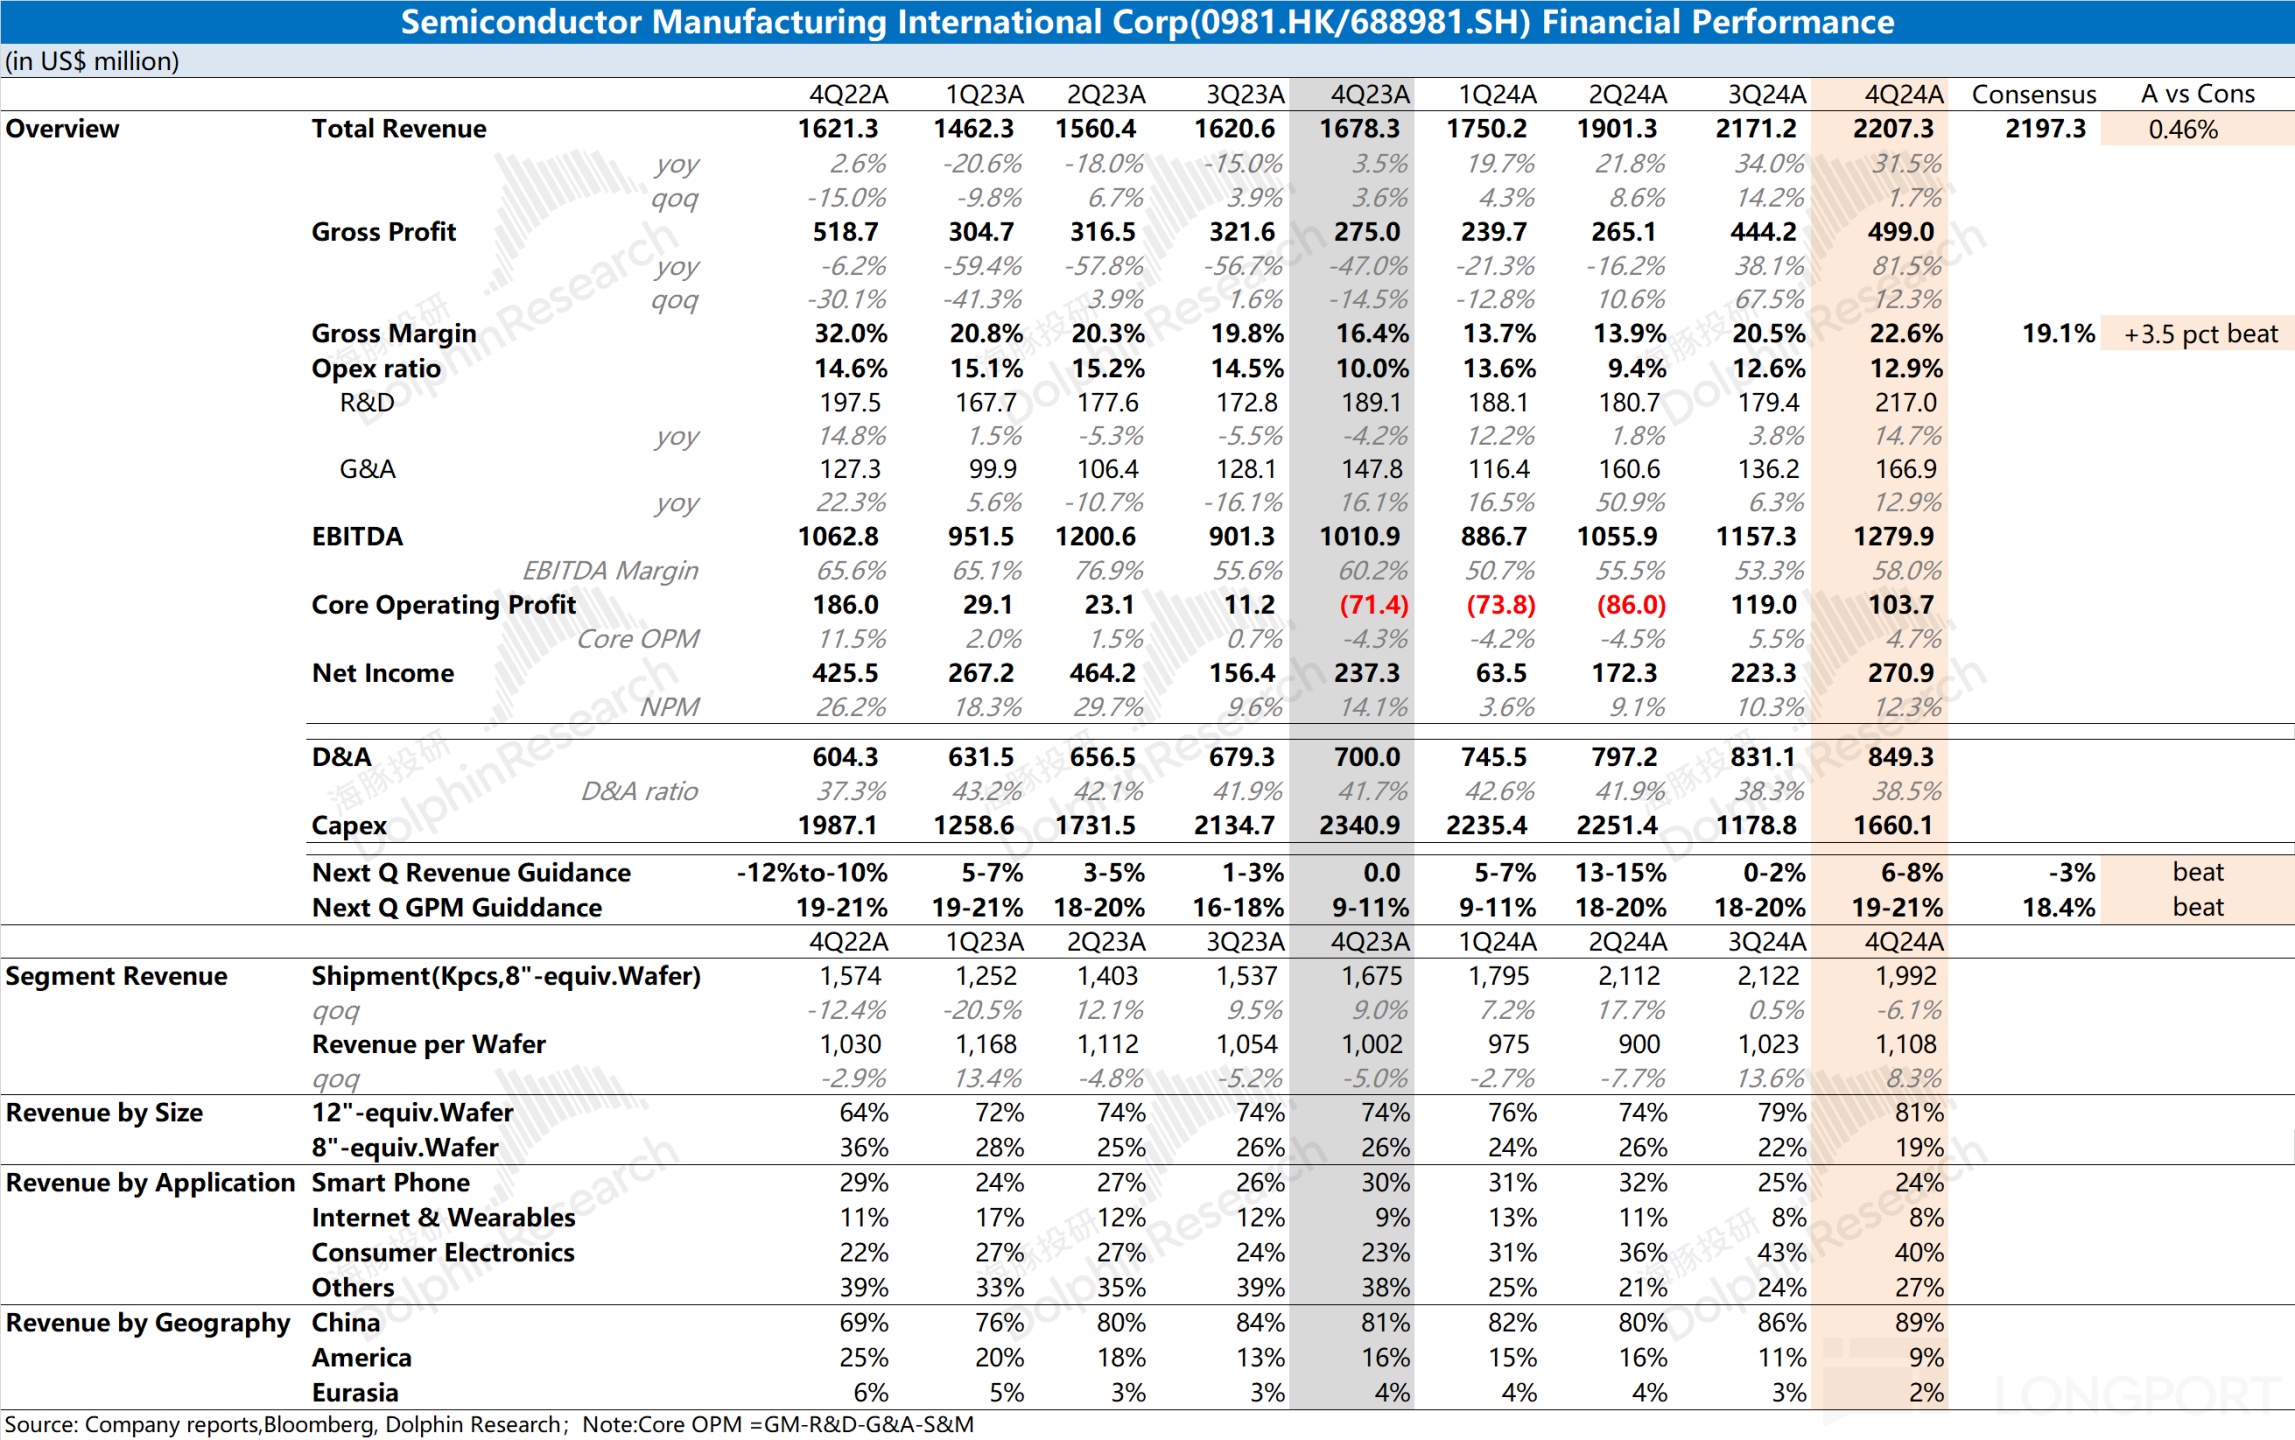
2. $SMIC(688981.SH) Detailed Content of the Financial Report Conference Call
2.1, Executive Team Statement of Core Information: 1. Fourth Quarter Business Operations
Traditionally, the fourth quarter follows seasonal patterns, with relatively low customer willingness to take delivery. However, based on the newly added capacity of 28,000 12-inch wafers this quarter, the average selling price of the product mix increased by 6% quarter-on-quarter, roughly offsetting the impact of declining shipment volume on revenue and the impact of rising depreciation on gross margin. Considering these factors, the company's revenue in the fourth quarter increased by 1.7% quarter-on-quarter, exceeding $2.2 billion, achieving growth for seven consecutive quarters; the gross margin increased by 2.1 percentage points quarter-on-quarter, reaching 22.6%.
2. Full Year Business Operations for 2024
The overall semiconductor market is showing signs of recovery in 2024, with design companies generally returning to healthy levels. The company is well-prepared, with accelerated capacity expansion, and new products from domestic customers being rapidly validated and ramped up. Therefore, quarterly revenue is expected to continue to rise in 2024, with annual revenue growth exceeding initial expectations.
By region, revenue from China, the United States, and the Eurasian region accounted for 85%, 12%, and 3%, respectively. Among them, due to supply chain restructuring and increased market share of customers, benefiting from localized manufacturing demand, revenue from Chinese customers increased by 34% year-on-year.
By size, revenue from 12-inch and 8-inch wafers both increased, accounting for 77% and 23%, respectively. Revenue from 12-inch wafers increased by 35% year-on-year, mainly attributed to the expansion of capacity and the relatively rapid validation and production of new capacity.
By application, wafer revenue from smartphones, computers and tablets, consumer electronics, IoT, industrial, and automotive accounted for 28%, 16%, 38%, 10%, and 8%, respectively, mainly due to the aforementioned factors and national consumption stimulus policies. Revenue from consumer electronics, smartphones, and other applications saw significant year-on-year growth.
By product platform, revenue from advantageous technology platforms such as analog BCD, CIS, and display driver ICs continued to grow. In 2024, multiple technology platforms' processes, iterations, and product performance upgrades were rapidly implemented.
In the field of analog devices, the company continues to rapidly expand high-voltage, high-current, high-performance, and high-reliability 8-inch and 12-inch technology platforms, quickly applied to various end markets, including consumer electronics, industrial control, automotive electronics, and new energy.
In the high-voltage display driver integrated circuit field, the company continues to push 28-nanometer high VC mode technology (related to display panel products) into mass production and end-market applications, achieving ultra-low power consumption and performance improvements. Customer demand continues to grow, exceeding the company's capacity.
In the DIF and ISP fields, the company provides higher resolution, smaller pixel sizes, and higher density CIS products, and quickly launches image signal processor solutions with better performance and lower power consumption.
Additionally, the company will continue to launch high-performance, high-quality, and high-reliability automotive electronic products and technical services to meet the needs of IC customers and automotive original equipment manufacturers.
High-voltage, high-current, and high-reliability BCD platforms, ultra-low power logic platforms, high-performance e-Flash automotive-grade platforms, automotive-grade high-voltage CMOS platforms, and high-reliability memory platforms have all been certified, achieved mass production, and applied to end markets The company's capital expenditure for 2024 is $7.33 billion. By the end of the year, the monthly production capacity is 948,000 standard logic 8-inch equivalent wafers. The total shipment volume exceeds 8 million pieces, with an annualized capacity utilization rate of 85.6%.
3. Future Outlook
Currently, the inventory of customer products is relatively healthy. Based on extensive communication with industry chain partners, they generally believe that apart from the demand in the artificial intelligence sector, which is expected to continue to grow rapidly in 2025, the market demand in other sectors will remain flat or grow moderately.
Recently, there have been two phenomena in the industry. First, the domestic supply chain restructuring in the automotive industry and other sectors has moved from the validation stage to the ramp-up stage, with some products officially entering mass production. Second, driven by national consumption stimulus policies, customers' willingness to restock is relatively high, and the company has more restocking orders and expedited orders in consumption, connectivity, and mobile phone sectors.
Overall, the first quarter represents a traditional seasonal upward trend. However, at the same time, the external environment brings a certain degree of uncertainty for the second half of this year, and industry competition is intensifying. The company will overcome difficulties and strive to do its best. In the face of challenges and opportunities, the company is committed to making Semiconductor Manufacturing International Corporation (SMIC) stronger and larger, continuing to expand capacity, supporting customers in market expansion, and focusing on quality and efficiency. Considering the above factors, the company's performance guidance for the first quarter is: revenue is expected to grow by 6%-8% quarter-on-quarter, and gross margin is expected to be between 19%-21%. Based on the commitment that there are no significant changes in the external environment, the company's performance guidance for 2025 is: revenue growth is expected to exceed the industry average in the same market; capital expenditure is expected to be flat compared to the previous year.
For 2025, first, in recent years, geopolitical factors have changed the industry landscape. This has brought higher depreciation pressure on gross margins. It is expected that the depreciation of the RMB will reach about 20% by 2025. In addition to depreciation, gross margins are also affected by factors such as pricing and utilization rates. The company will always aim for sustainable profitability by improving depreciation utilization rates and enriching the product portfolio to combat cyclicality.
Secondly, domestic production has led to an increase in market demand, but in the context of market recovery, homogeneous competition has resulted in fierce competition for structurally excessive production capacity. The company maintains a consistent pricing strategy, follows market prices, and does not lower prices. However, when necessary, the company will engage in price competition directly with strategic customers.
2.2 Q&A:
Q: ASP increased by 6% quarter-on-quarter, higher than the performance of peers in Taiwan. What is the reason? What is the trend for Q1 2025 and the whole year?
A:
(1) Reasons for the increase:
Product size changes: In the fourth quarter, the number of 12-inch wafers increased while 8-inch wafers decreased. Since the area of a 12-inch wafer is equivalent to 2.5 times that of an 8-inch wafer, its relative layer count is lower, and the ASP is lower. The increase in the proportion of 12-inch wafers drives the overall ASP up.
Differences in product types: The lower-priced products in Q4 decreased, and the shipments were mostly differentiated and customized products, which are priced higher. This is common when utilization rates decline; when the factory is fuller, prices may drop. When the production line is not full, the shipped products tend to be relatively higher in price, which is a paradoxical phenomenon in the industry (2) 2025 Outlook
Currently, there are many orders, the reasons are as follows:
- International Policy Factors: Future international policy instability prompts everyone to transport goods to the place of use in advance to avoid impacts from subsequent international changes such as taxes, leading to early demand for local inventory.
- Incentive Policies in the Chinese Market: There are incentive policies for electric bicycles, 3C products, etc. For example, in the fourth quarter of last year, a certain province's mobile phone incentive policy led to a 15% - 20% increase in domestic brand sales for that quarter. Customers expect this policy to drive recent sales, prompting them to stock up in advance to seize opportunities and market share.
First Quarter and First Half Situation
- Capacity Utilization Rate and ASP Changes: In the first quarter, SMIC's capacity utilization rate increased, but a large number of urgent orders filled the 8-inch capacity. With the same shipment ratio, the increase in 8-inch production led to a decline in the weighted average ASP. Additionally, SMIC's capacity is growing quarter by quarter to quickly ramp up factory output, attracting more orders, including some low-priced products, resulting in an overall downward trend in ASP for the first quarter and the entire year, though the decline is not significant.
- Concerns for the Second Half: There are two concerns: first, the inventory buildup in the first half may lead to a lack of orders in the second half; second, continued production in the second half may lead to capacity accumulation, and industry peers may engage in more aggressive bidding for orders. The combination of these two factors makes the price trend in the second half unclear, but it is certain that prices will not rise and will show a downward trend.
- Countermeasures: The company is responding from three angles: first, faster technology updates and better performance; second, binding strategic development with customers; third, launching complete platform integrity when releasing capacity, incorporating new platforms and technologies, aiming to convert capacity growth into product and platform incremental growth, hoping to reduce price fluctuations.
Q: Is the Capex for the year before last and last year similar, and is the capacity release rhythm for 2025 aligned with the year before last or last year?
A:
Capacity Expansion and Development Planning
1. Planned Capacity Expansion for 2025: The plan has been set, with fixed asset investment basically on par with last year, approximately $7.5 billion. Capacity construction is based on binding agreements with customers and long-term cooperation intentions, with no speculative capacity. SMIC pursues a long-term steady linear growth model and will not significantly adjust its development rhythm due to industry booms or downturns. Each year, it aims to increase capacity by about the equivalent of a 50,000 wafer 12-inch factory. The 8-inch capacity is a diversified product platform developed jointly with customers. The focus for 8-inch capacity is on improving performance, quality, and efficiency, with no plans to increase equipment.
2. Equipment Arrival Time and Related Situations: The timing of equipment procurement is influenced by many factors and cannot be fully controlled, but based on arrangements and supply chain cooperation over the past few years, the goals can generally be achieved. For instance, the capex of $7.5 billion was achieved the year before last, and $7.33 billion last year, so a similar development situation is expected this year.
Q: If the automotive sector is to take on 1/3 of the capacity, what capacity is needed to meet customer demand? A:
Automotive Business Related Situation
- Product and Capacity Undertaking: The most needed products in the automotive field are high-reliability components, such as those in the third-generation semiconductor fields like GaN or SiC. Semiconductor Manufacturing International Corporation (SMIC) has established relevant platforms and closely cooperates with automotive industry chain product companies, and will become a major supplier in the next two to three years. SMIC does not have factories dedicated solely to automotive products, but rather optimizes equipment and capacity across various factories, managing different quality management systems. After validating each product line to industrial and automotive grades, capacity is allocated within the same factory, with the better parts made into automotive products and the rest into industrial and consumer products. This approach has gained customer trust and cooperation.
- Revenue Proportion and Development Plan: In the fourth quarter of last year, the automotive and industrial segments accounted for 8%-10% of revenue. The initial plan is to work with end customers of complete vehicles to increase the proportion of automotive products in SMIC's revenue to 10%. Since the volume of automotive products is less compared to mobile phones and consumer products, achieving a significant revenue share is not immediate. The current plan is to first validate consumer products on the platform, then upgrade to industrial products, and it will take until the third year to fully validate as automotive products. The long-term goal is that as SMIC develops, if 10% of its revenue in the future comes from automotive business, it may account for one-third of the domestic automotive industry's demand.
Q: What competitive advantages does scale growth bring?
A:
Situation After SMIC's Scale Expansion
- Industry Position and Resource Advantage: After expanding its scale, major customers will prioritize choosing SMIC over smaller suppliers due to its large scale and significant position in the industry. Additionally, with more revenue, when allocating the same proportion of funds, SMIC has richer resources to support customers in long-term technology development. If production lines need to be changed or more equipment needs to be purchased, it has more resources to do so.
- Emphasis on Brand Quality and Efficiency: A larger scale means that the losses from losing market share or damaging reputation are greater, so there is a greater focus on the company's brand, quality, and efficiency, aligning more with top-tier customers in the industry. Top-tier customers value long-term cooperation, quality, efficiency, and better commitments for the future. SMIC has now developed from a small scale to a relatively large scale, treating itself as a leading company in the industry, emphasizing strategy, binding, and pursuing quality and efficiency.
28-Nanometer Process Layout and Product Planning
Revenue and Capacity Construction Situation: Currently, in SMIC's mature technologies, revenue from 40-nanometer and 45-nanometer processes is higher than that from 28-nanometer, as capacity is built according to customer requirements. Many new major customers now request to use planar 28-nanometer for original 40-nanometer designs, so SMIC is accelerating the construction of 28-nanometer capacity and platform. Its product platform and IP layout for 40-nanometer are very comprehensive, covering eight major categories of products, each with different applications, such as low power consumption and automotive grade.
Specific Product Planning for 28-Nanometer:
Products with Certain Challenges: For example, transitioning MCUs from 40-nanometer to 28-nanometer is not easy, as the number of layers increases significantly when using 40-nanometer SST for 28-nanometer. However, MCUs still need to be developed at 28-nanometer, requiring new platforms like RAM, and although SSDs are complex, they can support high-end automotive applications, while externally they may only be used for industrial and civilian purposes
Mainstream Products and Sequence: The sequence of 28-nanometer mainstream products is to first produce standard logic, then ultra-low power logic, followed by radio frequency for networking, then add analog circuits to cover connectivity (IoT product connection chips), and finally add high voltage, namely RCD driver (clock driving chips). Ultra-low power is used for CMOS processors (visual processing chips), and there will also be 28-nanometer SOI and 40-nanometer SOI. SMIC's 40-nanometer also has memory such as Nor Flash, while 28-nanometer will no longer produce Nor Flash, but there are high-quality Nor Flash as special dedicated memory.
Quality and Product Layout Advancement: In terms of quality, 28-nanometer will first produce consumer-grade, then industrial-grade, and finally automotive-grade; in terms of products, it will first produce standard logic links, then ultra-low power, followed by networking RF, high voltage drive, MCU, etc., while also customizing various IP and applications to enhance competitiveness.
Advantages and Disadvantages of Capacity Construction: SMIC's 28-nanometer capacity construction is relatively late, with the advantage being that the construction equipment is more advanced and control is more precise, while the disadvantage is that the entry time is late, and it will work with customers to develop the market.
Q: After capacity expansion, there is significant depreciation pressure, with an increase of over 20% in 2024, but gross profit only decreases by 1%. What is the reason?
A:
SMIC's Capacity Expansion and Related Situation
Capacity Expansion and Depreciation Situation: SMIC has been continuously expanding capacity in recent years, with significant Capex investment. In 2024, depreciation is expected to increase by approximately $550 million, an increase of over 20%, which puts significant pressure on gross profit margin.
Countermeasures and Effects:
(1) Capacity Expansion and Utilization Rate Improvement: Domestic customers quickly validate and ramp up new products, driving the company's capacity utilization rate to improve, thus offsetting the impact of increased depreciation on gross profit margin.
(2) Cost Reduction Plan: At the beginning of the year, the company internally formulated a cost reduction plan, setting cash cost reduction targets for each factory.
Regarding Capacity Construction, Customer Cooperation, and Gross Profit Margin Impact
(1) Capacity Construction and Customer Demand: The capacity constructed by SMIC was strategically cooperated with customers before establishment, based on existing customer demand, so it will not be left idle after completion.
(2) Product Pricing and Capacity Utilization Rate: New product pricing is not about seeking low-priced orders when capacity is completed and idle, but rather under the original planning, the new capacity utilization rate is high.
(3) Scale Expansion and Gross Profit Impact: As the scale expands, the effects of cost reduction and efficiency improvement are reflected, and after adding so much depreciation, the impact on gross profit margin is not that significant.
Q: What is the increase in depreciation? Will the gross profit level be maintained in 2025?
A:
Capex expenditure in 2025 is expected to be basically the same as in 2024, with depreciation expected to increase by about 20% in 2025, and it will increase quarterly. In 2025, the increase in depreciation will still put significant pressure on gross margins. The company will support ASP and capacity utilization through continuous iterations of new technologies, continuing to reduce costs and improve efficiency to enhance gross margins.
Q: Assessment of the impact of consumer stimulus policies? Has it caused demand to be brought forward? Sustainability? Are there any signs of weakening? Turning point?
A:
Impact of stimulus policies and related situations
- Effects of existing stimulus policies: The stimulus policy for large-screen televisions in September-October last year had a significant effect, with external data showing local sales volume increasing by over 20%. Panel manufacturers and companies producing display drivers quickly consumed inventory. In Q4 and currently, they are replenishing large-screen TV orders, but the sustainability of this effect remains to be observed, although it will generate a growth of 15%-20% in the current season.
- Expectations for stimulus policies on other products and inventory situation: If the same 15%-20% growth is applied to smartphones, tablets, PCs, and electric bicycles, the company is currently negotiating with customers to increase inventory. If the growth truly reaches 20%, the existing inventory may not be sufficient. SMIC's 8-inch wafer orders have reached full capacity, but the overall forecast will not remain at full capacity forever, especially for the 8-inch single node. Originally, the utilization rate was about 80% for 8 inches, and now full capacity indicates that the new order volume has increased by over 20%.
Changes in orders and capacity utilization
- Current order and delivery situation: Customers are currently planning to produce products needed in the second half of this year as early as possible for their destinations, on one hand to respond to changes in the international situation and avoid tariff and transportation risks; on the other hand, they are betting on government stimulus policies driving 15%-20% growth, ensuring they have enough goods to seize opportunities. These two factors combined have resulted in good utilization rates in the first and second quarters.
- Annual forecast and turning point situation: The annual forecast has not increased significantly, equivalent to sales and inventory in the second half being pulled into the first half. It is quite clear that the changes in order capacity profit margins should be observed in August.
Q: Have the annual double-digit shipment growth and single-digit sales growth forecast numbers been adjusted?
A:
First quarter growth and subsequent situation
- First quarter growth situation: Q1 2025 saw a year-on-year growth of over 30% compared to Q1 2024.
- Subsequent quarters and annual situation: If the current situation continues, it will quickly extend into the second quarter, but the situation in the second half needs time to confirm. For the entire year, it can only be said that the company has some conditions that others do not possess, such as potentially benefiting from industry chain shifts and domestic government stimulus bonuses, so its growth exceeds the comparable average for the same period.
Uncertainties faced and observation points
- Uncertainty factors: Currently, there is uncertainty regarding the extent of changes in international geopolitical policies, how long customer order pull-through can last, and when the government stimulus policy benefits will end.
- Observation time and content: More answers to related questions will be available in May, requiring observation over one or two months to determine certain situations, such as whether there will be a scenario like last year's fourth quarter where a province implemented a mobile phone subsidy pilot, resulting in a 15%-20% increase in sales. If subsidies are implemented nationwide, will there be a 15%-20% increase across the country? Both the company and customers need this data to decide on inventory establishment and other situations Risk Disclosure and Disclaimer of this Article: Dolphin Investment Research Disclaimer and General Disclosure


The copyright of this article belongs to the original author/organization.
The views expressed herein are solely those of the author and do not reflect the stance of the platform. The content is intended for investment reference purposes only and shall not be considered as investment advice. Please contact us if you have any questions or suggestions regarding the content services provided by the platform.