
In-depth comparative analysis of the 22x PE valuation of the three giants of Hang Seng Tech: Tencent, Alibaba, and Xiaomi

I. Market Background and Rationality Analysis of 22x P/E Valuation
1.1 Current Valuation Status of the Three Companies
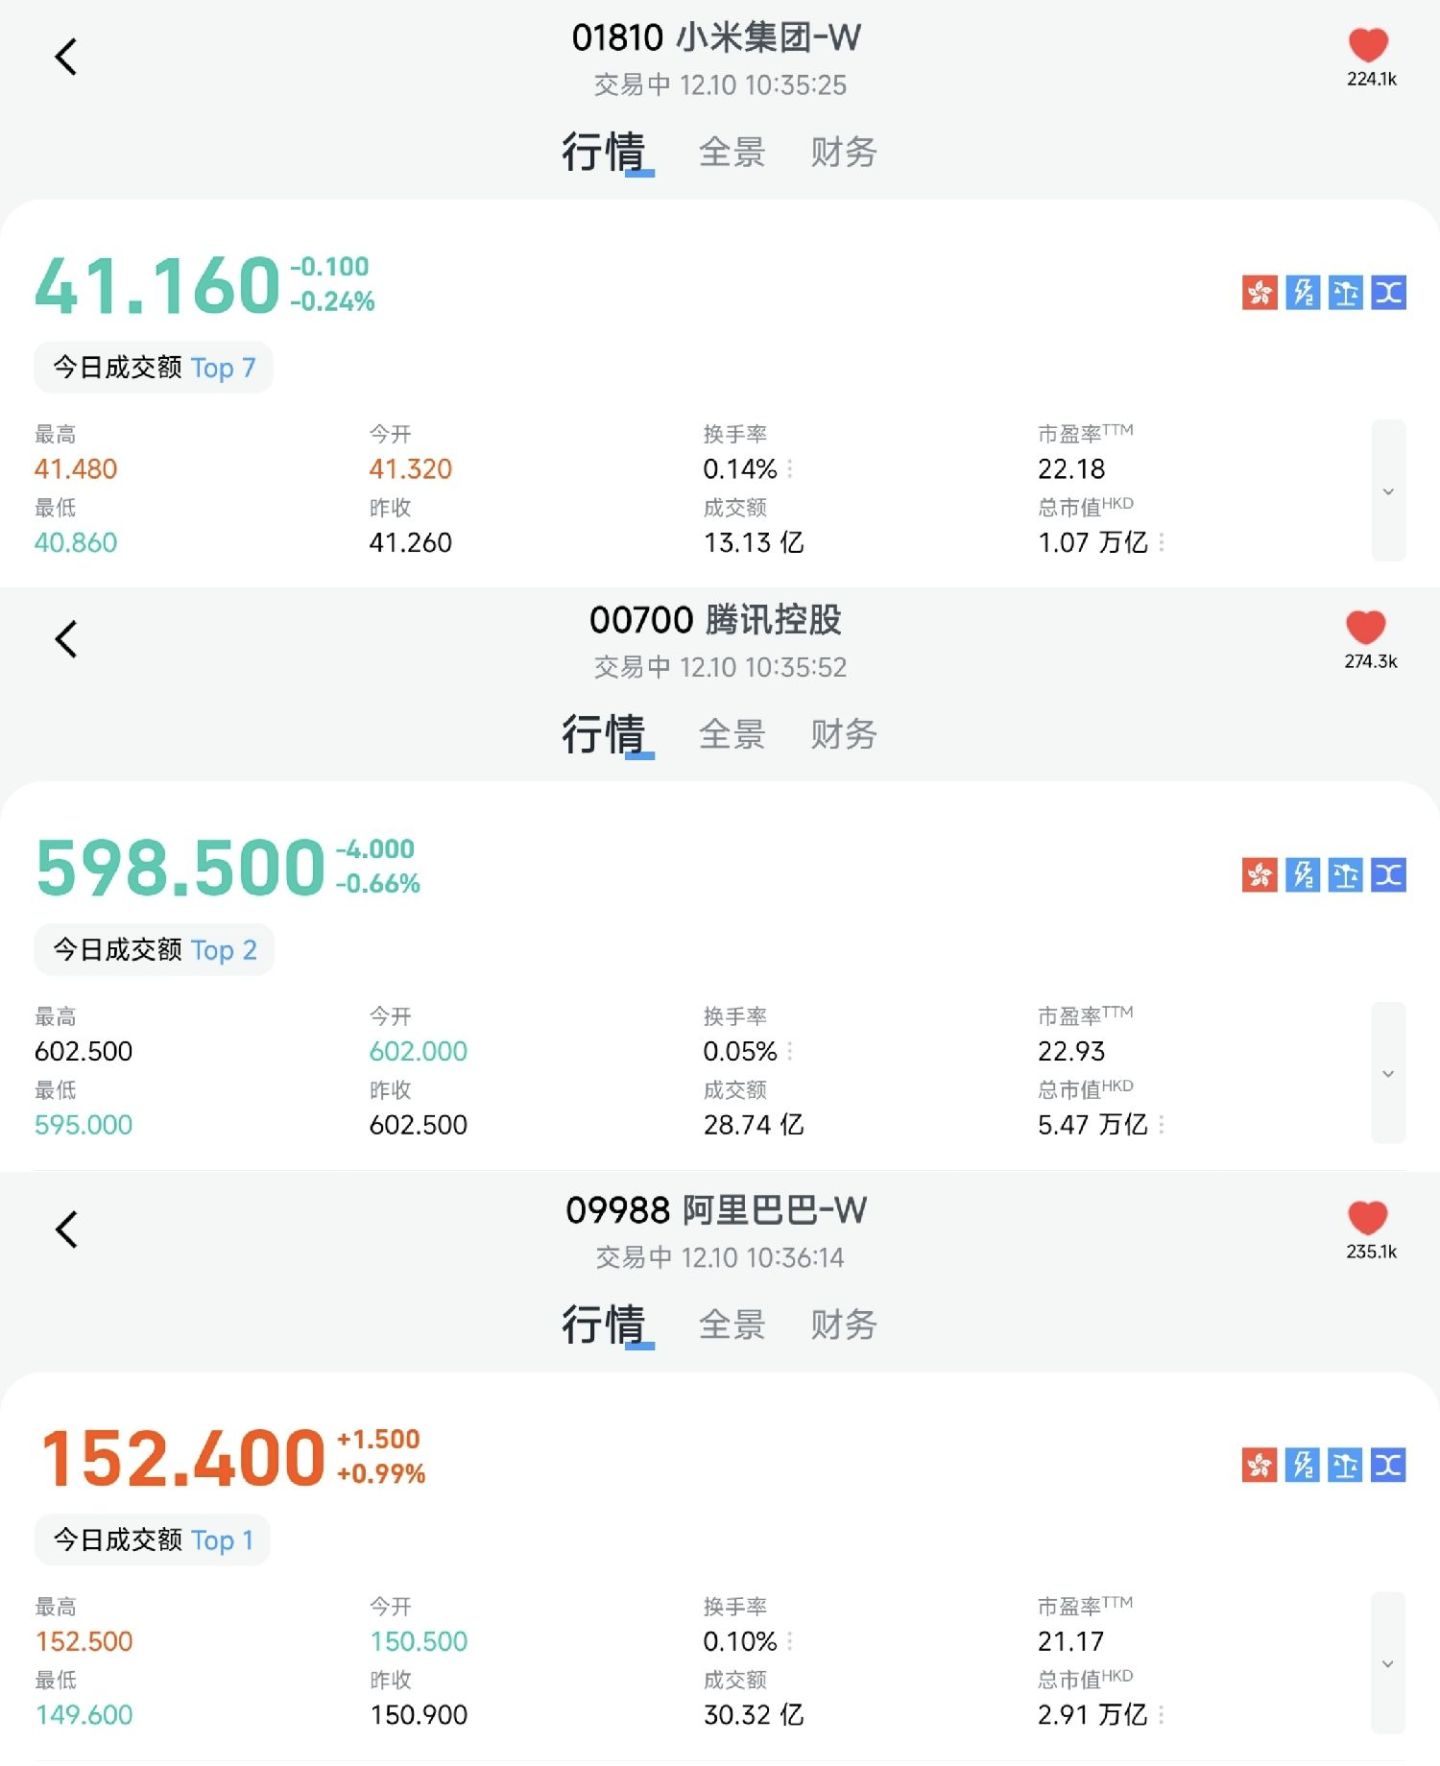
As of December 10, 2025, the latest valuation data of the three giants of the Hang Seng Tech Index show significant divergence. Tencent Holdings (00700.HK) has a stock price of approximately HK$599-600, with a total share capital of 9.145 billion shares, corresponding to a market capitalization of approximately HK$5.48 trillion (about RMB 5.04 trillion) and a TTM P/E ratio of about 23.9x. Alibaba (09988.HK) has a stock price of HK$152.2, a market capitalization of approximately HK$2.91 trillion, and a TTM P/E ratio of about 21.59x. Xiaomi Group (01810.HK) has a stock price of HK$41.06, a market capitalization of approximately HK$1.07 trillion, and a TTM P/E ratio of about 22.70x.
From the perspective of historical valuation ranges, all three companies are at relatively reasonable and slightly low levels. Tencent's historical P/E range is 10-40x, and its current 23.9x is slightly below the five-year median P/E of about 25x. Alibaba's historical P/E range is 9.45-195.76x, with an average of about 20.91x, and its current 21.59x is slightly above the historical average. Xiaomi's historical P/E range has fluctuated significantly, from a low of about 8.5x in 2022 to a high of 50.81x in February 2025, with its current 22.70x at a relatively reasonable level.
1.2 Historical Valuation Comparison and Percentile Analysis
From the perspective of historical valuation percentiles, the overall valuation of the Hang Seng Tech Index is at a historically low level. As of December 3, 2025, the Hang Seng Tech Index's TTM P/E is about 23.32x, at the 33.33% percentile over the past 10 years, meaning that only 33% of the time in the past decade has it been cheaper than now. Some data show that the P/E of the CSI Hong Kong Stock Connect Tech Index is only 22x, at the 13.37% percentile over the past five years, with valuations higher than the current level 86.63% of the time historically.
For the three companies, Tencent's current valuation is in a reasonable and slightly low range, with the market giving it a 40x valuation at its peak in 2021 and only about 10x during the trough in 2022. Alibaba's valuation level is relatively stable, with its current P/E slightly above the historical average but still within a reasonable range. Xiaomi's valuation has fluctuated significantly, dropping from a peak market capitalization of HK$1.3 trillion in February 2025 to the current HK$1.21 trillion, with its P/E falling from 43x to 30x, returning to the level of Q4 2024.
1.3 Peer Valuation and the Rationality of 22x P/E
Compared with international tech giants, the three Hang Seng Tech giants have a clear valuation advantage. Among the "Magnificent Seven" U.S. tech stocks, Google has a TTM P/E of about 29.6x, Amazon about 34.5x, and Meta about 32.5x. In contrast, Tencent's 23.9x, Alibaba's 21.59x, and Xiaomi's 22.70x valuations are significantly lower.
From the perspective of PEG (price/earnings to growth ratio), Tencent's expected net profit growth in 2025 is about 15-20%, corresponding to a PEG of about 1.2-1.6, which is at a reasonable level. Driven by its AI business, Alibaba's cloud revenue grew 34%, with AI-related product revenue growing at triple-digit rates for nine consecutive quarters, leaving significant room for PEG optimization. Xiaomi, driven by its automotive business, saw revenue grow 22.3% in Q3 2025 and adjusted net profit grow 80.9%, with a PEG significantly below 1, indicating high investment value.
As a neutral valuation level, 22x P/E has different implications for different companies. For a steady-growth company like Tencent, 22x P/E is slightly below the current level, providing a certain margin of safety. For Alibaba, 22x P/E is close to its historical average, and considering the growth potential of its AI transformation, there is room for valuation recovery. For Xiaomi, 22x P/E is a reasonable level after a significant correction, reflecting the market's rational expectations for its automotive business.
II. Tencent Holdings: Steady Growth Under Ecosystem Advantages
2.1 Analysis of Core Business Segments
Tencent's business model is centered on its social ecosystem, monetized through three main business lines: value-added services, advertising, and fintech & business services. In Q3 2025, their respective contributions were: value-added services 49.7%, advertising 18.7%, and fintech & business services 30.2%.
As the largest revenue source, value-added services generated revenue of RMB 95.86 billion in Q3 2025, up 16% YoY. The gaming business performed particularly well, with domestic gaming revenue at RMB 42.8 billion, up 15% YoY, and international gaming revenue at RMB 20.8 billion, surging 43% YoY, breaking the RMB 20 billion mark for the first time. Core products "Delta Force" ranked among the top three in industry revenue, with daily active users (DAU) exceeding 30 million in September; "Honor of Kings" reached 139 million DAU during its 10th-anniversary event. Social network revenue was RMB 32.3 billion, up 5% YoY, mainly due to growth in video account live streaming, music paid memberships, and mini-game platform service fees.
Advertising services grew strongly, with Q3 2025 revenue of RMB 36.24 billion, up 21% YoY, marking 12 consecutive quarters of double-digit growth, outpacing the industry. Growth was driven by ad tech upgrades and ecosystem traffic release, with increased ad load on video accounts, mini-programs, and WeChat Search, as well as enhanced user engagement. Tencent upgraded its ad tech with the AIM+ automated ad placement solution, automating targeting, bidding, placement, and creative optimization to improve advertiser ROI.
Fintech and business services grew steadily, with Q3 2025 revenue of RMB 58.17 billion, up 10% YoY. Fintech benefited from offline consumption recovery, with stable growth in payment services; cloud services grew despite GPU supply chain constraints, driven by rising demand for enterprise AI services. WeCom introduced an AI summary feature that generates project summaries and suggestions based on emails and conversations, improving collaboration efficiency.
2.2 Profit Quality and Financial Health
Tencent demonstrated excellent profit quality and financial health. In Q3 2025, the company achieved total operating revenue of RMB 192.869 billion, up 15% YoY, exceeding market expectations of RMB 188.8 billion; Non-IFRS net profit was RMB 70.6 billion, up 18% YoY, both surpassing expectations.
In terms of profitability metrics, Tencent maintained high gross margins: 60% for value-added services (up 3 percentage points), 56% for advertising (up 1 percentage point), and about 40% for fintech & business services. The net margin stabilized at around 25%, reflecting the company's strong cost control and pricing power.
Cash flow was particularly strong. In Q3 2025, Tencent's operating cash flow reached RMB 85.3 billion, up 19% YoY; free cash flow was RMB 58.5 billion, flat YoY. The ratio of operating cash flow to net profit was 135%, indicating high profit quality. Cash and cash equivalents totaled RMB 493.3 billion, with net cash of RMB 102.4 billion, providing a solid foundation for AI investments and shareholder returns.
Capital expenditures in Q3 2025 were RMB 20 billion, mainly supporting AI initiatives, partially offsetting operating cash flow. Continued investments in AI, particularly breakthroughs in the Hunyuan large model, provide technological support for future growth.
2.3 Competitive Advantages and Growth Drivers
Tencent's core competitive advantages are reflected in four areas:
Monopoly in social ecosystems. Combined MAU of WeChat and WeChat reached 1.44 billion, up 25% YoY, building strong user stickiness and network effects. Video accounts, as a new growth engine, saw continuous DAU growth, with ad load increasing from low single digits to mid-single digits, leaving significant room for future growth.
Dual-engine gaming business. Domestic gaming revenue grew steadily, while international gaming revenue grew rapidly, with overseas revenue share rising to 23%. The company expanded its game IP library through acquisitions and in-house development, enhancing global competitiveness.
Commercialization progress in AI. The Hunyuan large model improved in complex reasoning (coding, math, science), with its image generation model ranking first globally in LM Arena's text-to-image benchmark, and its 3D generation model leading in key scenarios. AI is already applied in ad targeting, game NPC generation, and other scenarios, with the Hunyuan 3D generation model ranking first globally.
Strong shareholder return mechanism. Tencent plans to return no less than HK$80 billion to shareholders through share repurchases in 2025 and raised its annual cash dividend by 32% to about HK$41 billion, with total shareholder returns expected to exceed HK$121 billion in 2025. The company has repurchased shares for 29 consecutive days, totaling HK$56 billion, reducing its total shares outstanding to the lowest in nearly a decade, down over 400 million shares from the end of 2021.
III. Alibaba: Valuation Reshaping Opportunity in AI Transformation
3.1 E-Commerce Foundation and Dual Engines of Cloud Computing
Alibaba is undergoing a strategic transformation from traditional e-commerce to an AI tech company, forming a dual-engine business structure of e-commerce and cloud computing. In Q3 2025, China Commerce Group revenue was RMB 132.6 billion, up 15.5% YoY, with customer management (CMR) revenue up 10% YoY.
E-commerce showed steady fundamentals. Taobao App's monthly active consumers grew double digits YoY, with 88VIP members exceeding 56 million, also growing double digits, representing the highest-spending consumer group. During Double 11, core categories like beauty and home appliances on Tmall grew over 20% YoY, with average order value up 15%; Taobao Live sales grew 25% YoY, with top streamers setting new GMV records. Instant retail grew rapidly, with Q3 revenue of RMB 22.9 billion, up 60% YoY, daily order volume peaking at 120 million, and monthly active buyers reaching 300 million in August.
Cloud computing became the strongest growth engine. Cloud Intelligence Group revenue in Q3 2025 was RMB 39.8 billion, up 34% YoY, accelerating for eight consecutive quarters. External cloud revenue grew 29%, with AI-related revenue growing triple digits for nine straight quarters. According to Canalys, Alibaba Cloud holds 33% of China's cloud service market, ranking first; Omdia reports Alibaba Cloud leads China's AI cloud market with 35.8% share, exceeding the combined share of the second to fourth players.
International business also performed well. International Digital Commerce Group revenue grew 26% YoY, with platforms like Lazada and AliExpress performing strongly in Southeast Asia and Europe. Cainiao Network turned profitable in Q3 2025, with cross-border logistics efficiency up 30% and costs down 18%.
3.2 AI Strategic Investment and Commercialization Progress
Alibaba's scale and speed of AI investment are remarkable. Over the past four quarters, the company's capital expenditures on AI+cloud infrastructure totaled about RMB 120 billion, focused on building core facilities like AI clusters, servers, and distributed storage. Q3 2025 capital expenditures were RMB 31.501 billion, up 80.1% YoY.
In AI breakthroughs and product launches, Alibaba Cloud's Tongyi Qianwen team released an early preview of Qwen3-Max, achieving 100% accuracy in high-difficulty math reasoning benchmarks like AIME25 and HMMT25. As of November 2025, over 90,000 derivative models based on the Qwen family were developed on Hugging Face, with over 400 million global downloads. The Qianwen App launched public beta on November 17, 2025, adopting a "free use" strategy, surpassing 1 million users within two hours.
In commercialization, AI-related product revenue grew triple digits for nine straight quarters, becoming a key driver of cloud growth. The company partnered with global firms like NBA, Marriott, China UnionPay, and Bosch, while building new data centers in Brazil, France, and the Netherlands, accelerating global expansion. The September 2025 Apsara Conference showcased full-stack AI upgrades, with Qwen family derivatives on Hugging Face exceeding 180,000 (double the second-place).
Future investment plans are more aggressive. Alibaba previously announced plans to invest RMB 380 billion in AI+cloud infrastructure over three years, with about RMB 120 billion spent in the past four quarters, already one-third of the total plan. Management stated, "RMB 380 billion is still too low," and may increase investment further if demand remains strong.
3.3 Regulatory Risks and Business Challenges
Despite smooth progress in AI transformation, Alibaba faces multiple regulatory risks and business challenges.
Ongoing antitrust pressure. On November 15, 2025, the State Administration for Market Regulation released draft anti-monopoly compliance guidelines, potentially increasing compliance costs and business constraints. The Supreme Court's final ruling found that Alibaba, Taobao, and Tmall abused their dominant position in China's online retail platform services market by imposing "unreasonable transaction conditions," requiring them to jointly compensate users RMB 10,000 for 维权 expenses.
Heightened international regulatory risks. In November 2025, the U.S. Pentagon announced it was considering adding Alibaba to a list of companies assisting the Chinese military, which could reduce international investor risk appetite. The EU announced the cancellation of small parcel tax exemptions, effective early 2026, potentially raising logistics costs by 20-30%, impacting Alibaba's international performance.
Business integration and profit pressure. The company completed the integration of Taotian, Ele.me, and Fliggy into China Commerce Group in June 2025, now in a post-integration adjustment phase. Instant retail, while growing rapidly, remains loss-making, with China Commerce Group's adjusted EBITA at RMB 10.497 billion in Q3, down 76% YoY, mainly due to heavy losses in Taobao Flash. However, management stated that per-order losses have halved from July-August levels, with investments expected to shrink significantly next quarter.
AI computing supply challenges. Reliance on imported high-end GPUs could impact AI profitability if supply is constrained. However, Alibaba has built training clusters in Singapore and the Middle East to partially mitigate this risk. In 2025, the Ministry of Industry and Information Technology required Alibaba, Tencent, and others to explain continued purchases of Nvidia H20 chips and set a 40% domestic chip substitution target for 2026.
IV. Xiaomi Group: High-Growth Story Driven by Automotive Business
4.1 "Smartphone × AIoT × Automotive" Ecosystem Layout
Xiaomi has built a unique "Smartphone × AIoT × Automotive" human-vehicle-home ecosystem, with synergistic development across three business segments, creating differentiated competitive advantages.
Smartphone business maintained steady growth. In Q3 2025, Xiaomi shipped 43.3 million smartphones globally, up 0.5% YoY, ranking third worldwide; China shipments were 10 million. Premiumization strategies showed results, with the Xiaomi 17 series Pro/Pro Max accounting for over 80% of initial sales, and share in the RMB 6,000+ premium segment rising to 12%. Overseas performance was particularly strong, with 23.4% market share in Europe, surpassing Apple for the first time; India and Middle East-Africa markets continued to lead.
AIoT and lifestyle products saw structural upgrades. Q3 2025 revenue was RMB 27.6 billion, up 5.6% YoY, with gross margin up 1.4 percentage points to 23.9%. Smart AC shipments exceeded 5.4 million, with refrigerators and washing machines growing over 25%, making major appliances a core growth driver. HyperOS-powered IoT devices surpassed 800 million, enabling cross-device connectivity between AIoT, smartphones, and cars, gradually realizing the "human-vehicle-home" scenario experience.
Smart EV business was the highlight. Q3 2025 revenue was RMB 29 billion, up over 199% YoY, including RMB 28.3 billion from smart EVs and RMB 700 million from related services. Deliveries reached 109,000 in Q3, up 34.6% QoQ, with SU7 series sales double Tesla's Model 3, and the YU7 quickly rising to the top of SUV sales charts after launch, with October retail sales reaching 33,000.
4.2 Automotive Progress and Capacity Challenges
Xiaomi's automotive business achieved a major breakthrough in 2025, turning profitable for the first time in a single quarter. In Q3 2025, Xiaomi's automotive and AI innovation segment reported its first quarterly operating profit of RMB 700 million, with gross margin reaching 25.5%, up 8.4 percentage points YoY.
Product performance exceeded expectations. The YU7 received 240,000 locked orders within 18 hours of launch, an industry record, with ASP rising to RMB 260,000, driving near-2x revenue growth. The company raised its full-year delivery target to 350,000, showing confidence in production ramp-up.
Capacity building faces challenges. Despite the Phase II Yizhuang plant starting production in July 2025, raising annual capacity to 300,000, actual delivery efficiency fell far short of expectations due to delays in Nvidia Thor chip mass production and battery safety controversies. The Phase I plant's designed annual capacity is 150,000, with full two-shift operations maxing out monthly capacity at 24,000 (annualized ~280,000), nearing equipment limits. Phase II, while operational, requires time for equipment debugging and worker training, with monthly capacity expected to reach 30,000 only in Q4.
Supply chain pressures. Under the plan, Phase II's 2025 available capacity is only 60,000 (based on half-year ramp-up), meaning YU7 would need capacity utilization exceeding 166% to contribute over 100,000 units. Xiaomi's "investment + incubation" model has engaged over 100 suppliers, but SUV parts complexity is higher than sedans, exponentially increasing supply chain coordination difficulty. The SU7 order backlog still exceeds 100,000, and if YU7 demand surges, Xiaomi could face a "two-front" capacity allocation dilemma.
4.3 High Growth and Valuation Elasticity
Xiaomi demonstrated strong growth and profitability improvement. In Q3 2025, total revenue was RMB 113.1 billion, up 22.3% YoY; adjusted net profit hit a record RMB 11.3 billion, surging 80.9% YoY, with net margin exceeding 10%.
Profit quality improved significantly. Group gross margin rose to 22.7%, with smart EVs at 25.5%, internet services at 75%, and IoT at 23.5%, forming a "high-margin + growth" profit mix. Internet revenue was RMB 9.4 billion, up 10.8% YoY, maintaining a high 76.9% gross margin.
R&D investment increased. The 2025 R&D budget is RMB 30 billion, with a quarter allocated to AI, supporting HyperOS 底层重构, multimodal large models, and automotive tech 迭代, leading the industry in R&D intensity. SG&A ratio fell 1.2 percentage points YoY, reflecting good cost control.
Cash flow remained 稳健. Operating cash flow was RMB 15.6 billion, up 18% YoY, with core business cash generation strong despite automotive capacity investments, providing solid support for long-term R&D and ecosystem expansion.
Valuation elasticity is significant. Xiaomi's current 22.70x P/E reflects post-correction levels and rational expectations for its automotive business. As deliveries scale and profitability improves, Xiaomi could replicate Tesla's growth path, with substantial valuation recovery potential. Morgan Stanley expects Xiaomi's "smartphone + AIoT + internet services" model to mirror Apple's success, valuing this business at 20-25x P/E in 2025.
V. Investment Value Comparison and Allocation Recommendations at 22x P/E
5.1 Valuation Levels and Target Price Calculations
Based on a 22x P/E valuation and the three companies' earnings expectations, we calculate target market caps and share prices.
Tencent Holdings target price calculation:
- 2025 expected net profit: RMB 226.4 billion (consensus)
- 22x P/E implies fair market cap: RMB 4,980.8 billion (~HK$5,414 billion)
- Current market cap: ~HK$5,480 billion
- Target price: ~HK$592 (slightly below current HK$599-600)
Alibaba target price calculation:
- 2025 expected net profit: RMB 150 billion (consensus)
- 22x P/E implies fair market cap: RMB 3,300 billion (~HK$3,587 billion)
- Current market cap: ~HK$2,910 billion
- Target price: ~HK$189 (24% upside from current HK$152.2)
Xiaomi Group target price calculation:
- 2025 expected net profit: RMB 40 billion (consensus)
- 22x P/E implies fair market cap: RMB 880 billion (~HK$956.5 billion)
- Current market cap: ~HK$1,070 billion
- Target price: ~HK$37 (10% downside from current HK$41.06)
Target prices suggest Alibaba has the most valuation recovery potential at 22x P/E, Tencent is fairly valued, and Xiaomi is slightly overvalued.
5.2 Institutional Views and Rating Summary
Major brokerages' latest ratings and targets:
Tencent Holdings:
- CMB International: Raised target to HK$766, kept "Overweight," seeing 2025/26E P/E at 21x/19x, above average +1SD
- Huatai: Raised target to HK$759.47, valuing 2025 at 24.8x P/E, kept "Buy"
- CICC: Kept "Outperform," target HK$700, implying 23x/20x 2025E/26E Non-IFRS P/E, 9.5% upside
- Kaiyuan: Kept "Buy," expects 2025-27 net profit of RMB 226.4/256.2/288.7 billion, current P/E at 23.7/20.9/18.6x
Alibaba:
- Guohai: Kept "Buy," target HK$193, SOTP valuation implies 2027E market cap of RMB 3,345.5 billion
- CICC: Kept "Outperform," target HK$197, SOTP valuing e-commerce at 14x 2027E P/E and cloud at 7x P/S, 25% upside
- JPMorgan: Raised target from $170 to $245, bullish on cloud growth
- Guojin: Initiated "Buy," target HK$192.48, expects 2026-28 adjusted net profit of RMB 107.9/149.4/175.8 billion
Xiaomi Group:
- CICC: Kept "Outperform," target HK$53-70, current 2025/26E adjusted P/E at 27.1x/22.8x, target implies 35.0x/29.4x, 29% upside
- Morgan Stanley: Raised target to HK$62, optimistic case HK$75-85, implying market cap of RMB 1.7-2 trillion
- Puyin: Target HK$75, valuing 2026 smartphone/IoT/internet at 23.0x/27.0x/20.0x P/E and smart EVs at 2.5x P/S, 43% upside
5.3 Risk-Reward Profiles and Allocation Recommendations
Based on risk-reward analysis, we recommend:
Top priority: Alibaba (09988.HK)
Key rationale:
- Largest valuation recovery potential, current ~21.59x P/E below 22x fair level, ~24% upside
- AI+cloud entering payoff phase, cloud revenue up 34%, AI products triple-digit growth for 9 quarters
- International profit improvement, Cainiao profitable, cross-border efficiency gains
- High margin of safety, ample cash, 2.5%+ dividend yield
Risks: Antitrust pressure, instant retail losses, international regulatory risks
Suitable for: Value investors seeking "low valuation + high elasticity," moderate-risk capital
Second priority: Tencent (00700.HK)
Key rationale:
- 22x P/E precisely matches "steady growth" profile, fair valuation
- WeChat ecosystem (video ads + mini-program e-commerce) drives growth, overseas gaming >50%
- Strong shareholder returns, 2025 total returns >HK$121 billion
- High institutional ownership (~30%), best liquidity
Risks: Gaming regulation, AI payoff uncertainty, ad macro sensitivity
Suitable for: Moderate-risk investors, tech "anchor" allocation
Third priority: Xiaomi (01810.HK)
Key rationale:
- 22x P/E reflects "high growth discount," autos are the swing factor
- 350,000 delivery target could drive hardware ecosystem premium
- Rapid profit growth, Q3 adjusted net +80.9%, net margin >10%
- "Smartphone × AIoT × Automotive" synergies emerging
Risks: Auto ramp-up delays, competition, supply chain pressures
Suitable for: High-risk tolerance growth investors
5.4 Investment Strategies Under Different Market Scenarios
Bull case (rising risk appetite, tech rally):
- Allocation: Alibaba 40%, Xiaomi 40%, Tencent 20%
- Logic: High-beta Alibaba/Xiaomi benefit most from AI/auto re-rating
Base case (stable market, stock divergence):
- Allocation: Alibaba 35%, Tencent 35%, Xiaomi 30%
- Logic: Balanced exposure to recovery (Alibaba), steady growth (Tencent), and growth (Xiaomi)
Bear case (market correction, risk-off):
- Allocation: Tencent 50%, Alibaba 35%, Xiaomi 15%
- Logic: Reduce volatile Xiaomi, add defensive Tencent, Alibaba's low valuation provides safety
VI. Summary and Investment Outlook
The three Hang Seng Tech giants present different investment values and risk-reward profiles at 22x P/E. As the "steady player," Tencent, with its unshakable social moat and diversified businesses, offers high certainty at 22x P/E, suitable as a tech "anchor." As the "recovery play," Alibaba is at an AI transformation inflection point, with 22x P/E offering significant re-rating potential as AI+cloud growth accelerates. As the "growth story," Xiaomi's 22x P/E reflects rational auto expectations, with elasticity possible if deliveries and profits rise, but watch execution risks.
Timing-wise, Hang Seng Tech's historical low valuations at 22x P/E provide relatively safe entry. Investors should diversify based on risk appetite, capturing valuation recovery while sharing in China tech's long-term growth.
Key risks: regulatory impacts on platforms, AI commercialization uncertainty, geopolitical shocks to international businesses, and macro effects on consumer electronics/auto demand. Stay rational, monitor fundamentals, and adjust strategies accordingly.
$BABA-W(09988.HK) $TENCENT(00700.HK) $XIAOMI-W(01810.HK)
The copyright of this article belongs to the original author/organization.
The views expressed herein are solely those of the author and do not reflect the stance of the platform. The content is intended for investment reference purposes only and shall not be considered as investment advice. Please contact us if you have any questions or suggestions regarding the content services provided by the platform.
