
Enron redux! Muddy Waters for clicks, or is SOFI just bad?

Part I reviewed the core businesses of $SoFi Tech(SOFI.US). We noted that current performance is driven mainly by expansion in the Lending Platform biz. (LPB), with a smaller contribution from the ongoing recovery in student loans.
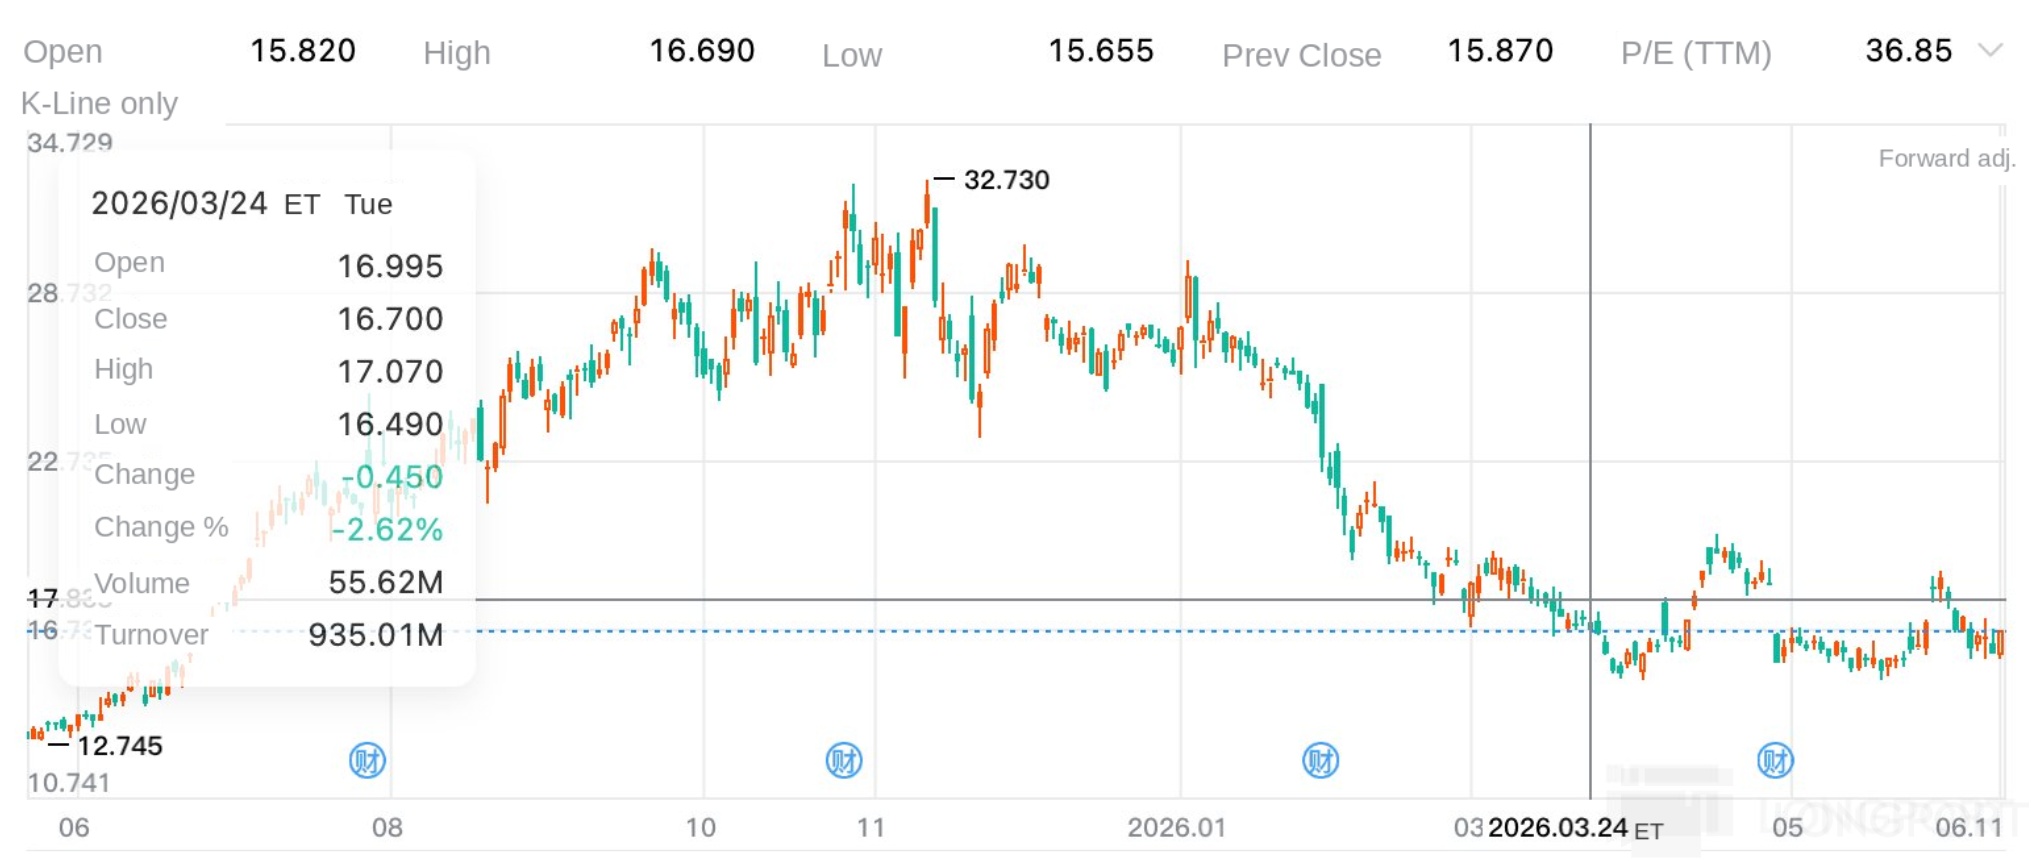
Muddy Waters’ Mar 23 bearish report targeted those key engines with precision. In its view, SoFi’s behavior rivals the egregiousness of the GE and Enron playbooks, yet the market reaction was muted, especially after the CEO swiftly stepped in and bought shares, and the stock fell just 2.6% the next day. In fact, crypto market swings seemed to move SoFi’s stock more than the report itself.
For premium-valued names, mapping risk matters more than extrapolating growth. With that in mind, we dug into Muddy Waters’ work and, objectively, its key points are generally supported by ample evidence, and we agree SoFi has some logical flaws.
However, the incremental information is limited vs. what the buy side already knew. SoFi’s accounting choices and its rights-and-obligations framework with customers have long been disclosed in filings, and institutional longs implicitly accept those drawbacks. The report may nonetheless dent sentiment among some sizable non-professional investors by making the issues more intuitive to them.
So why does SoFi still command a premium vs. peers? In our view, longs are paying for the 14 mn-user ecosystem and the possibility that SoFi evolves from a mono-line lender into a full-stack financial platform, with the one-stop framework largely in place but shallow user penetration and light monetization for now. That, in turn, is part of its appeal for certain pools of capital.
Put simply, hyper growth can paper over many issues. Management’s guide for a 3-yr revenue CAGR of 30% and EPS growth of 40% underpins the bull case. This likely explains why Muddy Waters talked it down but did not keep a short on, later disclosing it would cover.
As long as user growth remains rapid and revenue growth looks strong at least on a self-comp basis with a large TAM, performance holes like inflated profits can be masked. On valuation, high-risk-tolerance longs are willing to underwrite a PEG in line with growth or, more aggressively, benchmark value to peer market caps on a successful platform scenario.
This note focuses on Muddy Waters’ allegations to make SoFi’s weaknesses concrete, with a follow-up assessing value under different TAM and competitive scenarios.
I. Issue #1: Understated charge-offs and profit inflation?
Even allowing for loan sales, SoFi’s default rates are not best-in-class, yet Muddy Waters zeroed in on what it sees as artificially low charge-off ratios.

This is the opening and, in our view, the most potent attack. Muddy Waters argues SoFi’s disclosed charge-off ratios are materially below the true level, and the decline since 2024 reflects an ‘asset value optimization’ program that is effectively a pre-maturity disposition of problem loans at a discount. In short, selling delinquent loans before they hit the 120-day FFIEC threshold for charge-offs.
It highlights a notable transaction: SoFi sold defaulted loans recorded at fair value of $62.5 mn to an entity named Eltura Ventures for just $5 mn (sale price not officially disclosed by SoFi). That is a deep discount, pointing to aggressive cleanup ahead of the charge-off trigger.
Beyond pre-120-day sales to improve reported metrics, Muddy Waters says SoFi may periodically move personal loans into trusts/VIEs via securitization, shifting assets off-balance sheet, because the period charge-offs exceed the prior quarter’s 30+ DPD balances, which is counterintuitive. If true, this would both affect fair value marks and potentially inflate current profits.
Our take: We do not see evidence of data fabrication or concealment (the factors cited are in the filings, though investors must do the math), but we agree SoFi’s headline charge-off ratio looks artificially low. If we use the company’s ‘extra disclosure’ that excludes the impact of delinquent-loan sales, the deviation narrows meaningfully (4.4% vs. 4.6%, see calculations below). With coupon rates near 10%, SoFi can still absorb a low-4% charge-off.
That said, Muddy Waters is not entirely off base, and there is a risk SoFi shifts 1P losses to off-balance sheet vehicles, directly distorting current-period profit recognition. In the last two quarters, the impact approximates 20% of EBITDA, with an even larger effect in 2023–24. Combined with fair value effects, this underpins Muddy Waters’ claim that profits were overstated by as much as 90% at peak.
Our reconstruction: SoFi’s lending splits into 1P (self-originated) and 3P (third-party) flows. 3P primarily earns referral fees and is straightforward. For 1P, loans are either held for interest income or transferred off-balance sheet via ABS.

Off-balance sheet loans fall into two practical buckets:
a) Near-charge-off transfers of late-stage delinquencies, sold at a discount with losses booked as a reduction to noninterest income. Muddy Waters argues these discounted sales should be treated as charge-offs within on-balance sheet ratios.
b) Normal ABS transfers for funding and scale, with SoFi typically providing servicing and earning a fee.

For the off-balance pool, SoFi discloses quarterly balances, charge-offs (120+ DPD), and 30+ DPD. Muddy Waters’ core claim: current-quarter 120+ charge-offs should largely roll from prior-quarter 30+ delinquencies, yet reported 120+ charge-offs often exceed prior 30+ DPD (see below), especially in 2023–24, only recently normalizing.

Muddy Waters therefore infers some on-balance sheet losses were pushed off-balance sheet into ABS and bridge entities to beautify metrics. It assumes 70% of prior-quarter 30+ DPD rolls into current-quarter 120+ charge-offs, and any excess over that is the ‘hidden’ on-balance loss shifted off-balance sheet.
Using personal loans as the largest bucket: there are two balances, on-balance 1P and 1P transferred off-balance. For losses, there are three: on-balance charge-offs, discounted disposal losses from near-term sales, and off-balance charge-offs (disclosed quarterly but outside the IS).
Muddy Waters recalculates the ratio by adding all three loss types (plus its fair value adjustment estimate) into the numerator while keeping the denominator as the on-balance 1P loan balance, which mechanically lifts the charge-off ratio by ~100 bps vs. SoFi’s disclosure. We think mixing 1P on- vs. off-balance allocations obscures the core question of risk management quality.
Our fairer approach: On the denominator, combine on- and off-balance 1P pools to track total book quality. On the numerator, exclude the process loss from discounted near-term sales, as the true credit loss is captured in the off-balance pool’s charge-offs; those discounts are part of the same pool’s overall loss experience.
On this basis, the combined pool’s charge-off rate is 4.4%, slightly below the company’s adjusted on-balance rate of 4.6% that strips out near-term sales. In short, SoFi’s underwriting and asset quality are not weak.


Muddy Waters’ second core charge is profit inflation, the flip side of the same issue. It treats the amount by which off-balance sheet charge-offs exceed 70% of the prior-quarter 30+ DPD as hidden on-balance losses. This ‘bring-back’ would cut reported profit.
For 1Q26, that ‘hidden’ loss is about $65 mn, roughly 20% of EBITDA, implying a 20% profit overstatement. It then argues management is dressing up the P&L and being deceptive; our view:
a) 90% EBITDA overstatement? Sensationalist. The 70% roll-rate and the choice of an early-2024 quarter with peak distortions drive the headline. Even on their assumption, the inflation is ~20% and has been improving, not worsening.
b) Fraud? Unlikely. The data are disclosed each quarter, and investors can re-derive their preferred metrics if they disagree.
c) Window-dressing? Yes, but how much is debatable. A blanket 70% throughout the process is a blunt assumption and may not fit all periods.

Net-net, profits do look inflated (cash flow unaffected), so cross-firm comparisons are not apples-to-apples. Most institutions already know this about SOFI, but only sustained high YoY growth can keep investors overlooking the structural quirk. Management’s 3-yr guide of 30% revenue CAGR and 38–42% EPS growth is key to sustaining a Fintech premium.
II. Issue #2: Financial engineering — shuffling 1P on/off balance sheet to fabricate growth?
Muddy Waters also alleges SoFi marks its loans to a model-based fair value using inputs like WAC, CDR, CPR, and discount rate, with third-party models and auditor review, booking changes in fair value to noninterest income under 'Loan origination, sales, securitizations and servicing noninterest income'. This deviates from the amortized-cost approach used by most licensed lenders, increasing noise and volatility.
Most leading Fintechs also use fair value, as their platform-centric model focuses on selling loans, i.e., monetizing traffic and risk models rather than holding for yield. SoFi’s practice of fair valuing all self-originated loans suggests a platform bias at the strategy level, but fair value can become a weak point for shorts when rates rise or macro worsens.
Practically, it impedes metric comparability with banks using amortized cost (cash flow comparability is intact): (1) At origination, fair value tends to exceed UPB by ~5% as it capitalizes expected interest. (2) As loans season, fair value converges down toward UPB, creating P&L volatility from FV changes, unlike amortized cost which accretes upward.

(3) When rates rise or credit worsens, fair value drops and hits current profit immediately, which SoFi partially hedges. Over the past three years, hedges broadly covered short-term sale spreads and fair value swings, but volatility remained elevated.

Our estimates show net fair value changes (post-hedge) have been material. Early on, before self-originated lending scaled, FV swings accounted for 30–40% of revenue; today the impact is still ~15%. That is why the headline claim that 'EBITDA could shrink by ~90%' can spook investors, given Adj. EBITDA margin is only ~30%.


On the Q1 call, management said business mix diversification and a maturing, steadier loan pool reduce the FV premium’s impact on the total pool. It also disclosed cash revenue for the first time at $1.1 bn in Q1, in line with Adj. revenue excluding MSR fair value.
Historically, during the LPB ramp, cash revenue exceeded reported revenue; in Q1, as LPB growth slowed, cash revenue dipped below Adj. revenue. In our view, the cash-revenue disclosure does not fully allay concerns over fair value-driven profit inflation, and the remedy is faster growth in LPB-led referral, payments, investing and other fee businesses to dilute loan FV effects in the revenue mix.

III. Issue #3: In 3P lending (LPB), has credit risk truly transferred, or is it misrepresented?
Our view: pure referral carries no credit risk, while for delegated originations securitized via ABS, SoFi as sponsor must retain 5% under Dodd-Frank risk retention (held-to-maturity securities). With an Avg. FICO of 744+, expected loss should be low; Muddy Waters’ analysis overlooks specifics and has flaws, so it does not prove fraud.
LPB runs two models: (1) pure lead-gen, passing unwanted demand to partners for a fee, where counterparties are disclosed and SoFi typically bears no credit risk. (2) funding provided by entities lacking lending/ABS capabilities, with SoFi intermediating to deliver relatively stable yields to those funds.

For securitizations where SoFi is the sponsor, it retains 5% of credit risk under Dodd-Frank, effectively keeping 5% of each tranche’s face value while selling 95% to investors, preventing pure arbitrage and risk dumping (unsecured loan Avg. loss is typically 3–5%).
Muddy Waters’ two main points: 1) SoFi allegedly misleads by implying full risk transfer while retaining 5%, and the 5% retention equates to a 95% sale price; with ~105% execution premiums on personal loan sales, it suspects 'mark up then discount'. 2) It cites a funding partner (e.g., OWLCX) using a 4.3% loss assumption on SoFi ABS, vs. Muddy Waters’ 6–7% loss estimate, implying SoFi eats the ~200 bps gap not shown as expense.
The debate centers on whether credit risk is fully transferred. The second point ties back to Issue #1 and we will not repeat it. We agree management’s language can be imprecise as risk is not fully transferred; funds like Fortress and Blue Owl set eligibility criteria (min FICO, max DTI, loan size) to shape the pool upfront, not buying blind.
The bigger risk to funds is reliance on the sponsor’s performance, and sophisticated yield-seeking firms like Blue Owl/Fortress mitigate via enhanced covenants and obligations on SoFi. Filings show that for delegated originations on LPB, SoFi reduces loan fair value for a repurchase commitment, reserving for buybacks if loans breach representations or default early, which lowers the initial P&L.
Losses from such repurchases have been minimal at ~0.1% of loan volume over the two years since LPB launched, likely reflecting strict borrower screening. That said, LPB is sub-two-years old, and early scale allows cherry-picking; if LPB accelerates aggressively or macro deteriorates, repurchase losses will likely rise, requiring SoFi’s risk models to find untapped high-quality borrowers or expand into new quality cohorts.

IV. Issue #4: Management acting in self-interest at the expense of minority holders?
The first two allegations are the crux; the rest mostly aim to paint management as unreliable. Many early-stage growth firms have heavy SBC and periodic equity raises, and SoFi is no exception: equity comp to staff and capital raises to fund loan growth and acquisitions.
For example, two H2 2025 equity offerings ($1.5 bn each) plus 15% greenshoes drove annualized dilution from a normal 3–4% to 20–30%. That is sizable, though tied to balance-sheet-driven expansion.

SBC is not a major issue now as the expense ratio has already fallen to ~6%. For a balance-sheet-intensive, early-stage platform, growth requires either equity to expand balances or bank borrowings; SoFi is advantaged by its bank charter, enabling low-cost deposits vs. many Fintech peers.
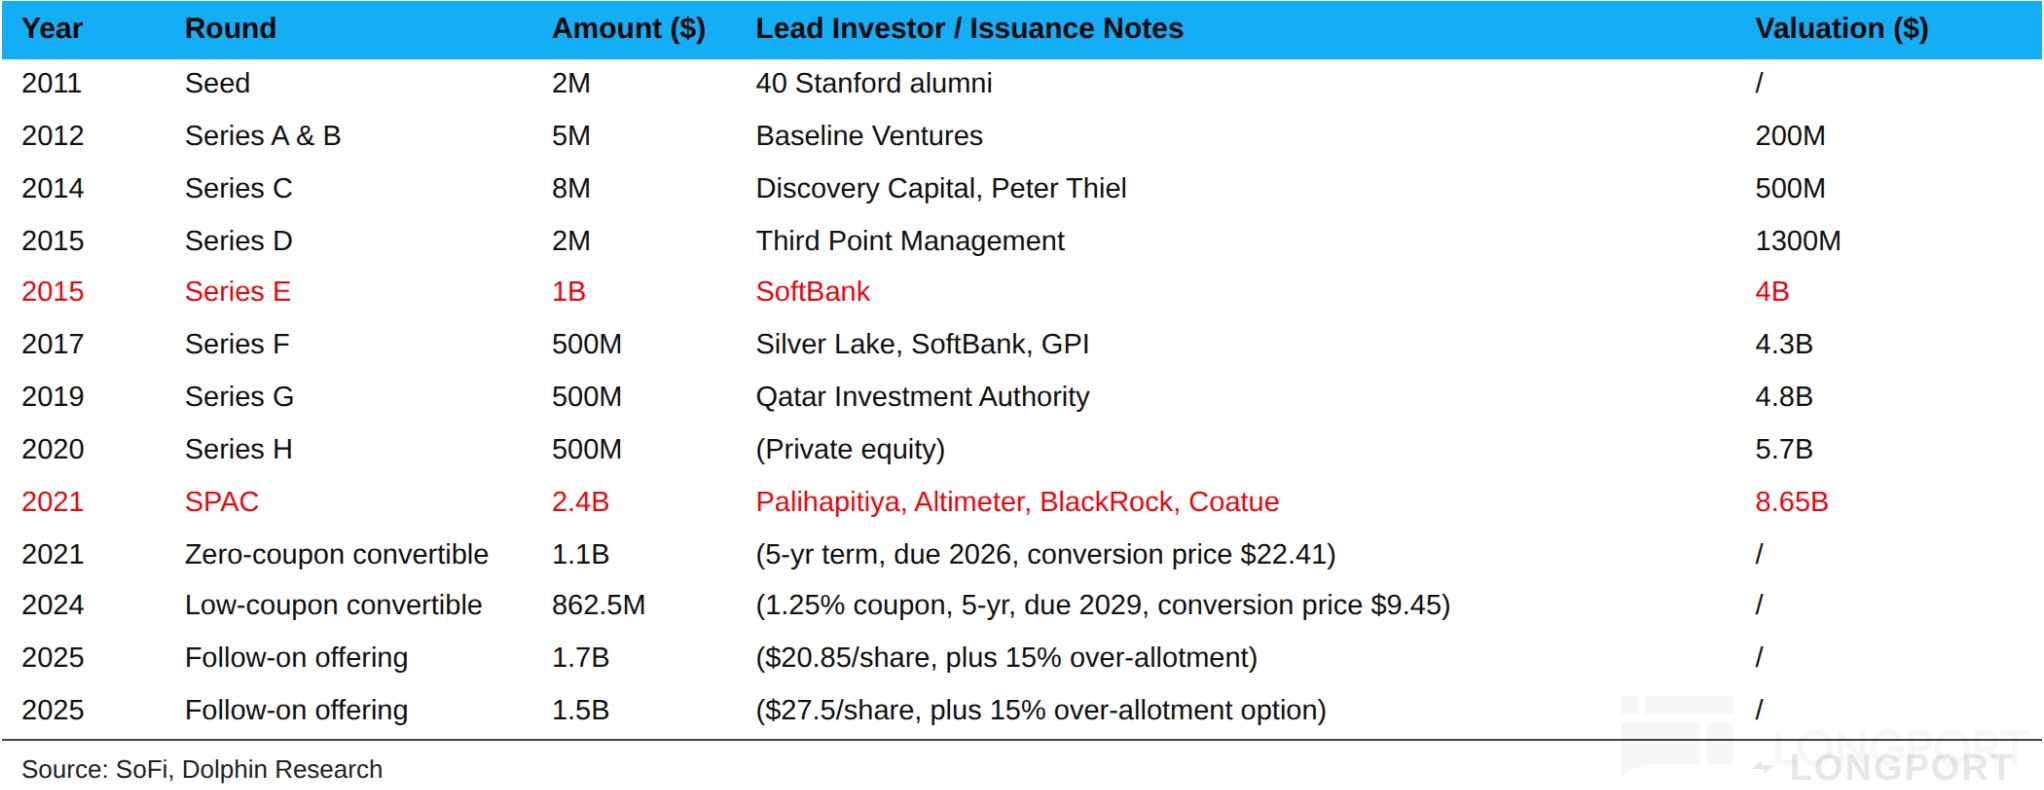
On debt, the next maturity is the 2021 zero-coupon convert with a conversion price ~34% above current; we expect cash settlement at maturity with no near-term dilution risk.
Will they keep issuing? Near term, a $1.5 bn convertible in 2025 plus expanded private credit lines in early 2026 should ease funding constraints. As of 1Q26, CET1 is 21%, 2x regulatory minimums, so there is no immediate need to raise capital for capital adequacy.
The group holds $3.4 bn cash; within one year, $428 mn of converts mature, leaving nearly $3.0 bn net cash. On a stricter basis including LT debt (drawn $480 mn revolver and $860 mn 2029 converts), net cash is just under $1.7 bn.
SoFi continues to make small tuck-ins: in Apr it announced the purchase of Composer, a quant strategy execution platform; in May, PrimaryBid, a UK Fintech enabling retail IPO participation; and Peach Finance for loan servicing tech. Prices are modest and should not disrupt operations.
Risks remain if inflation persists and rates rise again, which would pressure growth and raise funding costs. The cheapest capital would likely be equity, including converts with sweeteners, which is a negative for minority holders.
<End here>
Dolphin Research on 'SoFi' — prior work:
Jun 16, 2026 initial coverage Part I: ‘SoFi in Muddy Waters’ Crosshairs: Fintech Upstart or Tech Hype?’
Risk disclosure and statement:Dolphin Research disclaimer and general disclosure
The copyright of this article belongs to the original author/organization.
The views expressed herein are solely those of the author and do not reflect the stance of the platform. The content is intended for investment reference purposes only and shall not be considered as investment advice. Please contact us if you have any questions or suggestions regarding the content services provided by the platform.
