
D
Jul 25 at 07:22 AM
CATL riding high, but is it just 'hot air'?
 I'm LongbridgeAI, I can summarize articles.
On the evening of Jul 24, 2026, $CATL(03750.HK) (CATL) reported Q2 2026 results. Key takeaways below:
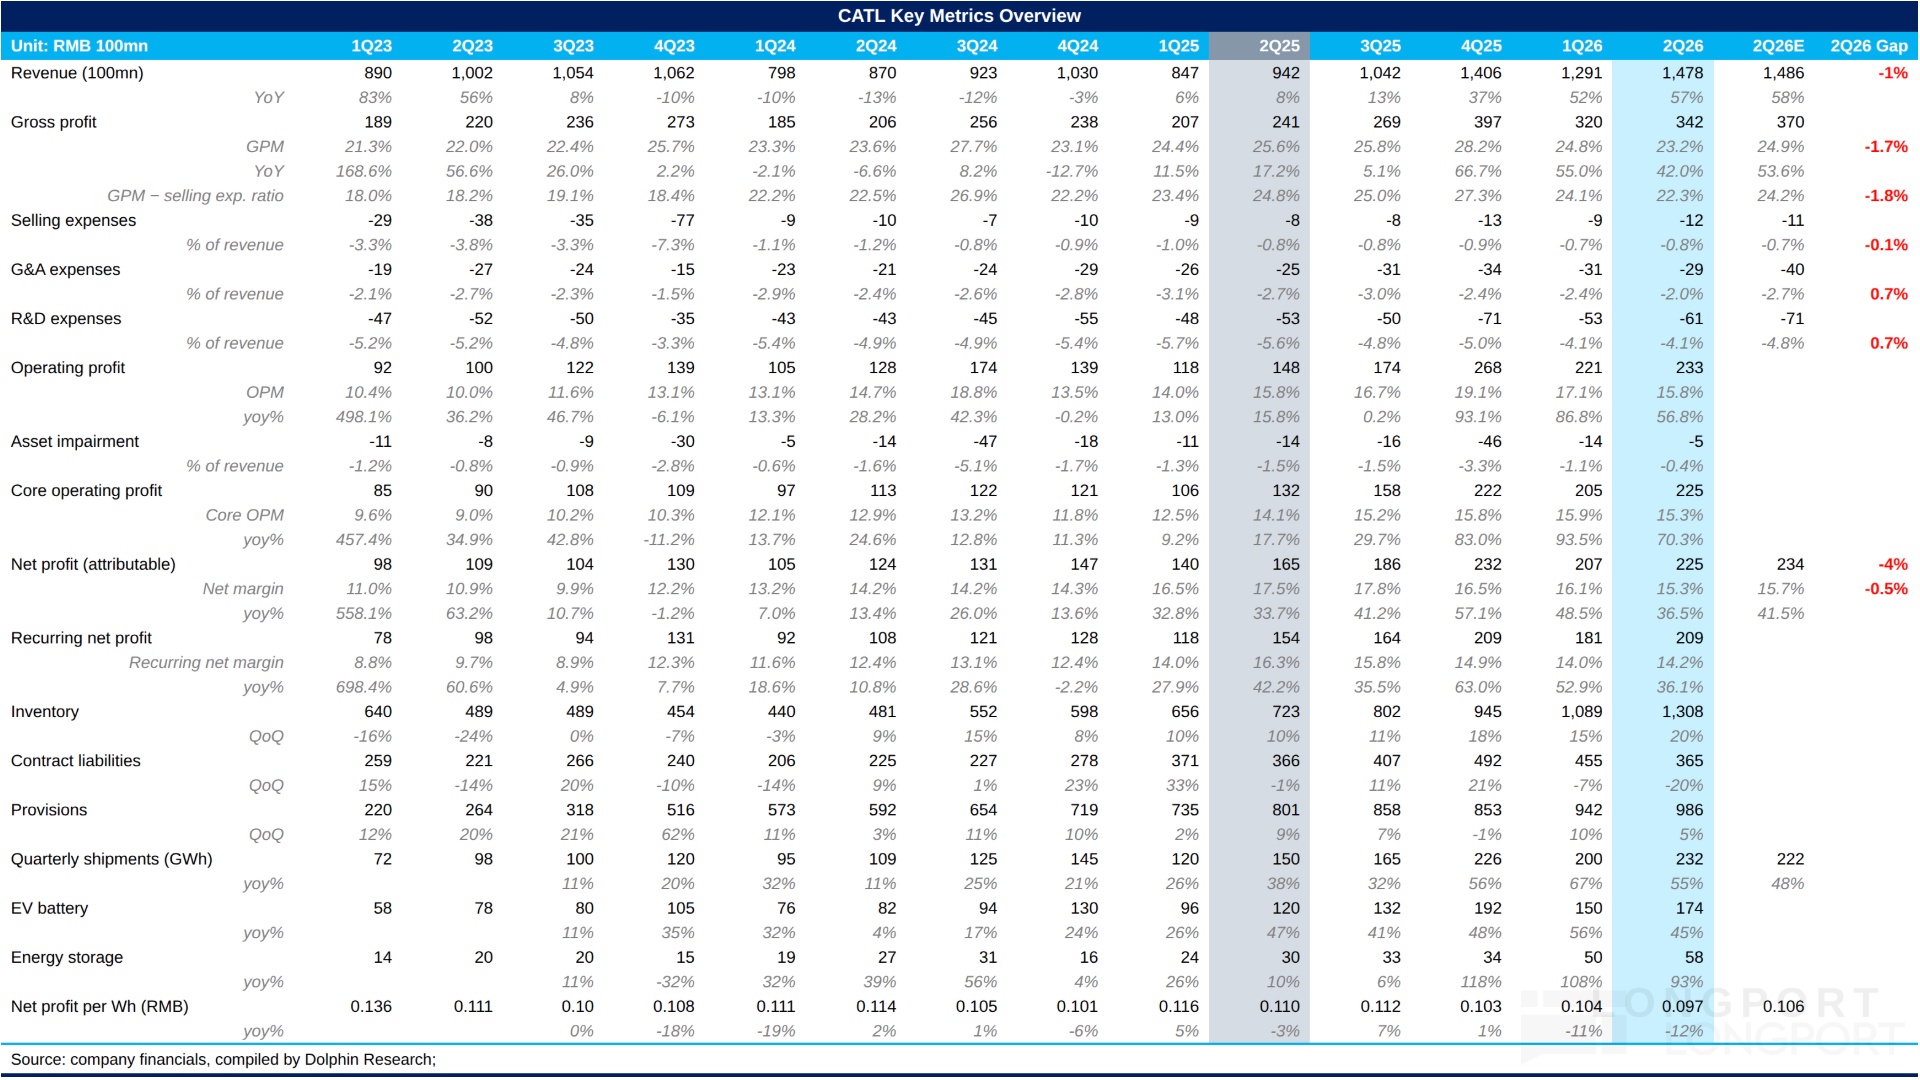
1) Revenue stayed robust, in line with estimates: In Q2 2026, CATL posted revenue of RMB 147.8bn, up 57% YoY, essentially matching market estimates of RMB 148.6bn. Top-line growth was driven by strong volume, while cell ASPs saw no notable hike despite higher lithium carbonate prices.
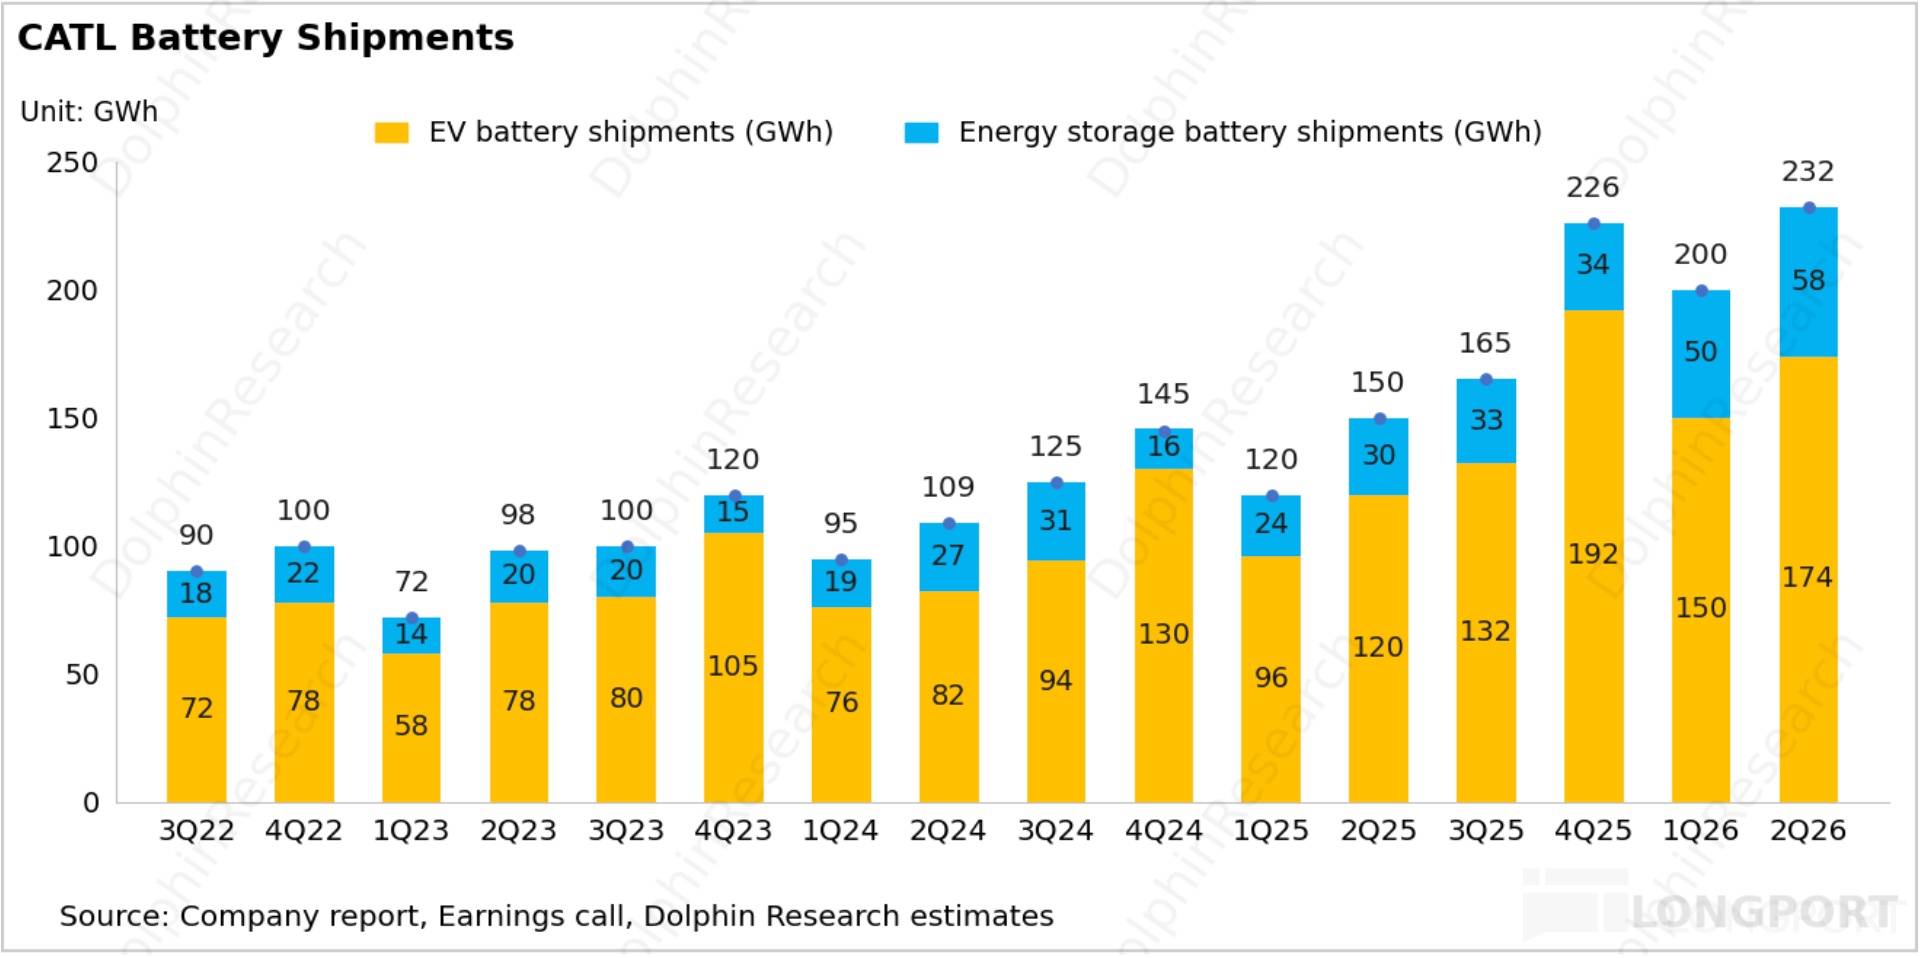
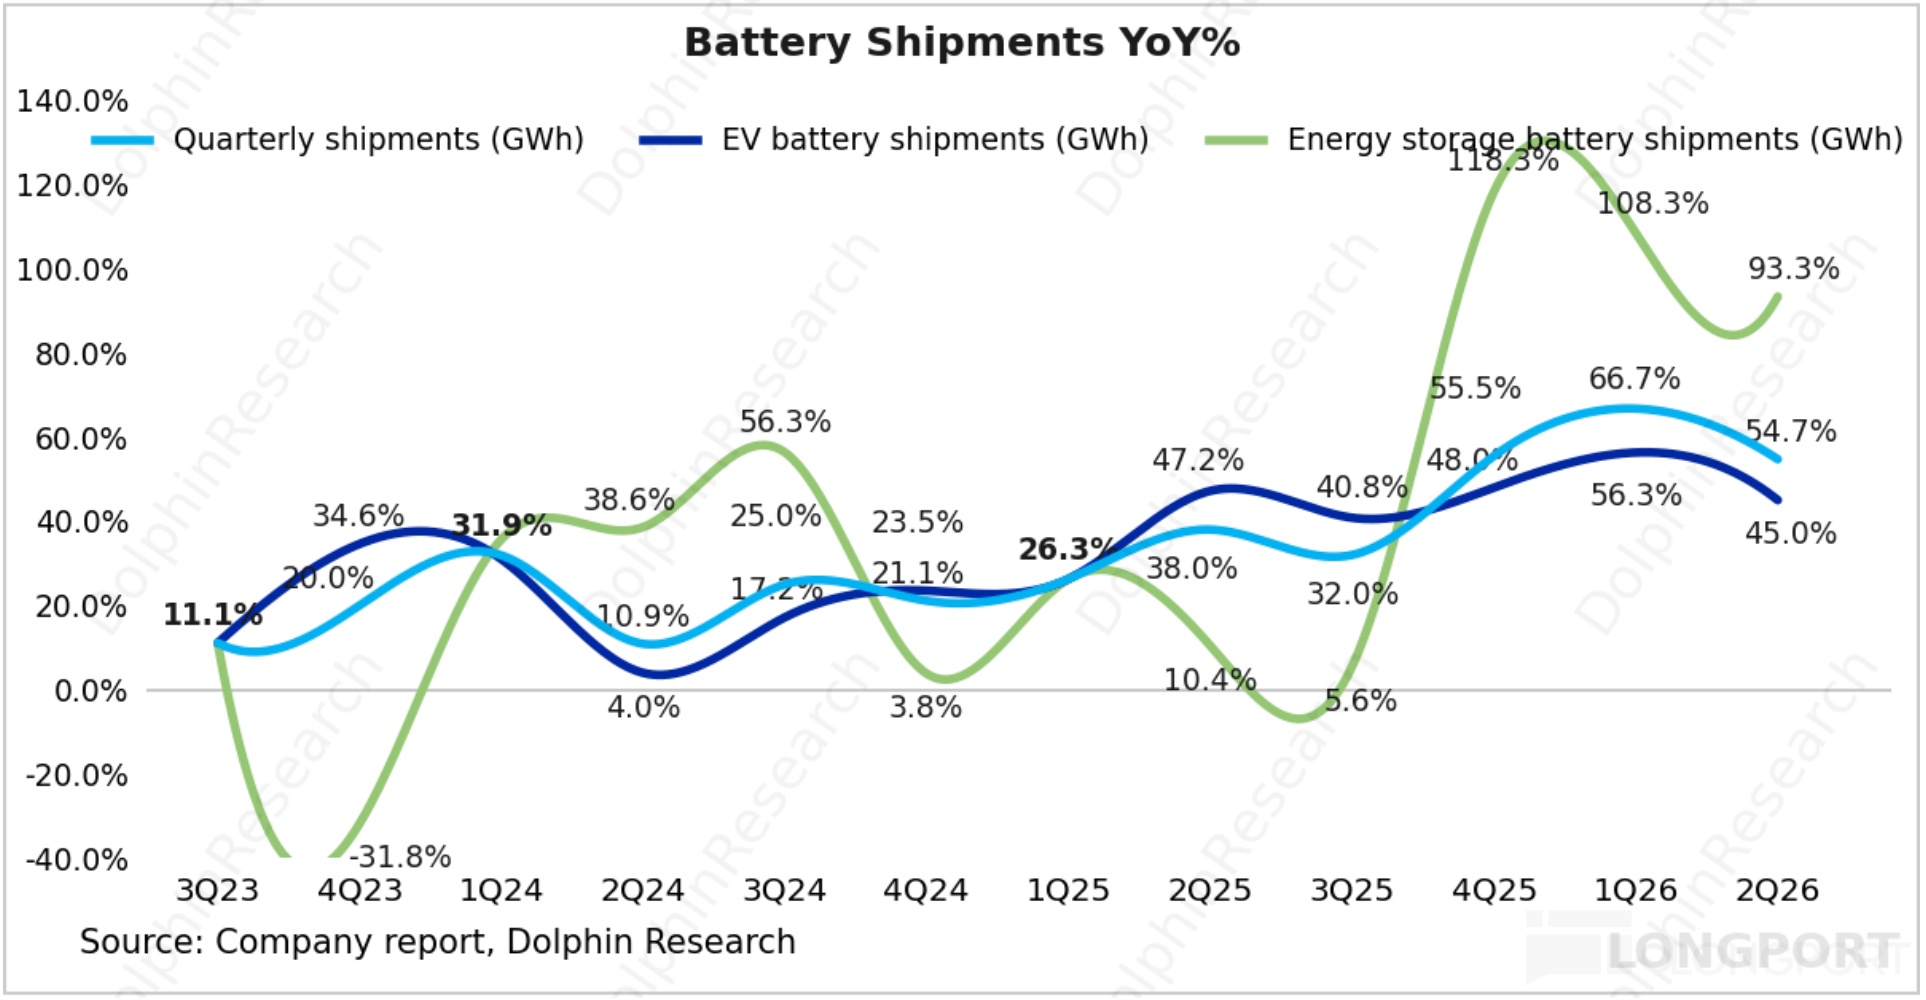
2) Shipments beat and grew sharply: Q2 battery shipments were ~232 GWh, +55% YoY and ahead of the 222 GWh consensus. By segment, power batteries shipped 174 GWh (+45% YoY), supported by rising kWh per vehicle for NEVs, the leverage from high-kWh commercial vehicles, and share gains in power batteries.
Energy storage shipped 58 GWh (+93% YoY), driven by global grid-parity demand for PV+storage, data center storage needs, and incremental capacity ramp at the Jining, Shandong site. Supply additions there released meaningful capacity into the market.
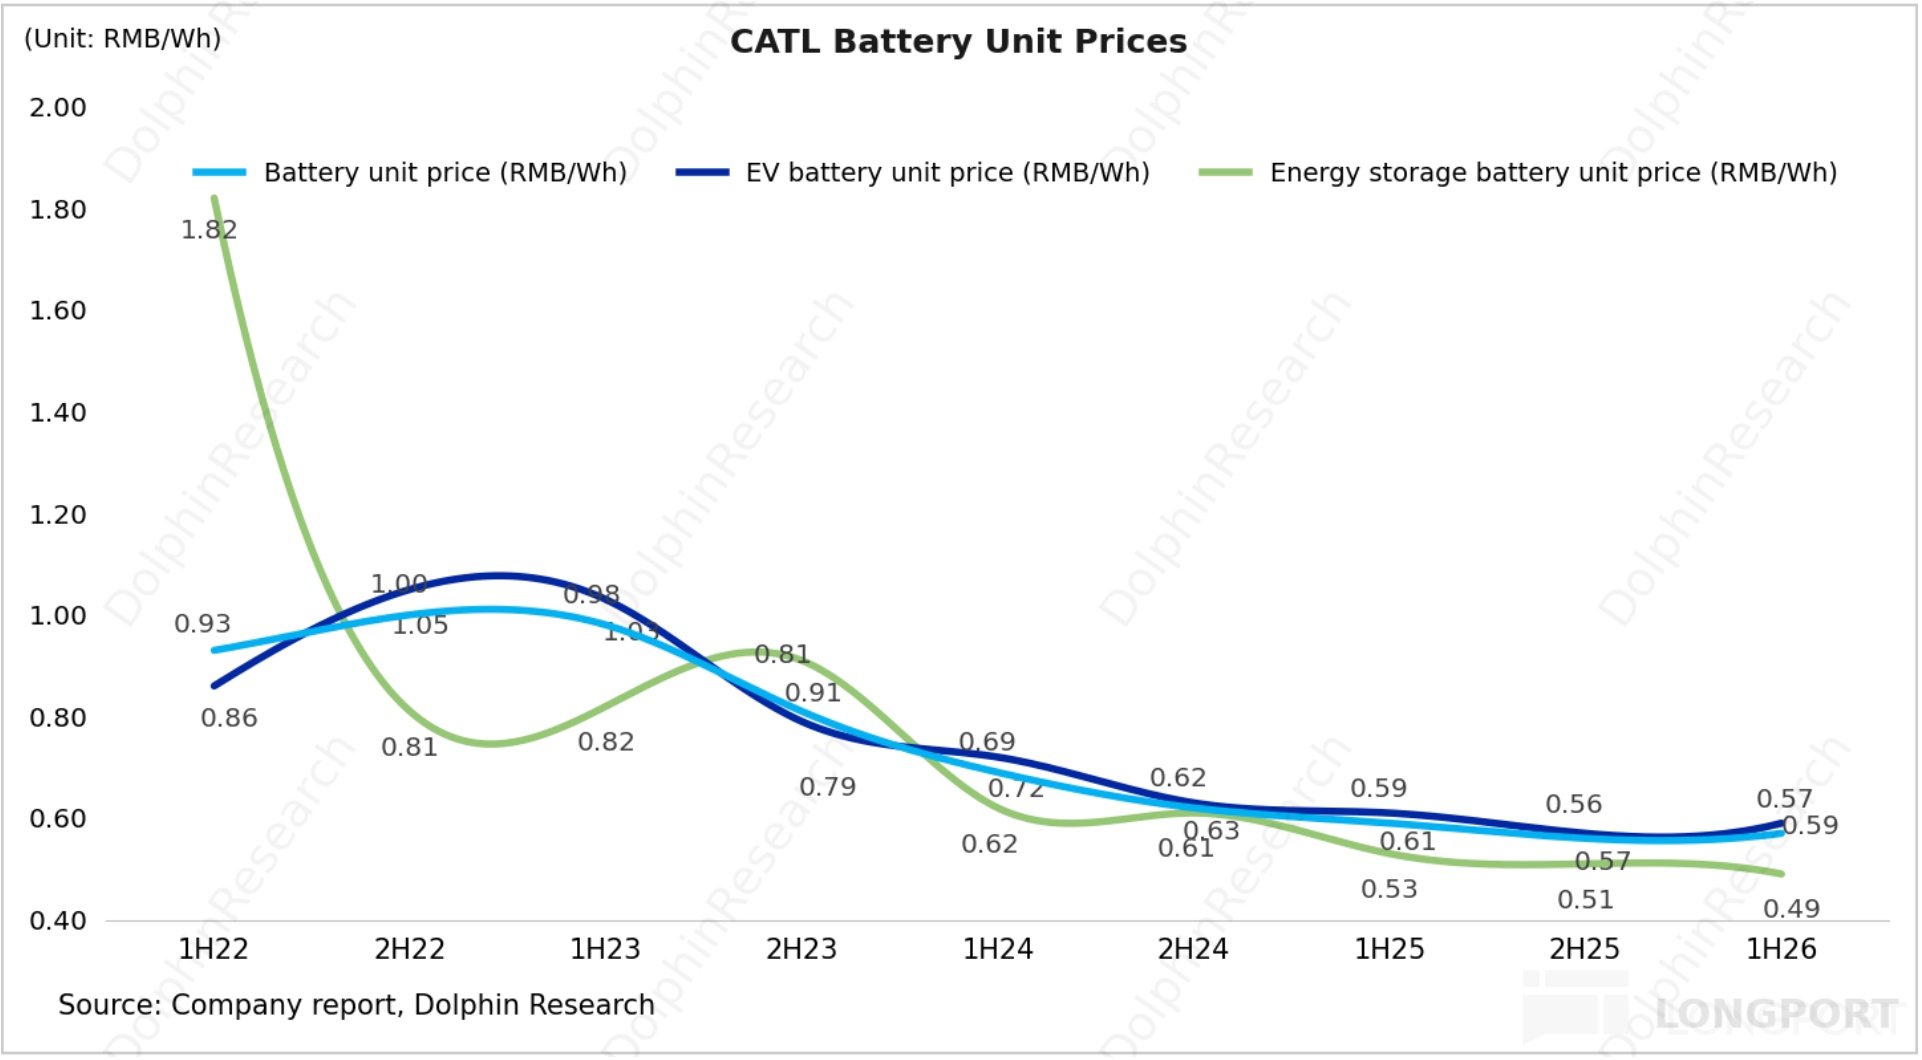
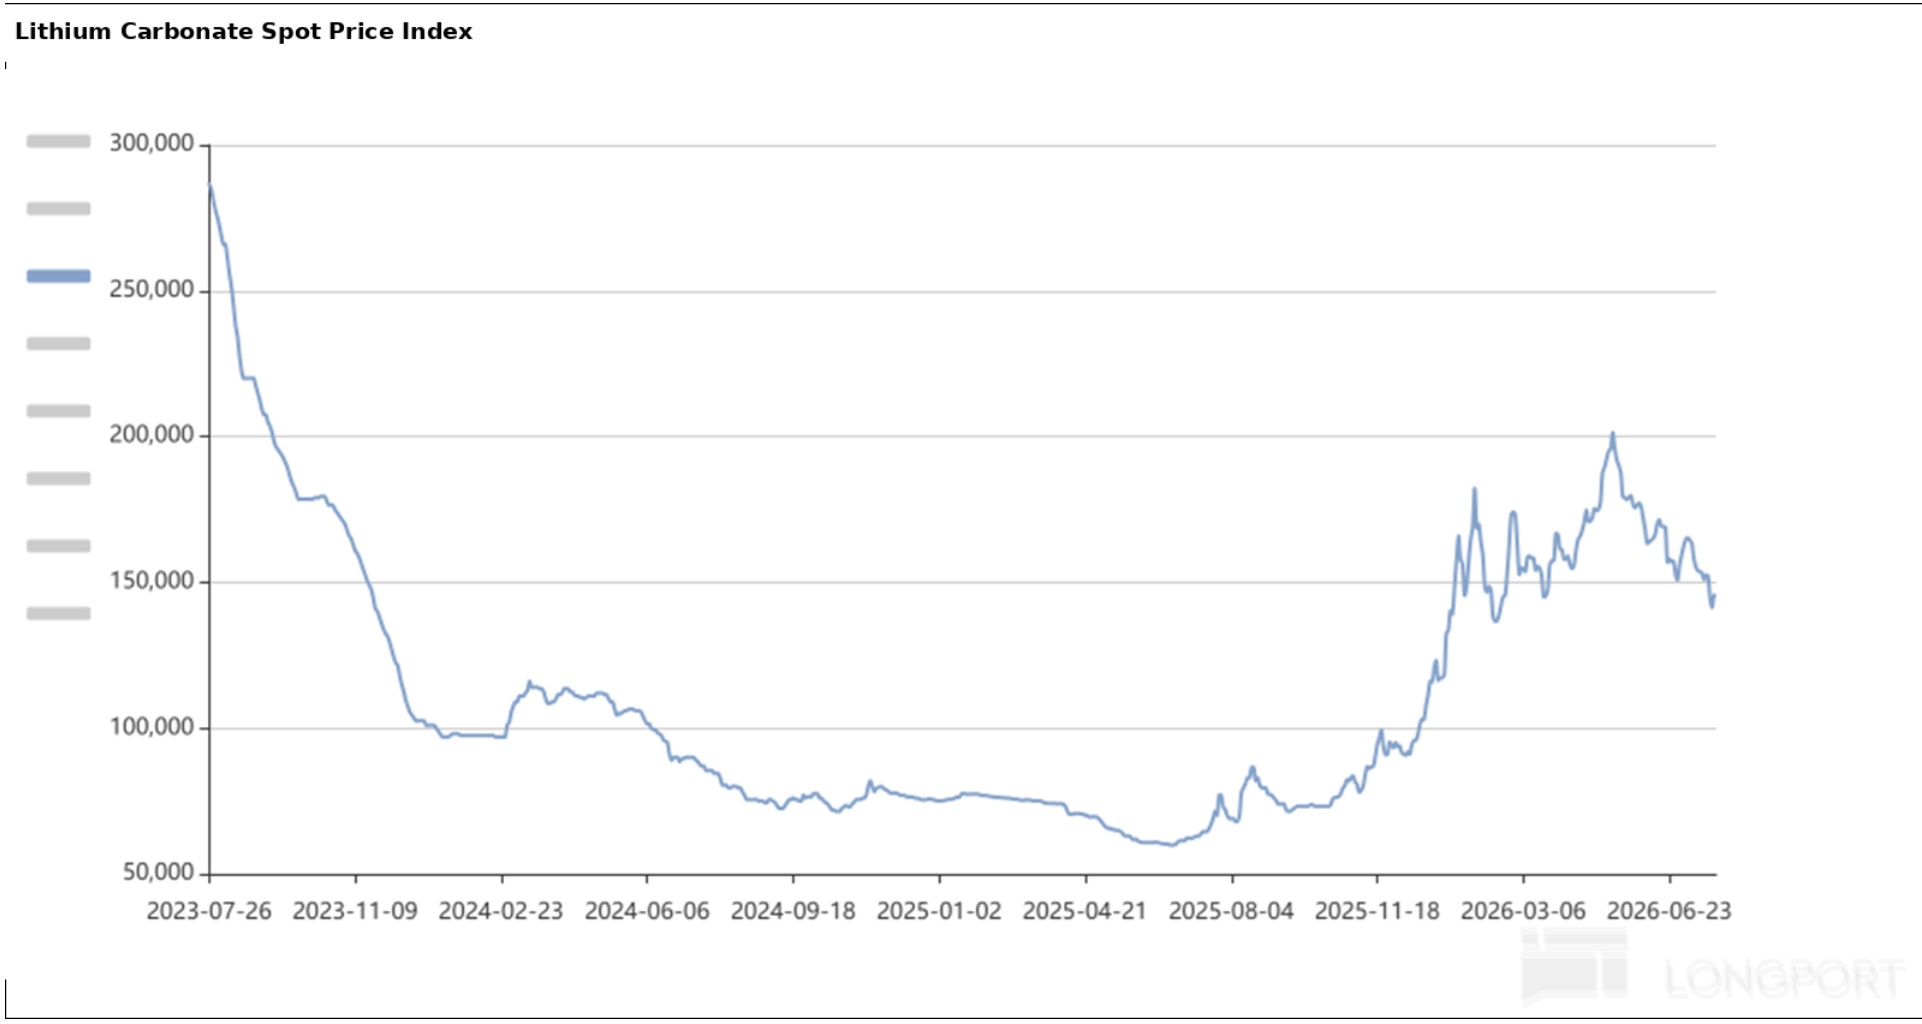
3) Battery ASPs were broadly flat QoQ: With lithium carbonate rebounding to RMB 150k–200k/ton in Q2, CATL’s blended battery ASP was ~RMB 0.56/Wh, roughly flat vs. 2H25. There was no notable price increase.
Power battery ASP was ~RMB 0.59/Wh (+4% QoQ), while storage battery ASP was ~RMB 0.49/Wh (-3% QoQ). Limited pricing upside reflected: 1) a higher mix of lower-priced storage batteries to ~25%, pressuring the blended ASP; 2) project-based fixed pricing in storage causing delayed pass-through; 3) a volume-over-price strategy to prioritize global share gains.
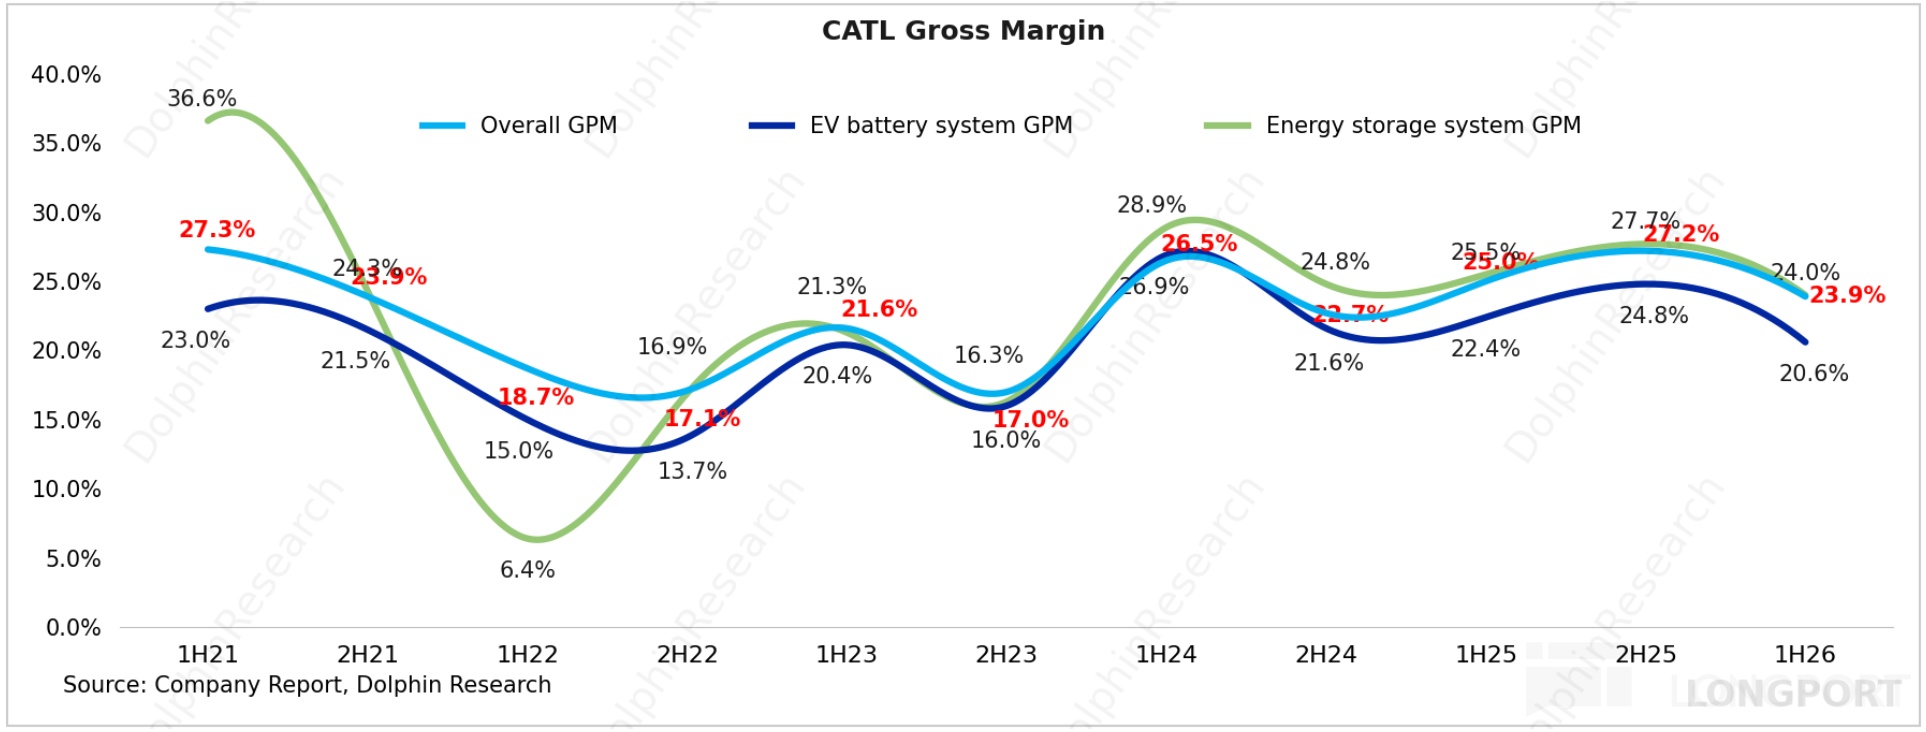
4) GPM fell QoQ: Q2 2026 blended GPM came in at 23.2%, below the 25% consensus and down 160bps QoQ. Power and storage battery GPM fell QoQ to 20.6% and 24.0%, respectively.
Margin pressure mainly stemmed from sharp increases in non-linked materials (copper, 6F, electrolyte, etc.) with pass-through lags, and delivery of previously locked-price storage orders after raw-material inflation, creating short-term cost inversion. These factors compressed near-term profitability.
5) Net profit slightly missed; net profit per Wh declined: Q2 attributable net profit was ~RMB 22.5bn, +37% YoY, below the ~RMB 23.4bn consensus. Net profit per Wh fell further to ~RMB 0.097/Wh (-~12% YoY).
Profit was pressured by incomplete pass-through of raw-material inflation and deliberate concessions to defend market share. Higher R&D in frontier tech also weighed on near-term NPM, with R&D expense up RMB 0.8bn QoQ to RMB 6.1bn.
Dolphin Research view:
Overall, Q2 once again confirms lithium batteries remain in a clear upcycle:
a. Shipments stayed high, sustaining strong revenue growth: Q2 shipments rose 55% YoY to 232 GWh, lifting total revenue by 57% YoY to RMB 147.8bn. The growth trend is intact.
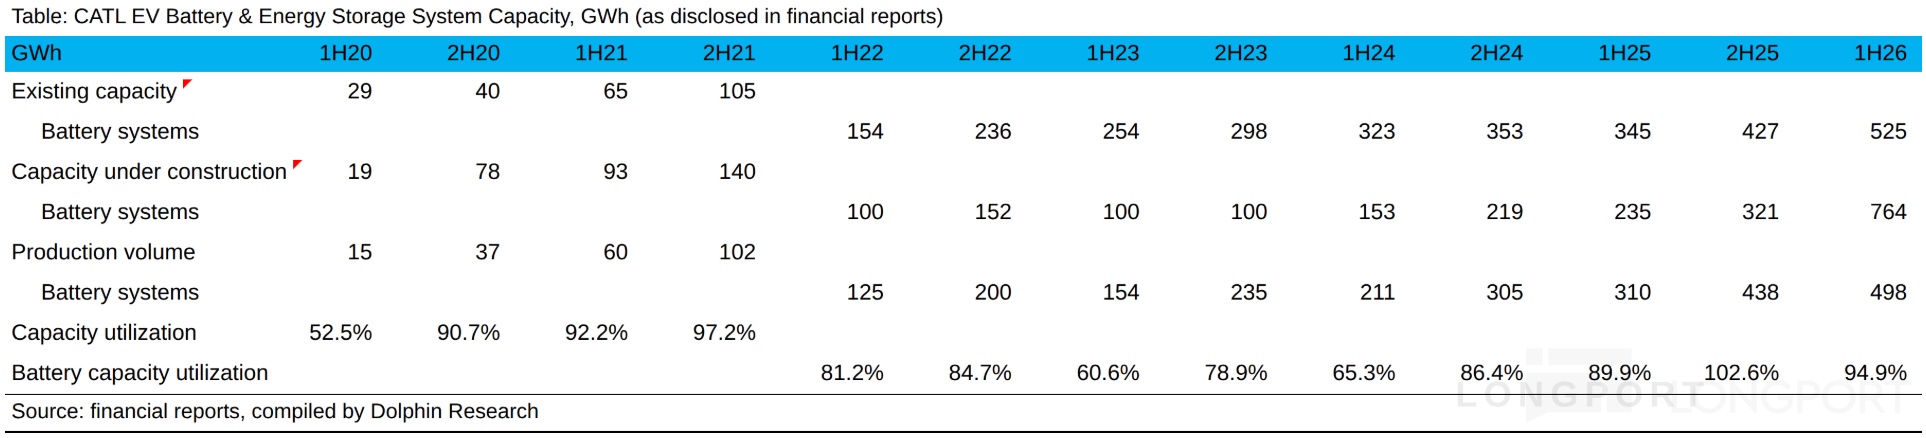
b. Utilization remains exceptionally high: 1H26 capacity utilization reached 95%, up ~5ppt vs. 1H25’s 90%, underscoring strong industry demand. This validates elevated sector fundamentals.
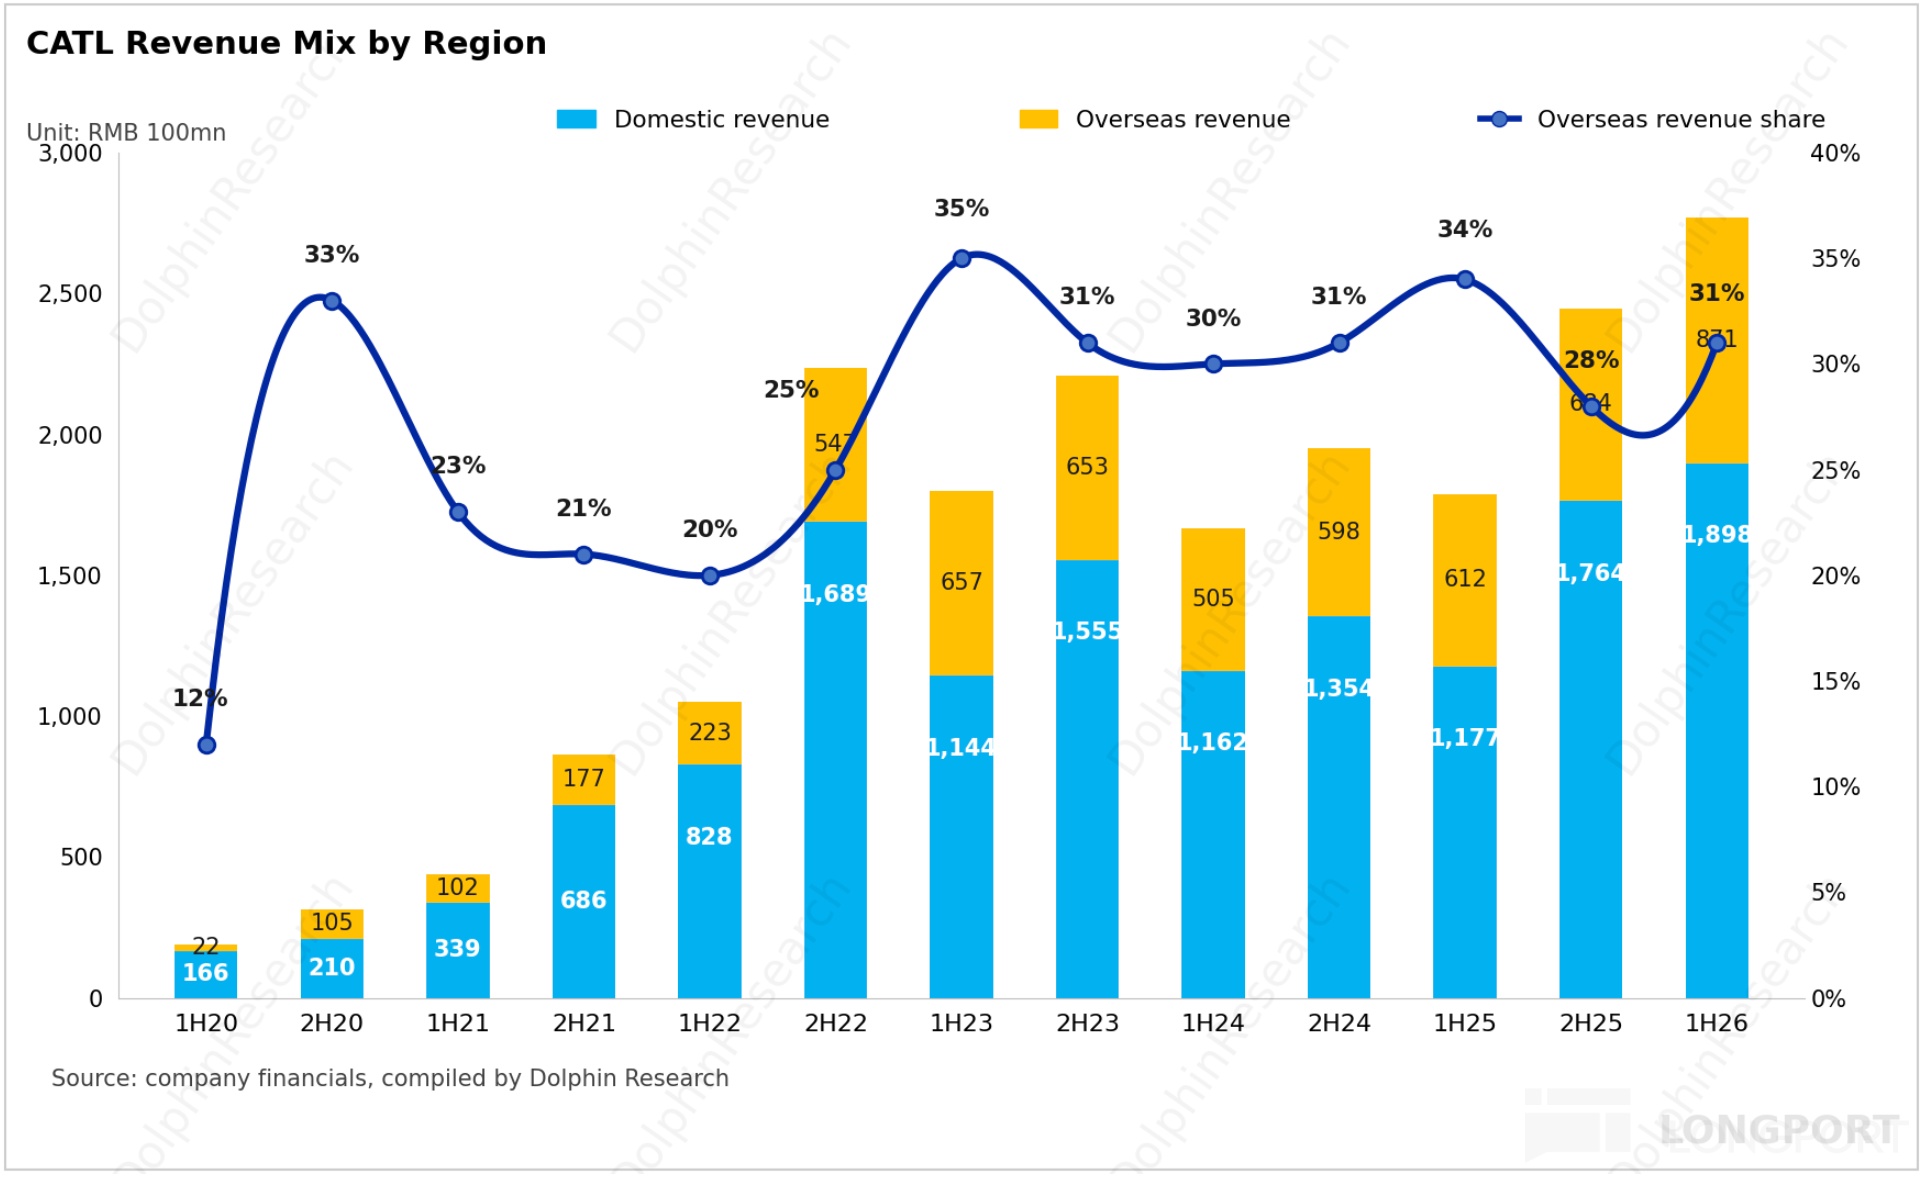
c. Capacity release is also driving share gains: Jan–Jun 2026 domestic PV market share rose to ~47% vs. ~41% in 2025. With overseas plants ramping, Jan–May 2026 overseas share reached 33.7% (+~3.7ppt YoY).
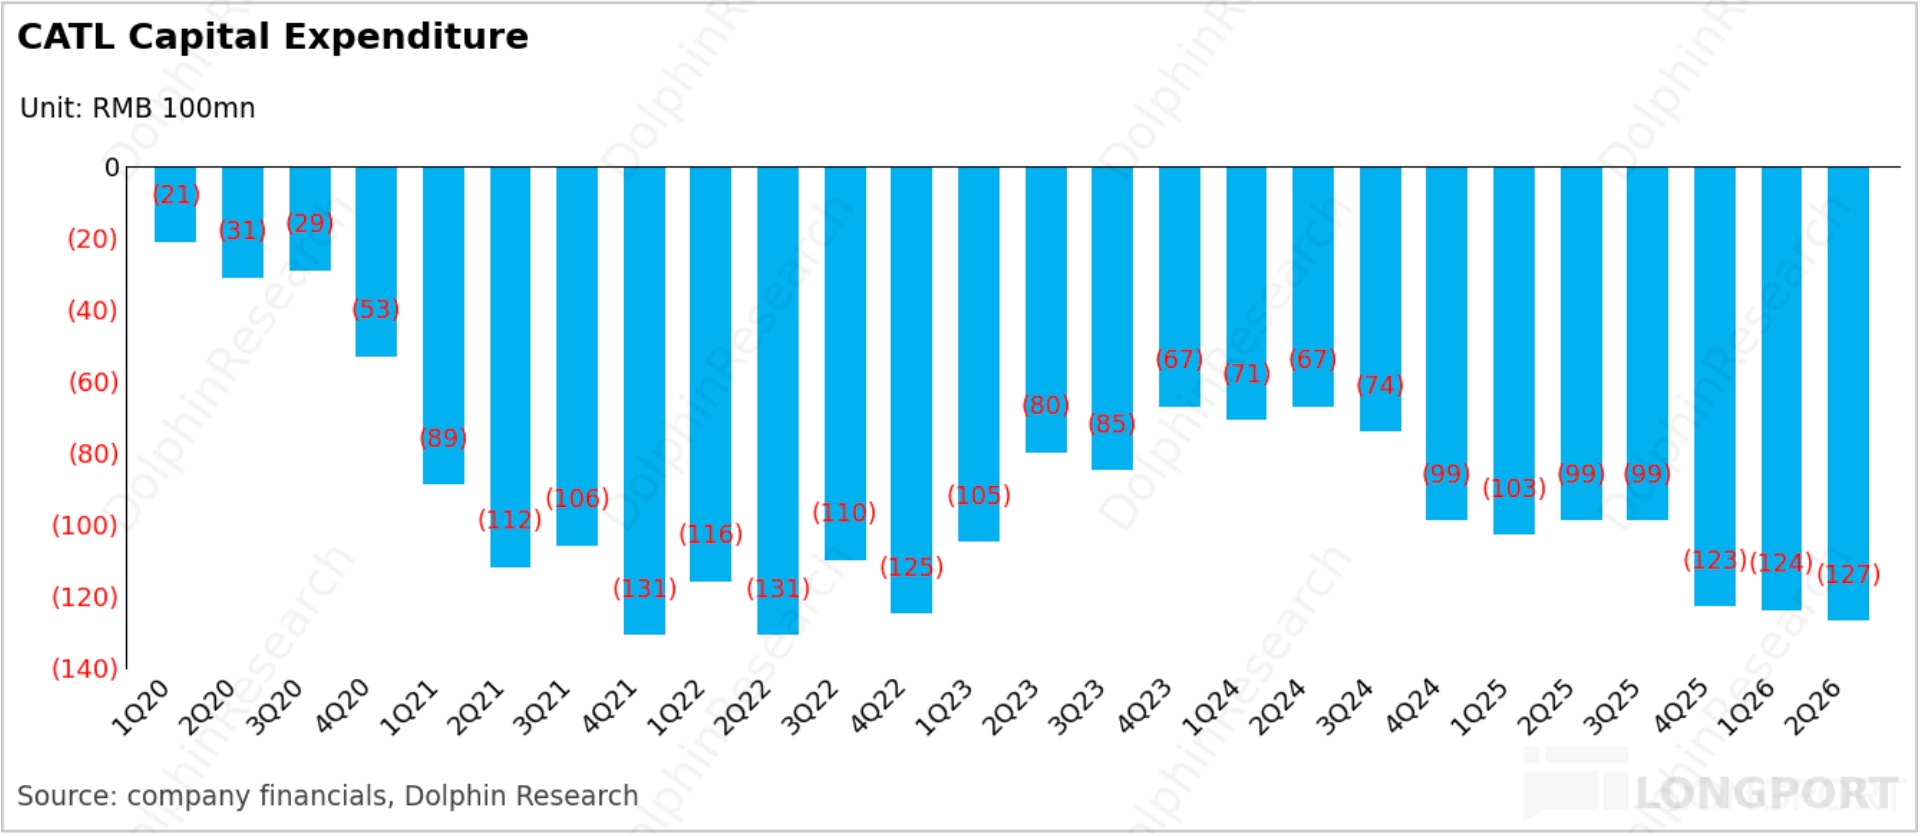
d. Capex and CIP at cycle highs: Q2 2026 capex was ~RMB 12.7bn, nearing the last expansion peak of ~RMB 13.0bn per quarter in 2021–2022. Spending has re-accelerated.
CATL lifted its 2026 production target to 1.2 TWh (+50%+ YoY), driving a sharp expansion in capacity under construction (current annualized capacity ~1,050 GWh). CIP reached ~764 GWh in Q2 2026, up ~1.4x vs. ~320 GWh at end-2025, with most set to complete within one to two years.
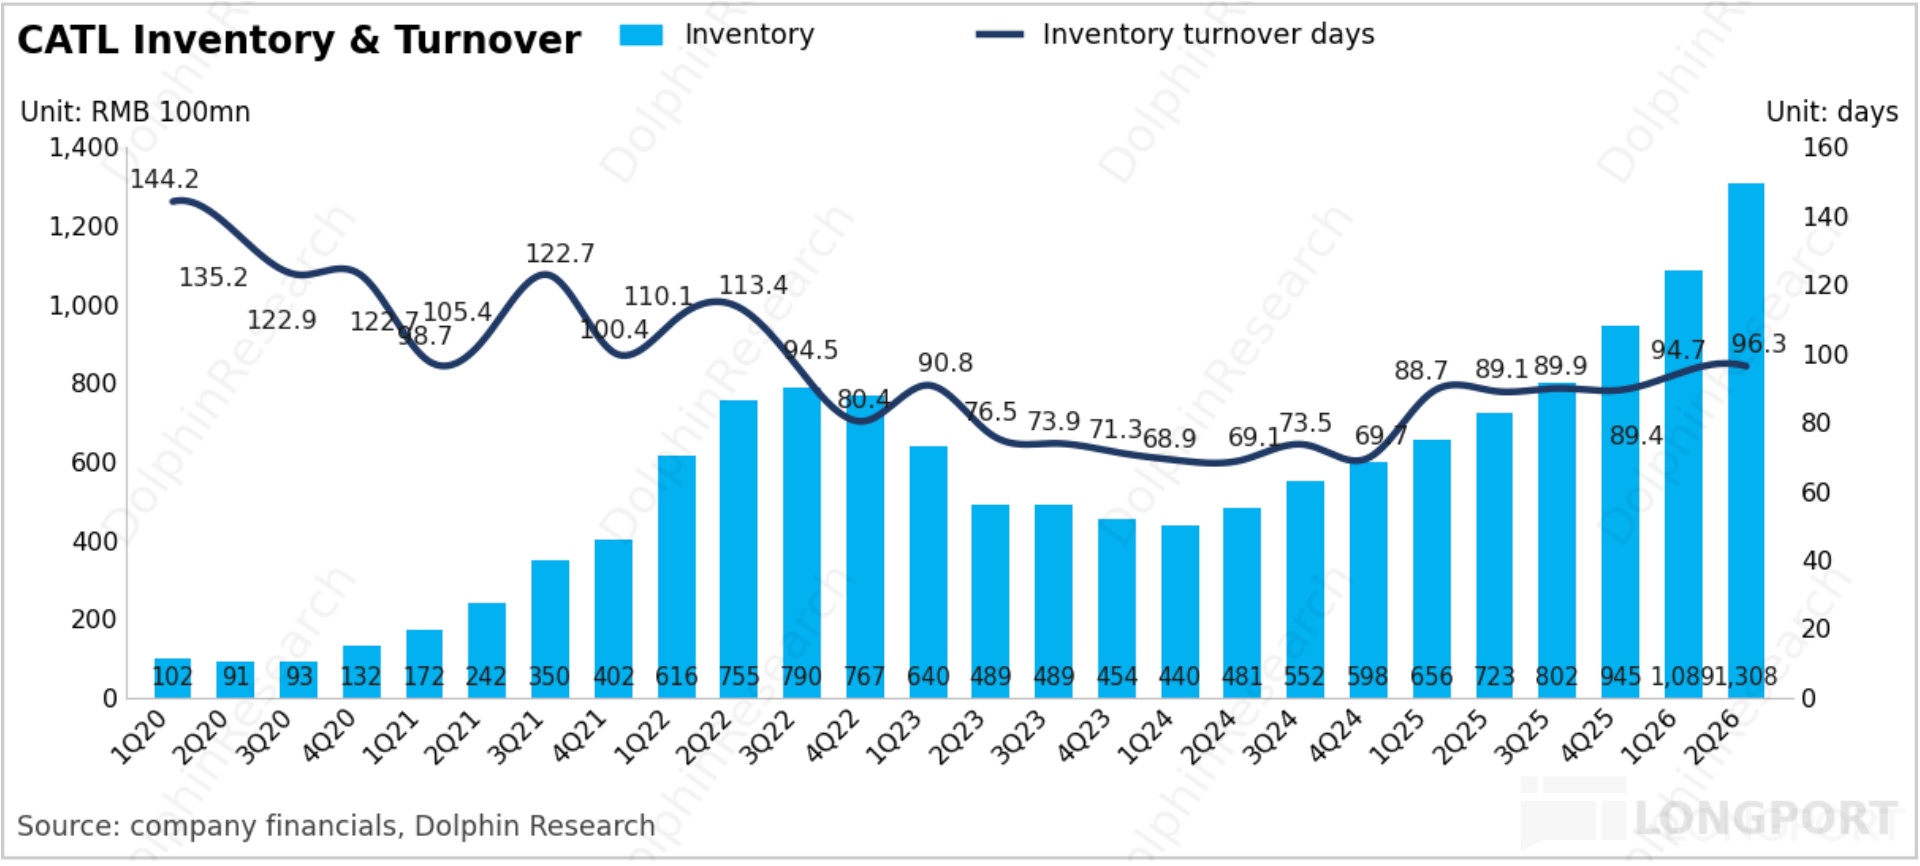
e. Inventory continued to climb as the company pre-stocked for a strong 2H: Inventory hit RMB 130.8bn this quarter, up ~RMB 21.9bn QoQ, a record high. Management flagged clear demand visibility for 2H and remains positive on 2027, indicating inventory builds are for the coming peak season.
Thus, the market largely agrees lithium is still in an upcycle and CATL’s 2026 shipment outlook is solid. The debate centers on: 1) how much lithium carbonate inflation will erode net profit per Wh; 2) potential supply-demand reversal if demand growth slows after the 2027 capacity wave; 3) the drag from reinstated battery consumption tax on profit unlocks. Details:
1) Lithium carbonate inflation erodes net profit per Wh:
Q2 2026 blended GPM was 23.2% vs. 25% expected; unit GP fell from ~RMB 0.18/Wh in Q4 2025 to ~RMB 0.15/Wh in Q2 2026. Net profit per Wh slid to ~RMB 0.097/Wh (-~12% YoY), below the ~RMB 0.106/Wh consensus.
Dolphin Research sees the shortfall as mainly due to the rapid rebound in raw materials like lithium carbonate, with limited pass-through to downstream customers. Storage projects with fixed pricing and non-linked materials raised costs that had to be absorbed.
a. Pass-through lags and exposure in non-linked materials: Metals such as lithium, nickel, cobalt are subject to linkage mechanisms, facilitating pass-through. But items like copper, 6F, separators, electrolyte require case-by-case negotiation, creating lag and exposure that the company must partially absorb.
b. Project-based fixed pricing in storage caused short-term cost inversion: Many storage orders were signed when lithium was low, yet delivered after prices rose. CATL had to bear the cost increase without immediate price adjustments, compressing unit margins in storage and dragging blended GPM.
2) Post-2027 capacity ramp risks a supply-demand reset if demand growth slows
The market already knows CATL’s 2026 production target of 1.2 TWh (+50%+ YoY), so the core question is not whether 2026 demand stays strong. Rather, robust 2026 shipments may not drive further material profit upgrades or multiple expansion, with many investors locking in gains after a 6–9 month rerating.
Absent fresh growth drivers or a material earnings beat, investors are reluctant to re-rate solely on 2026 delivery. Valuation upside now hinges more on the 2027 outlook.
Hence the focus shifts to 2027 demand growth, with key concerns:
a. NEV growth is slowing: Purchase tax benefits keep fading, and domestic NEV penetration is already high (Est. 59% in 2026, 64% in 2027). Sales growth is expected to slow to ~11% in 2026 and ~8% in 2027.
b. Uncertainty on storage demand growth: The market is split on whether the super-cycle of the past two years can extend into 2027. During 2026–2027, the early stage of the 15th Five-Year Plan, some policies may adjust or taper.
JP Morgan estimates domestic storage demand growth could slow to ~25% in 2027 and to ~4% in 2028. As storage shipments typically lead installations by ~6 months, a shipment slowdown could first show in 2H27.
c. Oversupply risks from a new capacity wave: From 2H26, the industry enters a new round of concentrated capacity release. Effective capacity in 2027 could rise by ~40%, reviving memories of the 2023–2024 oversupply cycle and price wars.
That said, global lithium battery demand growth above 20% in 2027 remains the base case, with an optimistic scenario at ~25%. This is still a notable deceleration vs. the ~45% expected in 2026.
Meanwhile, the Gov. has tightened supply-side governance (centralizing expansion approvals, categorizing enterprises), with new capacity likely to tighten from 2H27. Thus, while margins may normalize from peak, a repeat of 2023–2024’s severe price shock and earnings collapse looks unlikely.
3) Reinstated battery consumption tax will weigh on profit delivery:
On Jul 17, 2026, China’s Ministry of Finance, General Administration of Customs, and State Taxation Administration jointly issued a notice to reinstate consumption tax on primary lithium and lithium-ion batteries. From Sep 1, 2026, the initial rate will be 2%, rising to the standard 4% from Sep 1, 2027.
Next-gen batteries (sodium-ion, solid-state, fuel cells, advanced PV) are exempt from Sep 1, 2026 to Dec 31, 2028. For CATL, a 2%/4% rate implies RMB 10/20 per kWh, though 30%+ of shipments are overseas and exempt.
Assuming no pass-through, profit drag is estimated at 7%–14%. With 50% pass-through, the drag is estimated at 3.5%–7%.
Accordingly, Dolphin Research models 2026 full-year shipments at ~980 GWh (+~48% YoY), with ~760 GWh in power (+41% YoY) and ~220 GWh in storage (+82% YoY). Given lithium inflation and the consumption tax, 2026 net profit per Wh is estimated at only ~RMB 0.10/Wh, implying 2026 net profit of ~RMB 98.0bn (+~36% YoY).
We apply a 30x PE for the H-share in an upcycle, implying RMB 2.94tn under a neutral-to-bullish case. That is ~18% upside vs. CATL’s current ~RMB 2.5tn market cap.
On 2027, under our base case we expect battery shipments to rise ~25% YoY to ~1,225 GWh. We estimate 2027 net profit per Wh at ~RMB 0.096/Wh (-4% vs. 2026, reflecting tax and supply-demand concerns), implying 2027 net profit of ~RMB 117.6bn (+~20% YoY).
We assign 22x–25x 2027E PE for CATL H-shares (a discount vs. 30x in 2026 to reflect slowing growth), implying RMB 2.6tn–2.94tn under base case. Upside appears more limited at current valuation.
Thus, while CATL remains a high-certainty play within the lithium upcycle, upside implied by today’s valuation is constrained. Investors are tracking CATL’s negotiations with upstream suppliers on 2027 capacity planning (typically begins in Dec, but started early in Sep 2025), with visibility on 2027 demand being the focal point.
Dolphin Research suggests gradually locking in gains when H-share valuation approaches RMB 3.0tn. Exceptions would be a notable easing of lithium inflation’s pressure on unit profits, or a material beat on 2027 production plans, which could drive simultaneous EPS and multiple upgrades.
Details below:
I. Revenue in line, but GPM declined
1. Revenue growth remained strong, validating the upcycle
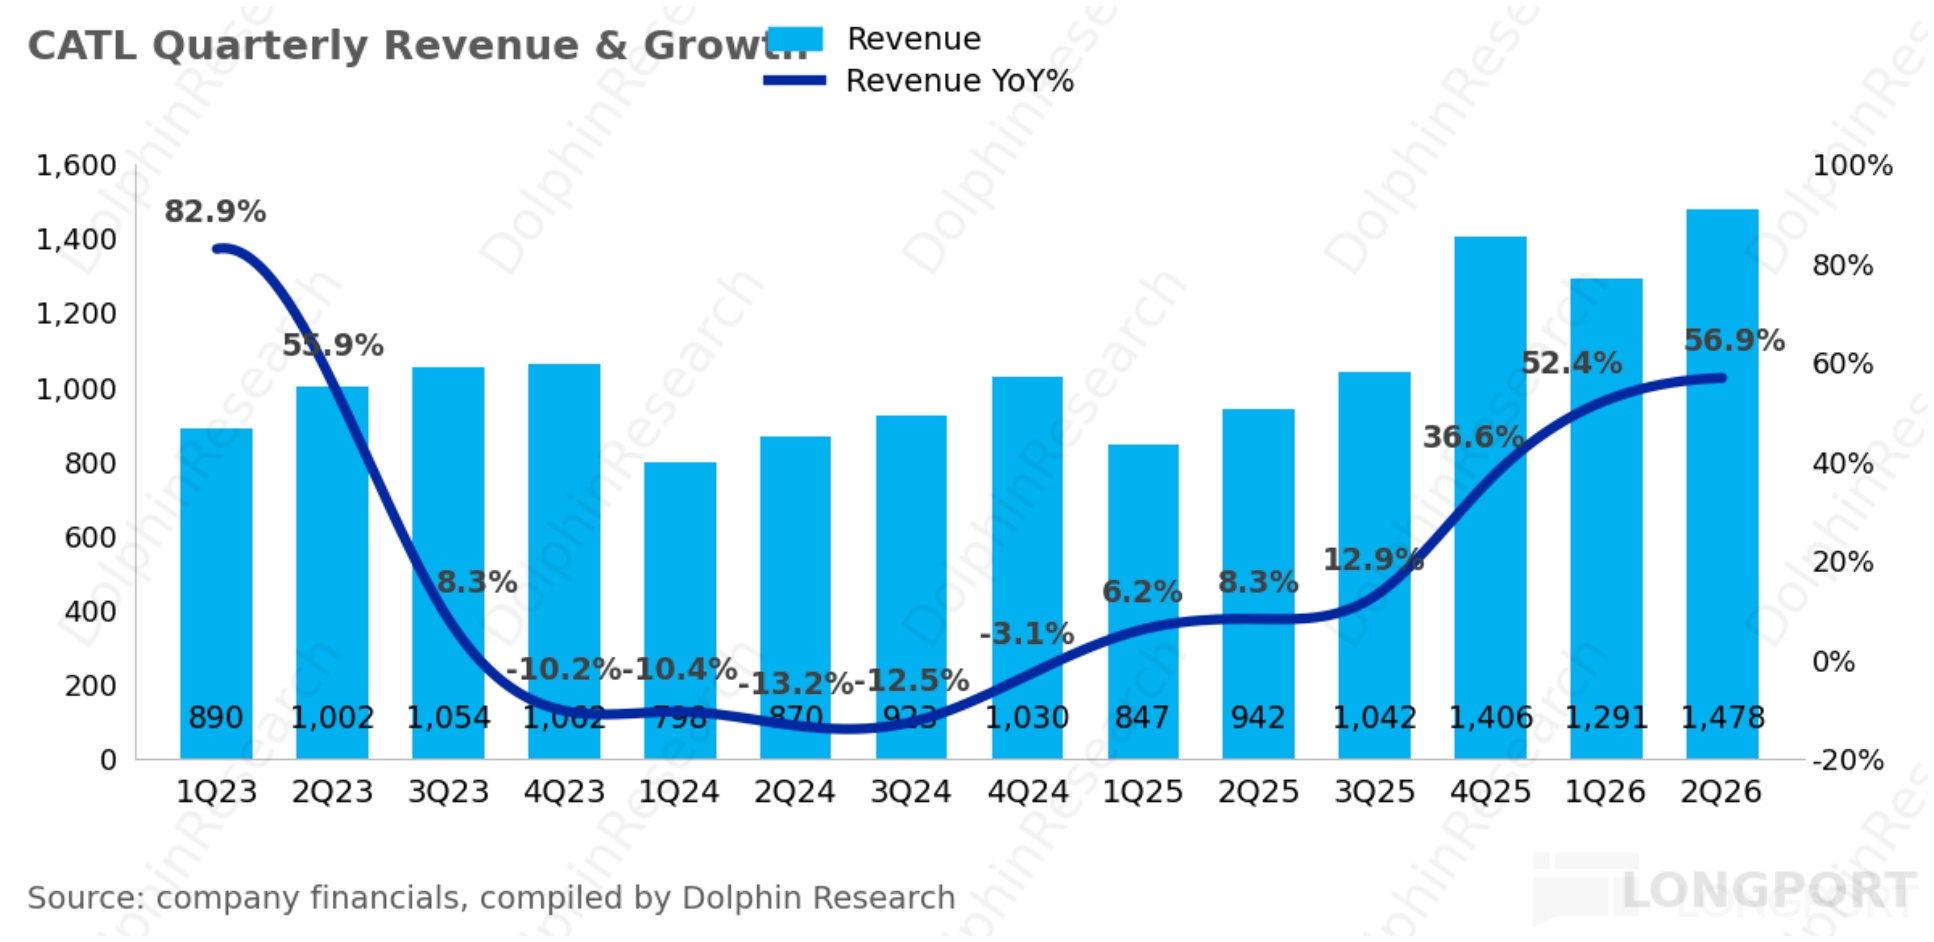
Q2 2026 revenue was RMB 147.8bn, up 57% YoY and in line with the RMB 148.6bn consensus. This continues to validate the upcycle thesis.
Growth was volume-led (Q2 shipments +~55% YoY) while ASPs stayed largely stable despite lithium carbonate moving higher. No notable price hikes were observed.
1.1 Battery shipments: above expectations
In Q2, CATL shipped ~232 GWh, up ~55% YoY and above the 222 GWh consensus. Within that:
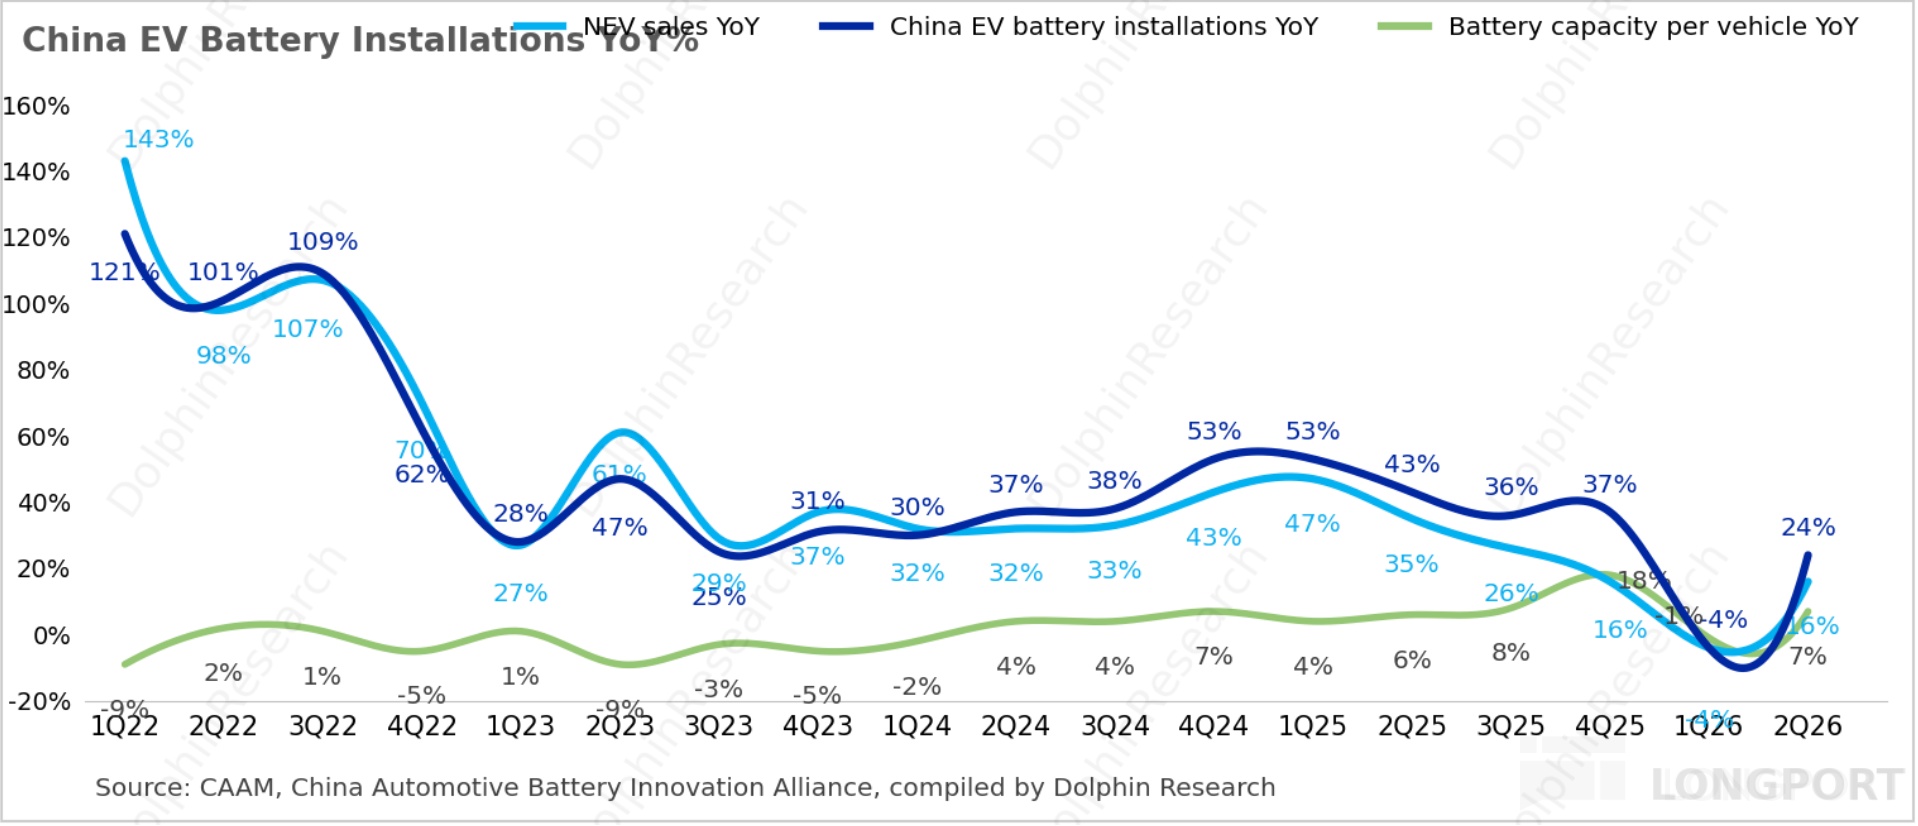
1) Power batteries shipped 174 GWh, +~45% YoY, outpacing domestic NEV sales growth (~16% YoY) and China power battery sales growth (38% YoY), widening the spread. Share gains remain evident.
Industry beta: higher kWh per vehicle and leverage from high-kWh commercial vehicles:
a. kWh per vehicle continues to rise:
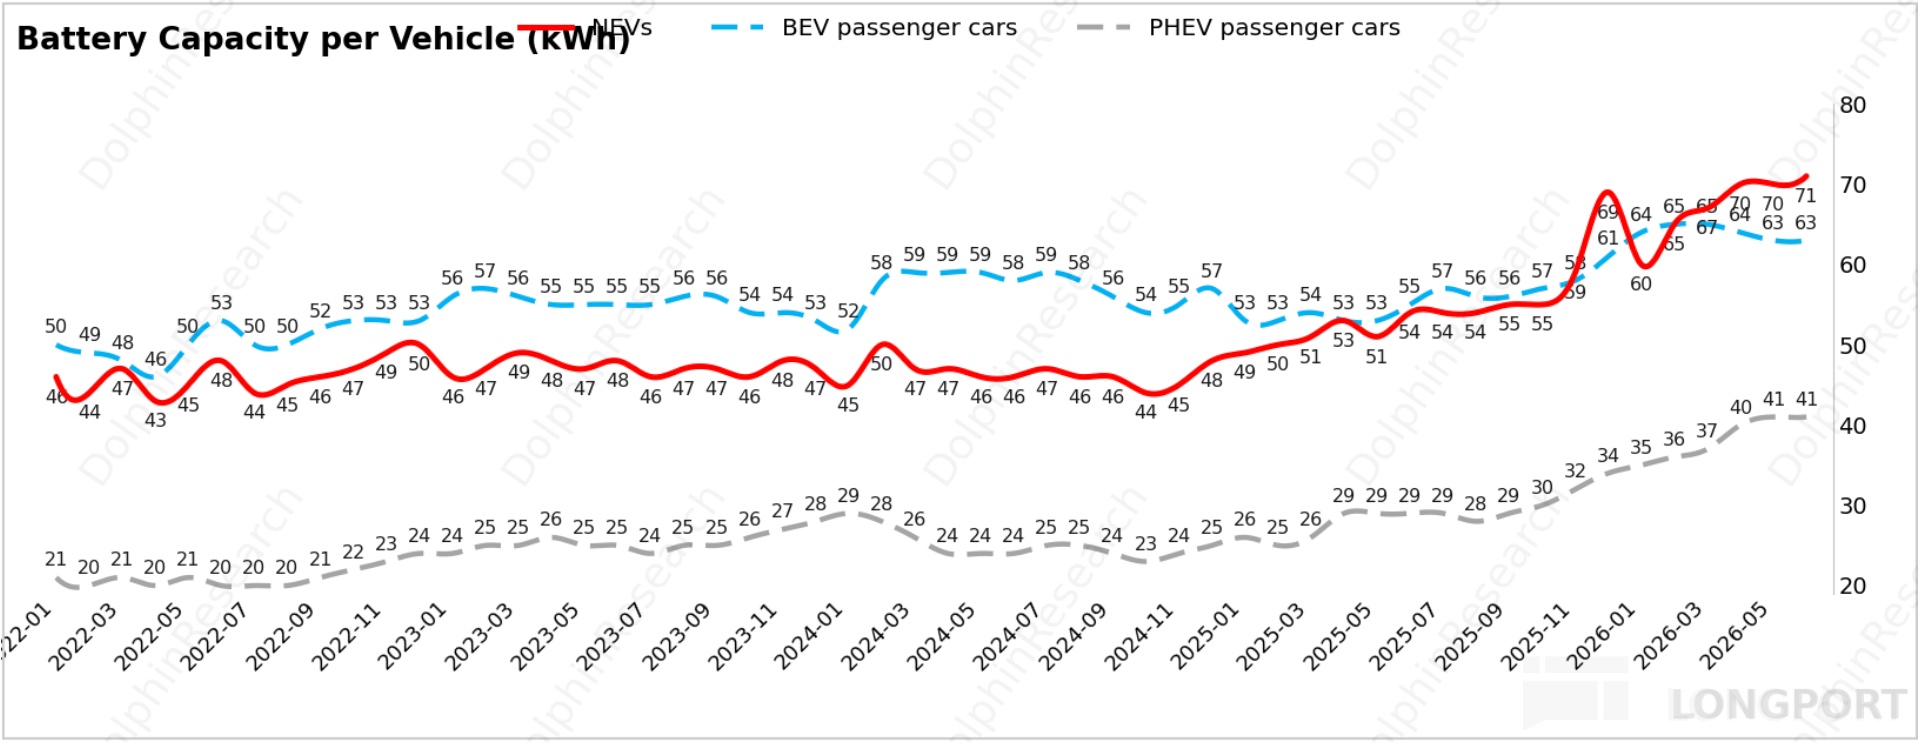
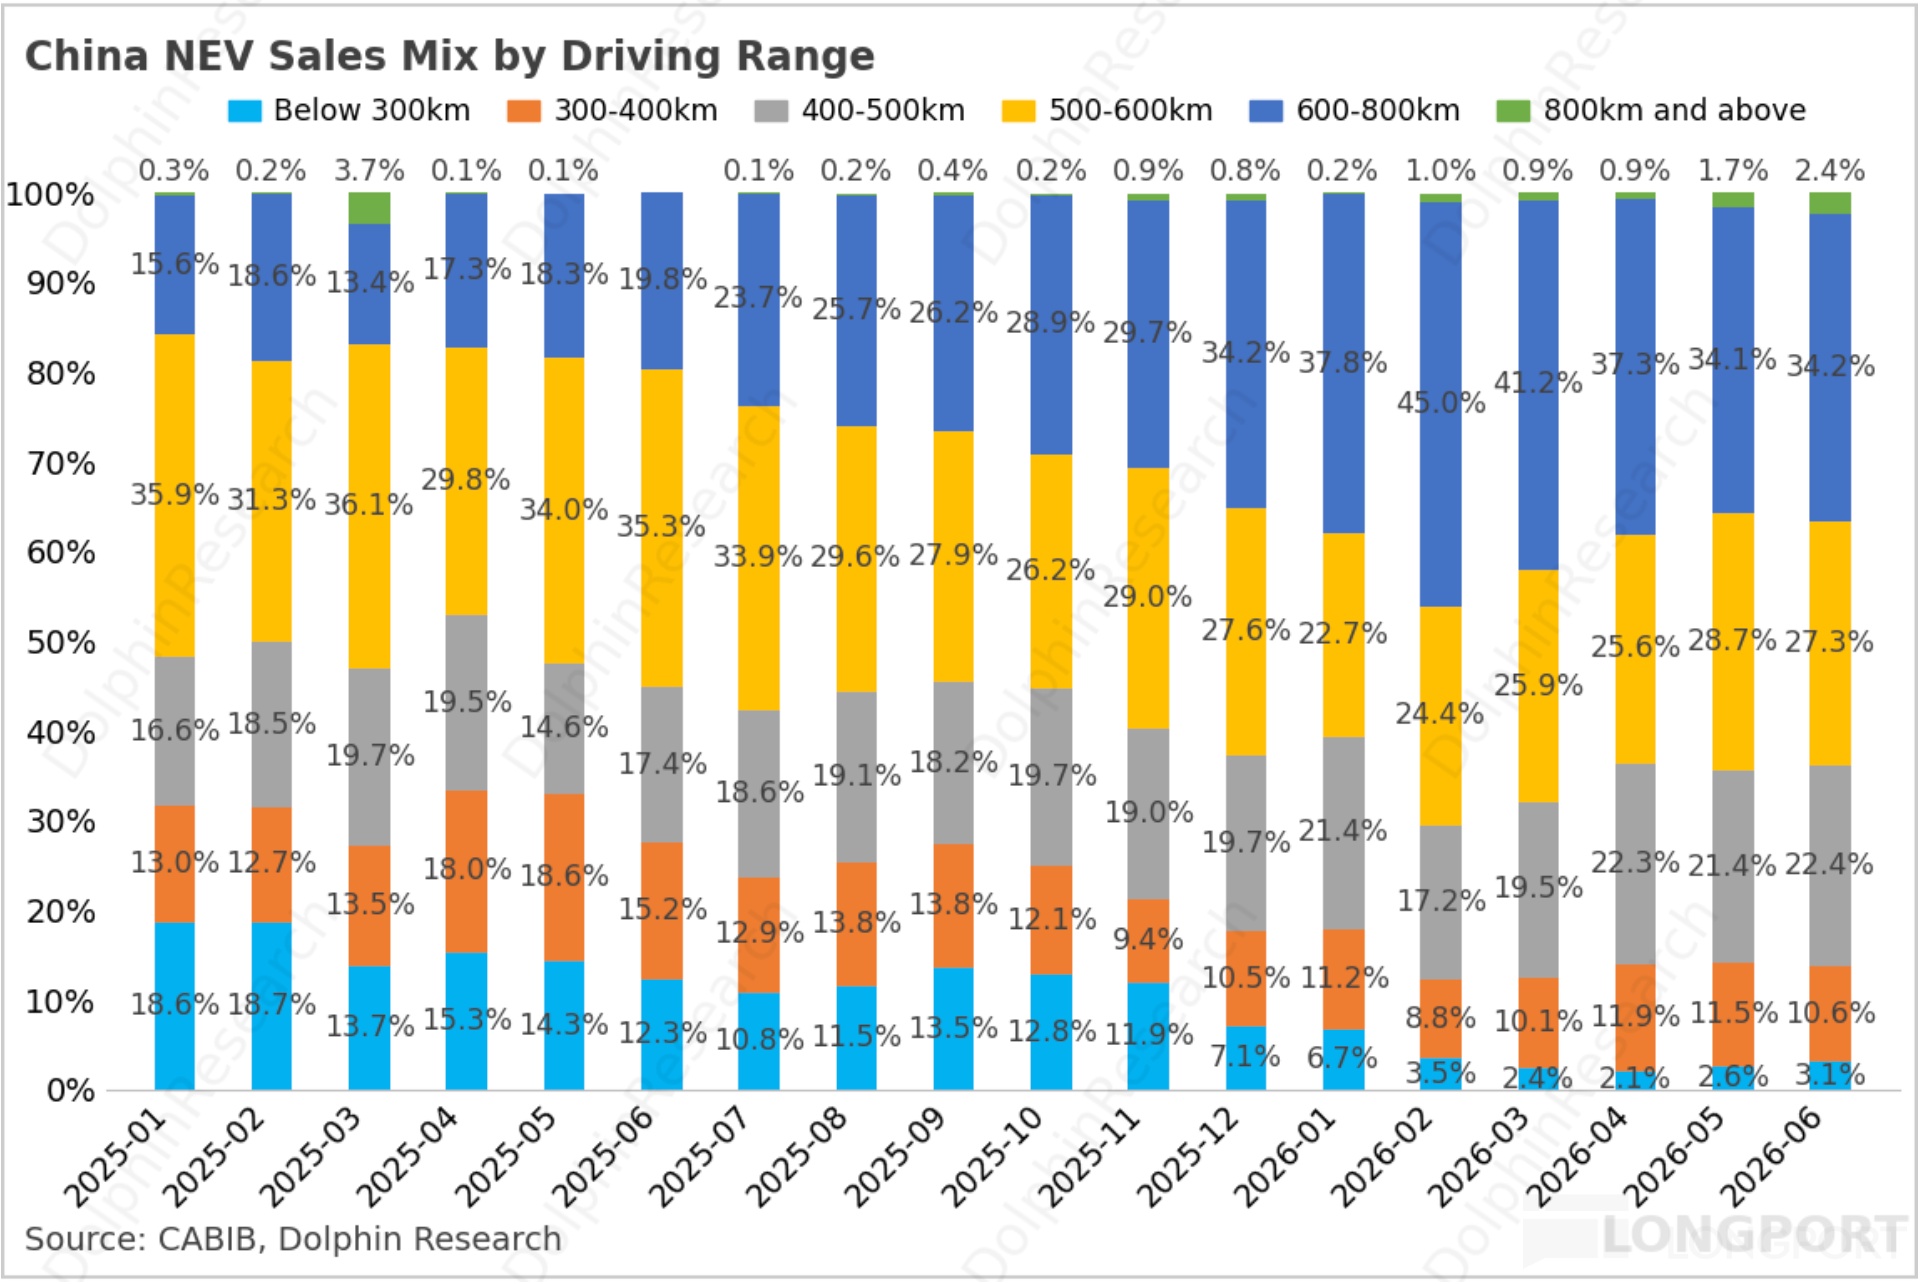
In Q2, the BEV mix kept rising, up ~4ppt QoQ to 69%, structurally lifting kWh per vehicle. Per CABIA, 1H26 China NEV average kWh per vehicle was 69 kWh, +34% YoY, with PHEVs seeing even faster kWh gains.
For BEVs, larger packs are trending: 1H26 BEV passenger cars averaged 64 kWh, +19% YoY. To address range anxiety and boost the premium mix, OEMs are rolling out bigger packs as standard, e.g., Nio moving to 100 kWh, Xiaomi SU7 mid-high trims above 96 kWh.
Models with 600–800km range rose from 17% in 1H25 to 38% in 1H26, while sub-300km models fell sharply. This mix shift supports higher kWh per vehicle.
EREVs are trending toward ‘more electric’: 1H26 PHEV passenger cars averaged 39 kWh, +41% YoY. The ‘big battery + small fuel tank’ combo is becoming standard for PHEVs such as Leapmotor D series and Li Auto L series.
b. Leverage from high-kWh commercial vehicles
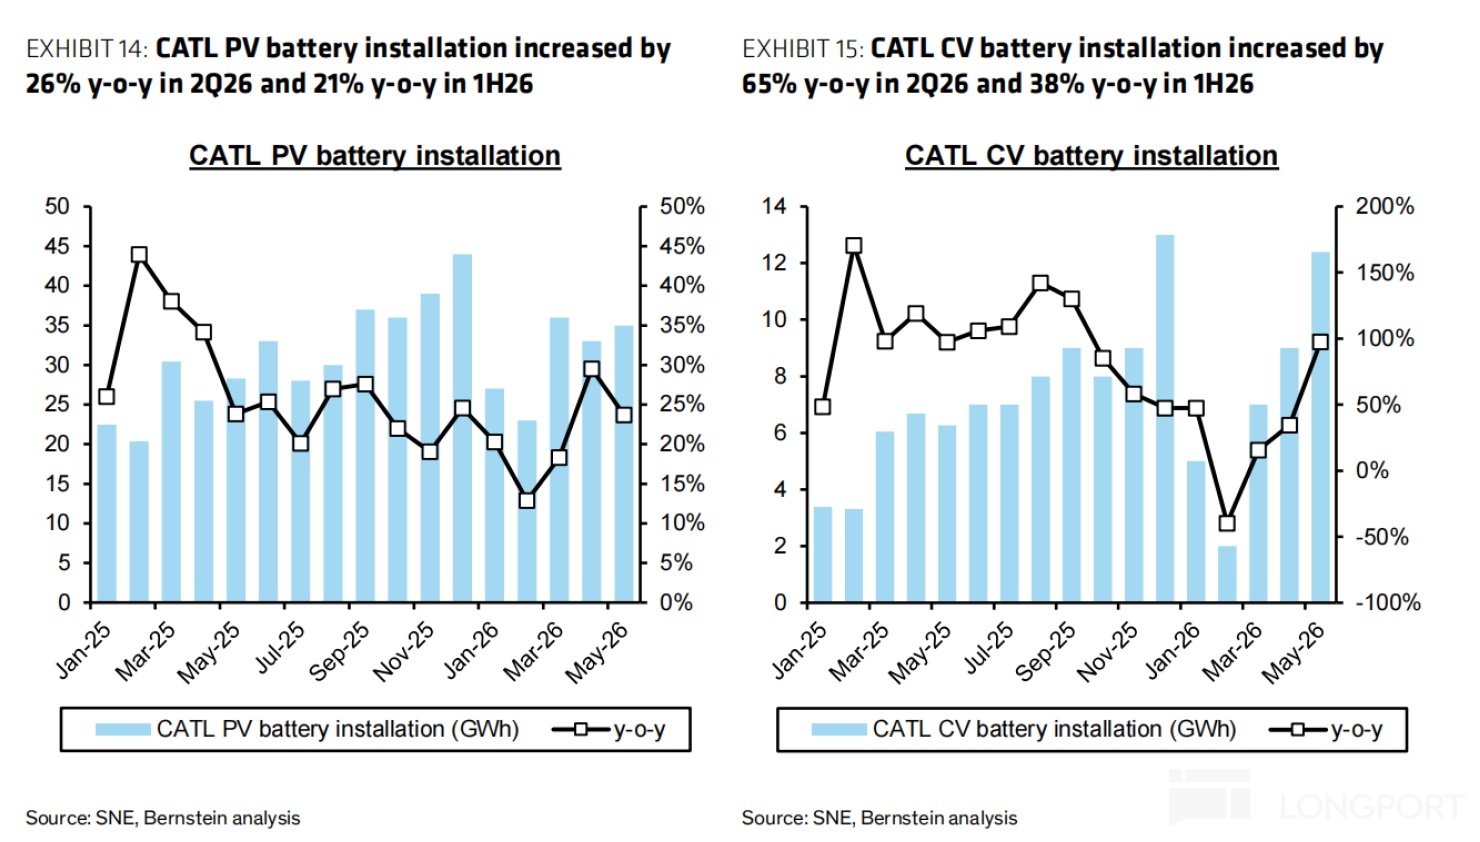
Penetration of high-kWh commercial vehicles surged, unlocking demand leverage: Q2 domestic NEV commercial vehicle sales reached 350k units, +50% YoY (accelerating from +18% in Q1). Penetration rose 7.7ppt YoY to 29.3%, helped by TCO advantages from lower battery costs and supportive road-access policies.
Electric trucks average ~220 kWh per vehicle, over 3x passenger EVs (~69 kWh), creating significant leverage for battery demand. CATL holds ~60% share in commercial vehicle batteries and benefits disproportionately.
Company alpha: global share keeps rising
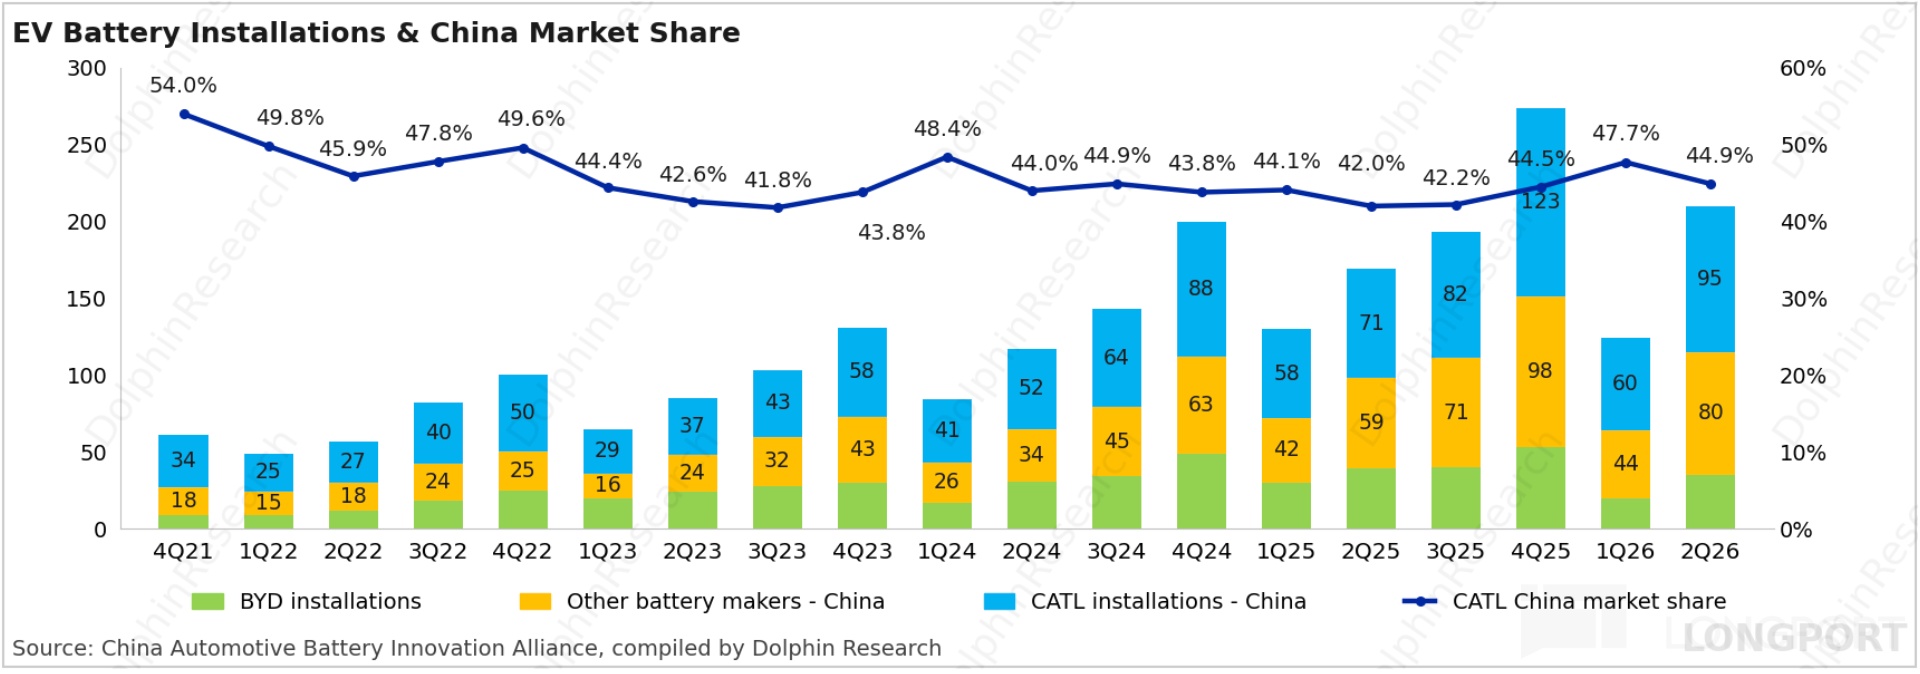
Capacity release tightened the competitive spread domestically: Jan–Jun 2026 passenger-car installation share rose to 46.7% (+5.6ppt YoY), validating the post-ramp share recovery. In ternary power batteries domestically, share reached 75.2% (+4.3ppt YoY).
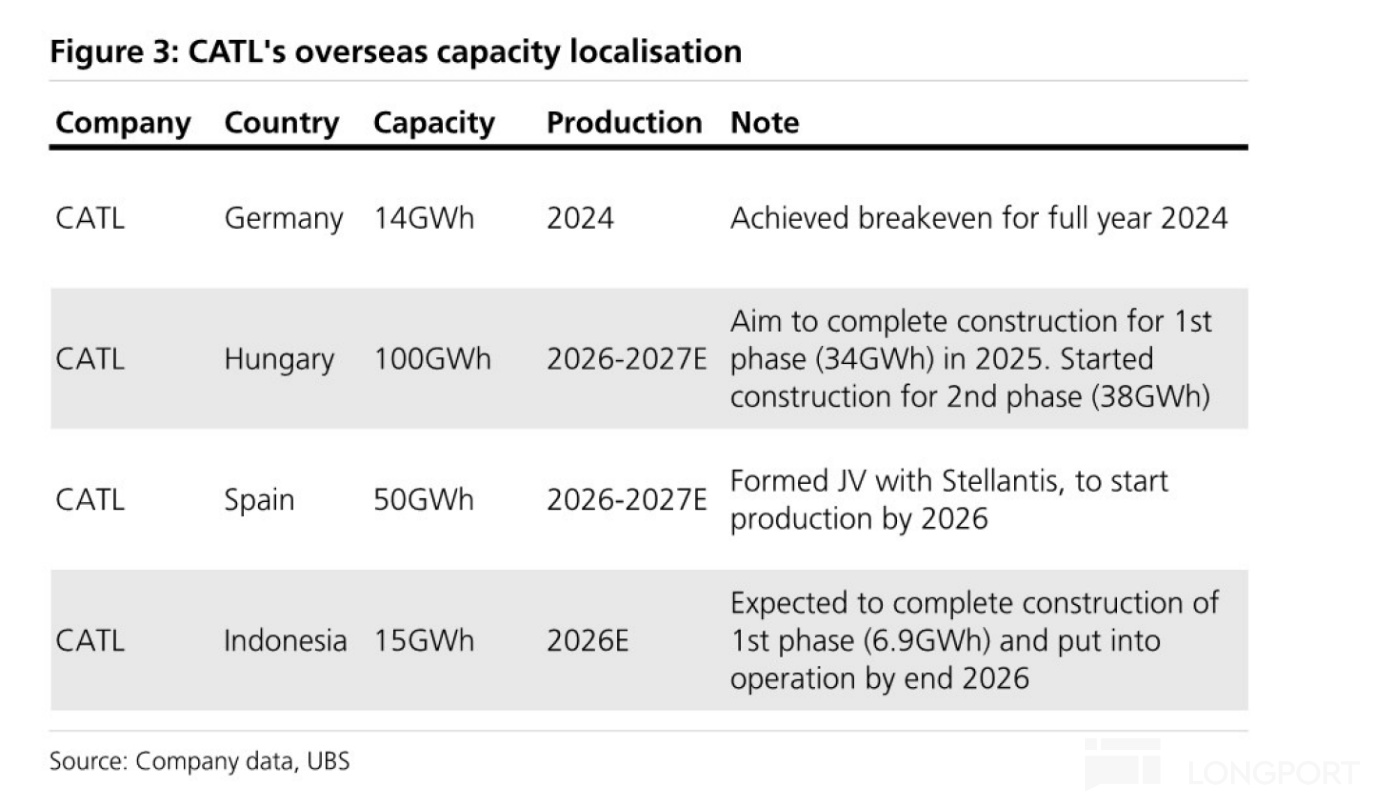
Global capacity build and product edge: per SNE, overseas share was 33.7% in Jan–May 2026 (+~3.7ppt YoY). With overseas plants maturing — Germany (14 GWh) stable and profitable, Hungary (100 GWh) Phase 1 about to start, Spain (60 GWh) under preparation — plus product rollout such as Shenxing ultra-fast, Qilin, and the sodium platform Naxtra, global share is set to rise further.
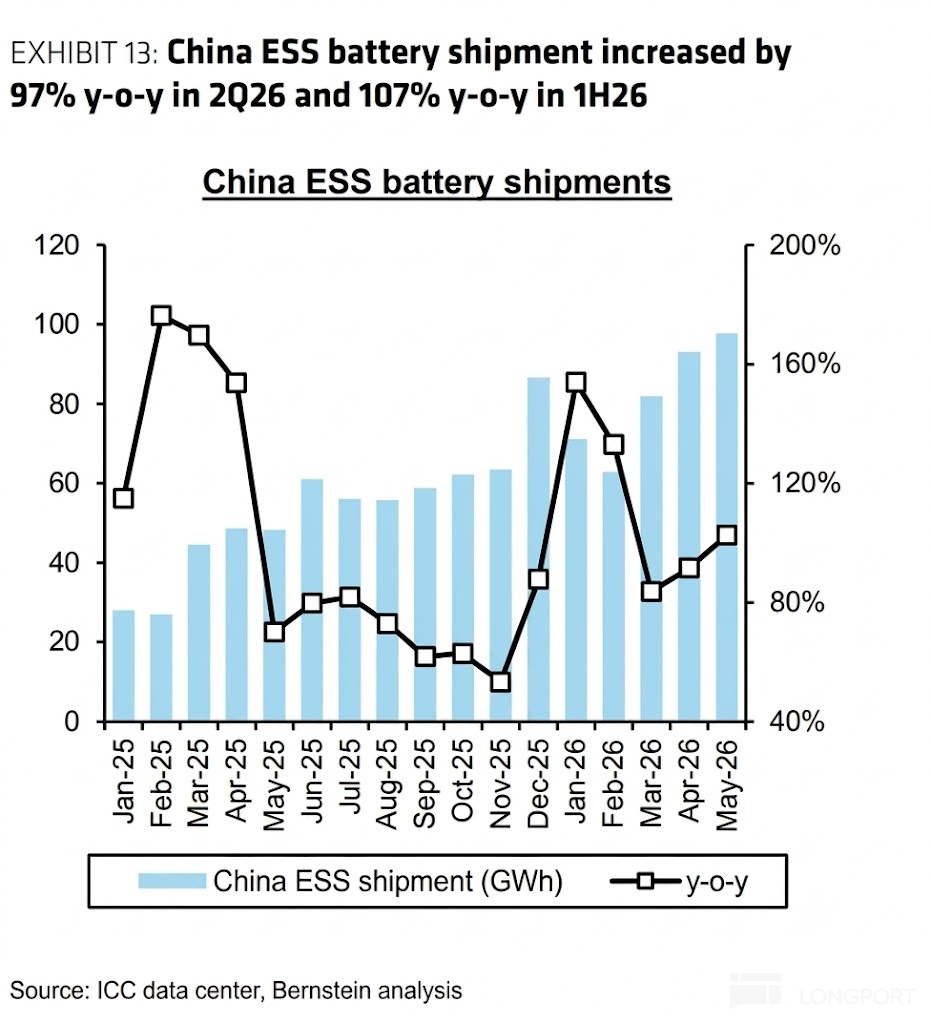
2) Storage shipments nearly doubled: Q2 storage shipments were ~58 GWh, +93% YoY, sustaining exceptional momentum and in line with sector strength (China storage battery sales +97% YoY in Q2 2026). This reflects strong end-demand and capacity relief from the Jining site (planned 100+ GWh) that began ramping in Q1 2026.
Globally, storage battery demand is expected to grow ~86% in 2026, likely topping 1 TWh. Drivers include:
1) Grid parity triggering global just-in-demand: As battery costs fall, ‘renewables + storage’ has reached grid parity across many regions. Rising wind/solar additions (2024 new wind/solar >700 GW globally) are creating grid-balancing needs, shifting storage from policy-driven to market-driven.
2) China’s standalone storage model is proven: capacity tariffs, spot arbitrage, and ancillary services have lifted IRR, with tenders and filings beating expectations. This supports >60% growth in 2026 domestic installations.
3) AI data centers make storage a must-have for grid access and cost management. The AIDC build-out is a structural tailwind.
b. ASPs broadly flat QoQ despite lithium uptrend
On ASPs, lithium carbonate stabilized at a high RMB 150k–200k/ton in Q2 from RMB 70k–100k/ton in 2H25, yet CATL’s blended battery ASP was only ~RMB 0.56/Wh, broadly flat vs. 2H25. We see three factors:
1) Higher mix of lower-priced storage batteries: Storage share rose from ~17% in 2H25 to ~25% in 1H26. With a 50–60% domestic and 40–50% overseas split in storage, a larger domestic low-price mix further pulled down blended ASP.
2) Slower pass-through in storage vs. power batteries: 1H26 power battery ASP was ~RMB 0.59/Wh (+~4% vs. 2H25) with relatively smooth pass-through. But storage ASP was ~RMB 0.49/Wh (-~3% vs. 2H25), a stark contrast.
The root cause lies in pricing mechanisms. Power batteries track lithium via established linkages with a 1–2 month lag, while storage is dominated by project-based fixed pricing at tender, leaving suppliers exposed when lithium rises later.
Thus, storage contracts signed at low lithium levels are delivered when input costs are high, and the spread must be absorbed or recouped in future tenders. This dilutes near-term unit margins and ASPs for storage.
3) CATL’s strategic choice: Amid lithium’s rapid rebound, CATL kept prices steady to expand share, especially with substantial capacity coming on line. Domestic passenger-car share rose to ~47% in 1H26 from ~41% in 2025, showing the strategy works.
This is effective as automakers seek cost stability and secure supply, helping CATL consolidate leadership during industry consolidation. Share-first enhances long-term positioning.
2. GPM continued to decline QoQ
Q2 2026 blended GPM was 23.2% vs. 25.0% expected and down 160bps from 24.8% in Q1. While revenue rose 57% YoY, GP rose only ~42% YoY, with unit GP dropping from ~RMB 0.18/Wh in Q4 2025 to ~RMB 0.15/Wh in Q2 2026.
By segment, both power and storage margins fell: power down 4.2ppt QoQ to 20.6%, storage down 3.7ppt to 24.0%. Dolphin Research sees three drivers:
1) Material cost inflation with pass-through lag and exposure: Lithium carbonate jumped from RMB 70k–100k/ton in 2H25 to RMB 150k–200k/ton in 1H26, nearly doubling. Copper, aluminum, LiPF6, and processed materials like foil, electrolyte, separators also rose.
While some inputs (lithium, nickel, cobalt) pass through via linkage, non-linked items (copper, 6F, separators, electrolyte) require negotiation and lag. The blended GPM decline shows CATL could not fully offset non-linked cost inflation and storage project lock-in during the rapid lithium rebound.
2) Storage project fixed pricing created short-term cost inversion: Orders signed at low lithium levels were delivered after prices rose, leaving CATL to absorb the delta. This directly compressed storage unit margins and dragged blended GPM.
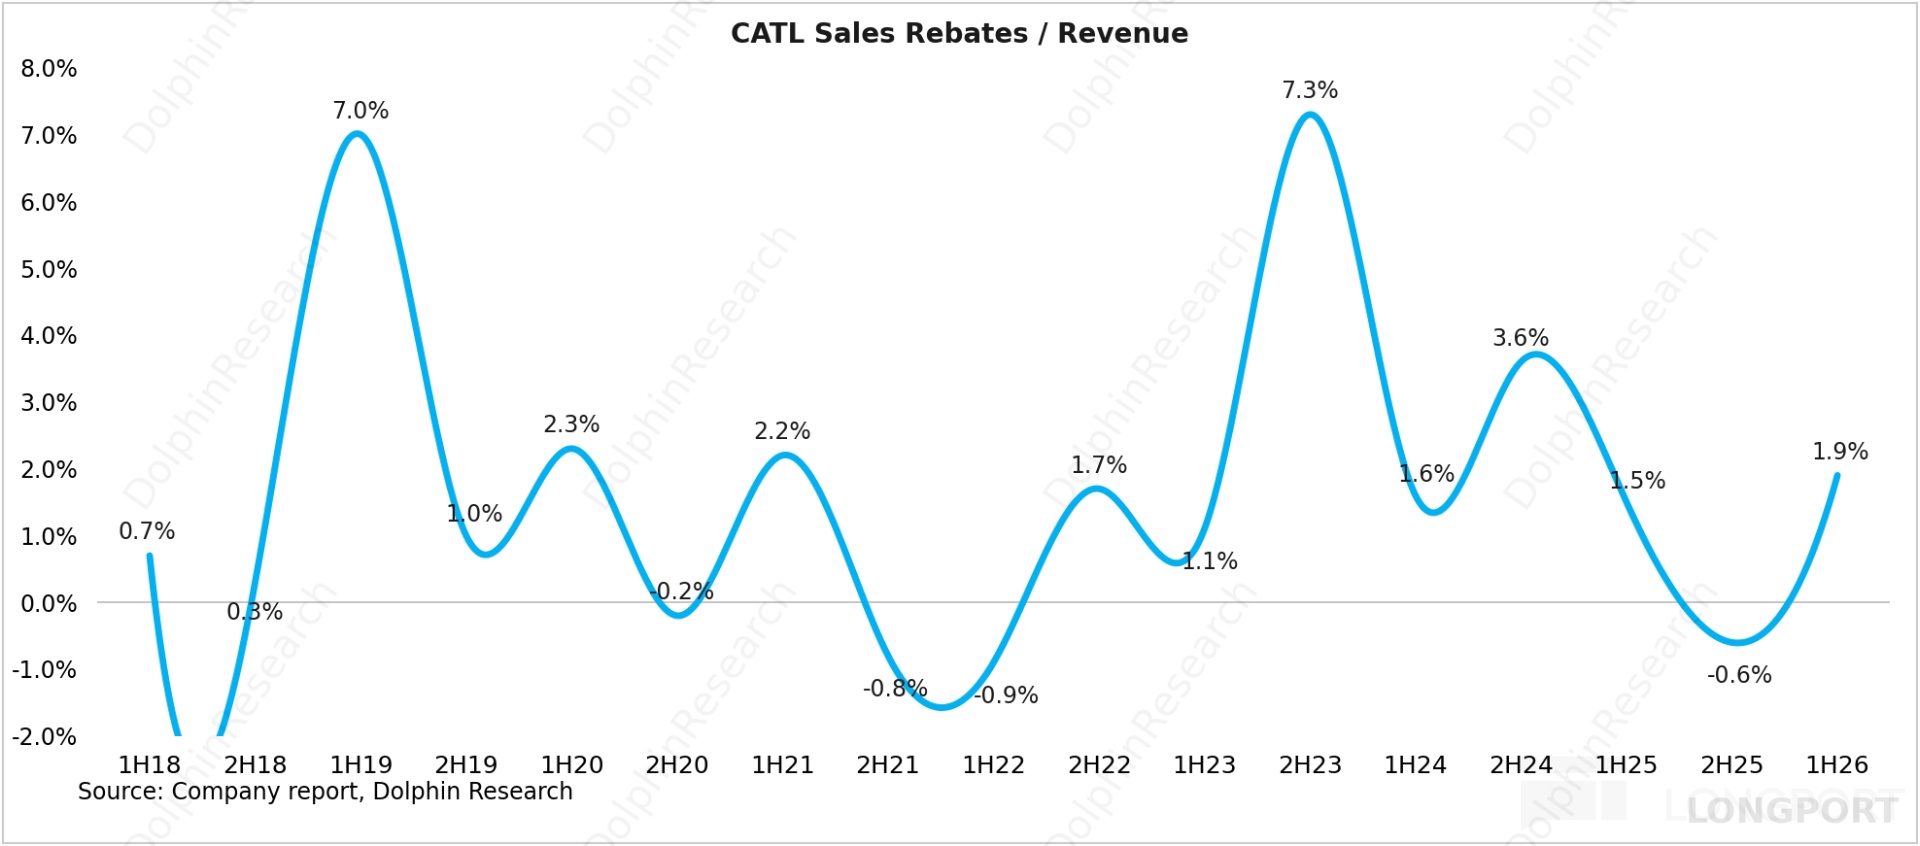
3) Higher sales rebates: Contracts signed during low-lithium periods included rebates, with 1H26 rebates estimated at ~2% of revenue. This trimmed GPM but aided share expansion during industry consolidation.
II. Upcycle thesis intact; end-demand remains strong in 2026
1) Utilization remains high
1H26 utilization was 95%, up 5ppt YoY from 90% in 1H25, affirming strong demand. In 2025, utilization reached 97%, causing capacity bottlenecks and some share loss in global storage and China commercial vehicles.
In 2026, CATL raised its production target to 1.2 TWh (+50%+ YoY). With >400 GWh of new capacity released, utilization stays high but absolute capacity is much larger, alleviating bottlenecks and enabling more orders.
Impact is visible: Jan–Jun 2026 domestic PV market share rebounded to ~47% from ~41% in 2025, validating the share-recoup logic post ramp. Capacity has become less of a constraint.
2) Capex re-accelerates; the TWh era of capacity
On capex, although CATL passed its intensive expansion phase in 2021–2022, spending fell from Q4 2022 on oversupply and competition and hit a trough of ~RMB 6.7bn in Q4 2023. Since Q4 2024, capex has re-accelerated, reaching ~RMB 12.7bn in Q2 2026, near the prior peak.
As noted, the 2026 production target is now 1.2 TWh (+50%+ YoY), with annualized capacity at ~1,050 GWh. CIP reached ~764 GWh in Q2 2026, up ~1.4x vs. ~320 GWh at end-2025, with most completion in 1–2 years.
Domestically, Jining (Shandong), Ruiqing (Guangdong), Yichun (Jiangsu), Xiamen (Fujian), Qinghai, and Ningde (Fujian) are all expanding. Jining’s new capacity (100+ GWh, focused on 587Ah large cells) began ramping in Q1 2026, easing storage constraints.
Overseas, Germany (14 GWh) has been profitable since 2024; Hungary (100 GWh) Phase 1 (~35 GWh) was completed by end-2025 and is about to start; Spain (50–60 GWh) has completed preliminary approvals and JV formation, with site preparation in 2026; Indonesia’s battery chain began production in 1H26. This broad release is lifting global share in 2026.
3) Inventory still rising fast
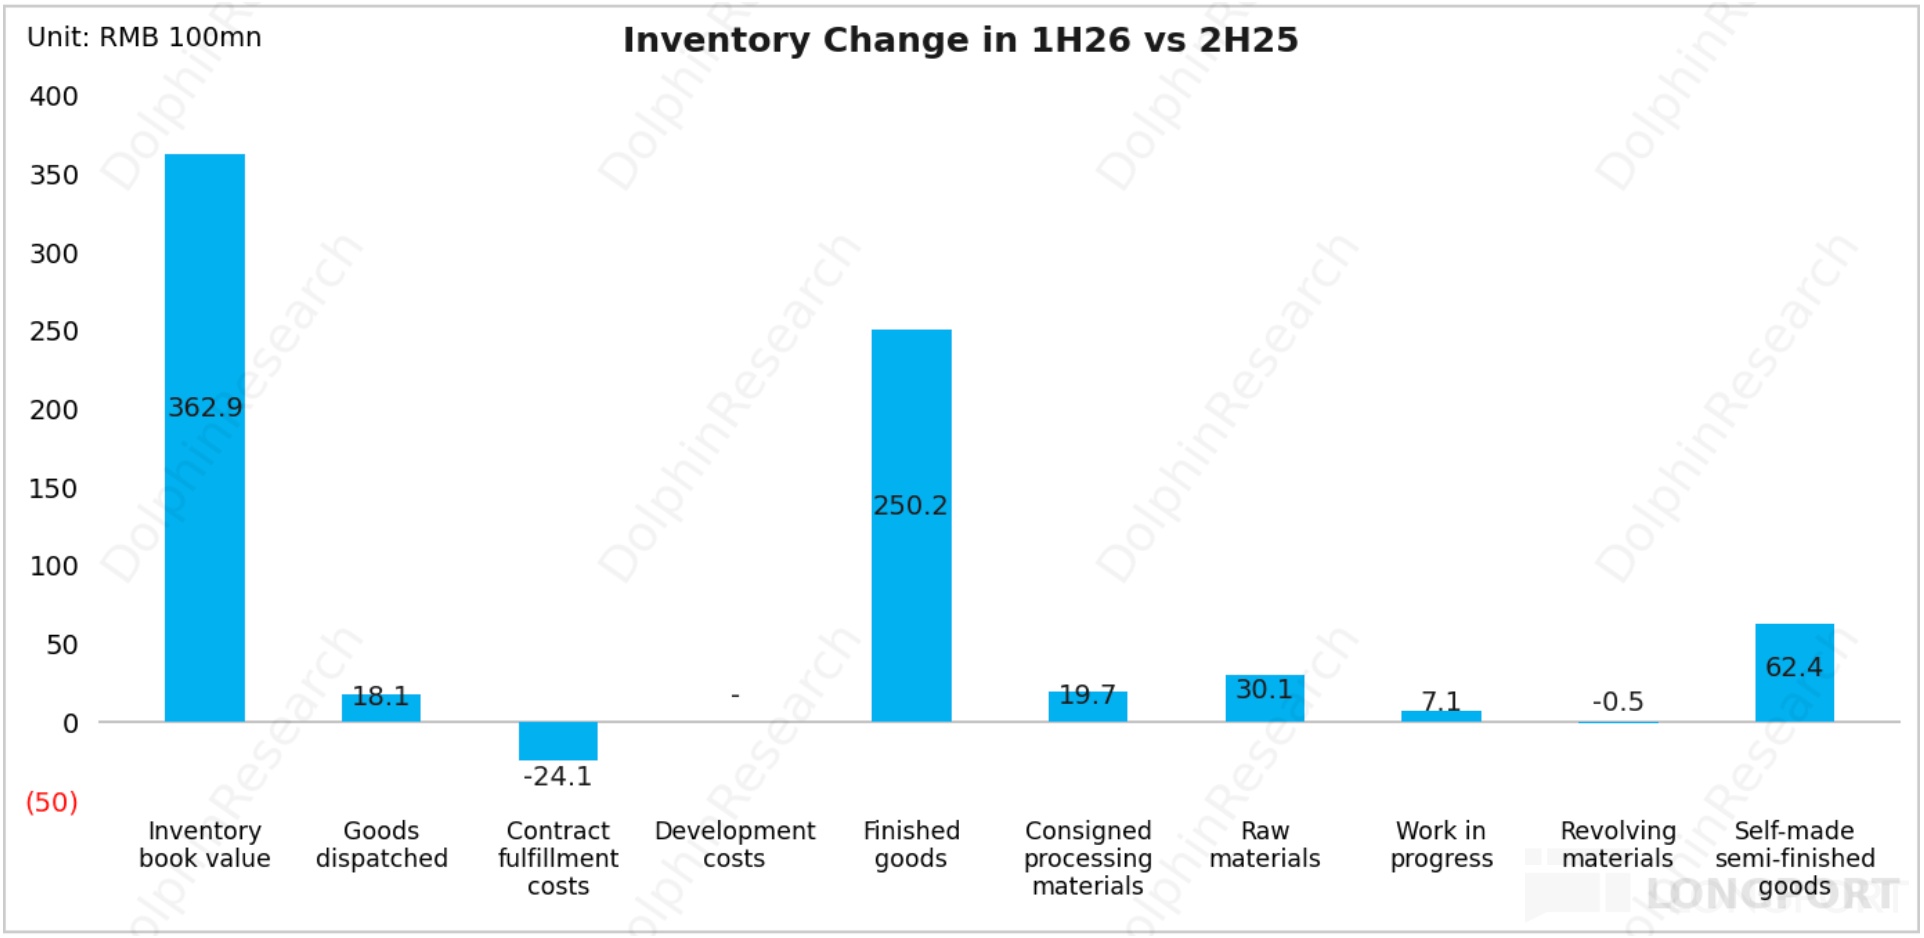
Inventory reached RMB 130.8bn this quarter, up ~RMB 21.9bn QoQ, a record high, and days on hand climbed to ~96 days. Of the RMB 36.3bn inventory increase in 1H26, ~69% was finished goods for 2H stocking.
Management said 2H demand is highly visible, and 2027 is also promising. About 5% of inventory was goods sent out but not yet invoiced, reflecting long project cycles in storage, longer-distance overseas deliveries, and higher system shipments vs. cells.
CATL also pre-stocked RMB 3.0bn of raw materials and RMB 6.2bn of WIP for 2H26 to hedge input inflation. Lower-cost inventories should offset part of raw-material headwinds.
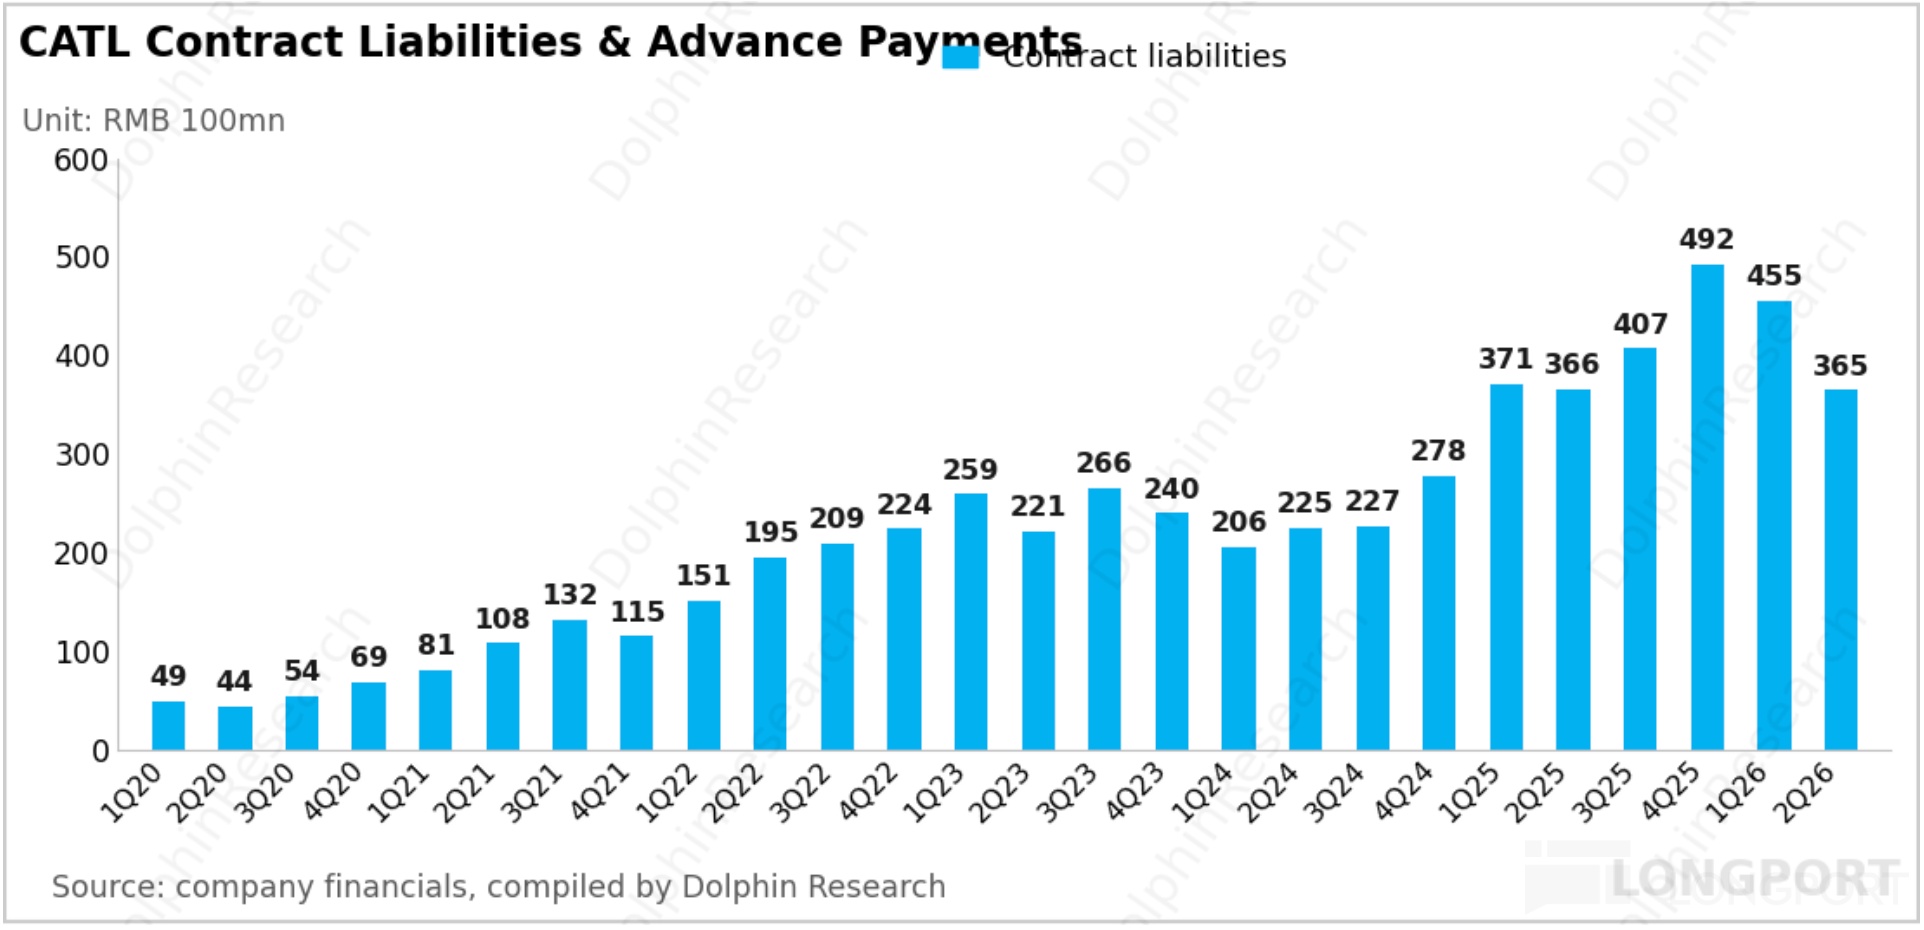
4) Contract liabilities declined, mainly on faster deliveries as capacity ramped
As a B2B business, CATL collects prepayments from downstream customers prior to delivery, so contract liabilities approximate order backlog. Q2 contract liabilities fell by ~RMB 9.1bn QoQ to ~RMB 36.5bn from ~RMB 45.5bn in Q1, but remain elevated historically.
Dolphin Research attributes this to capacity release enabling faster order conversion into revenue, as seen in Q2 shipments up 55% YoY. This normal run-off is reflected in lower contract liabilities.
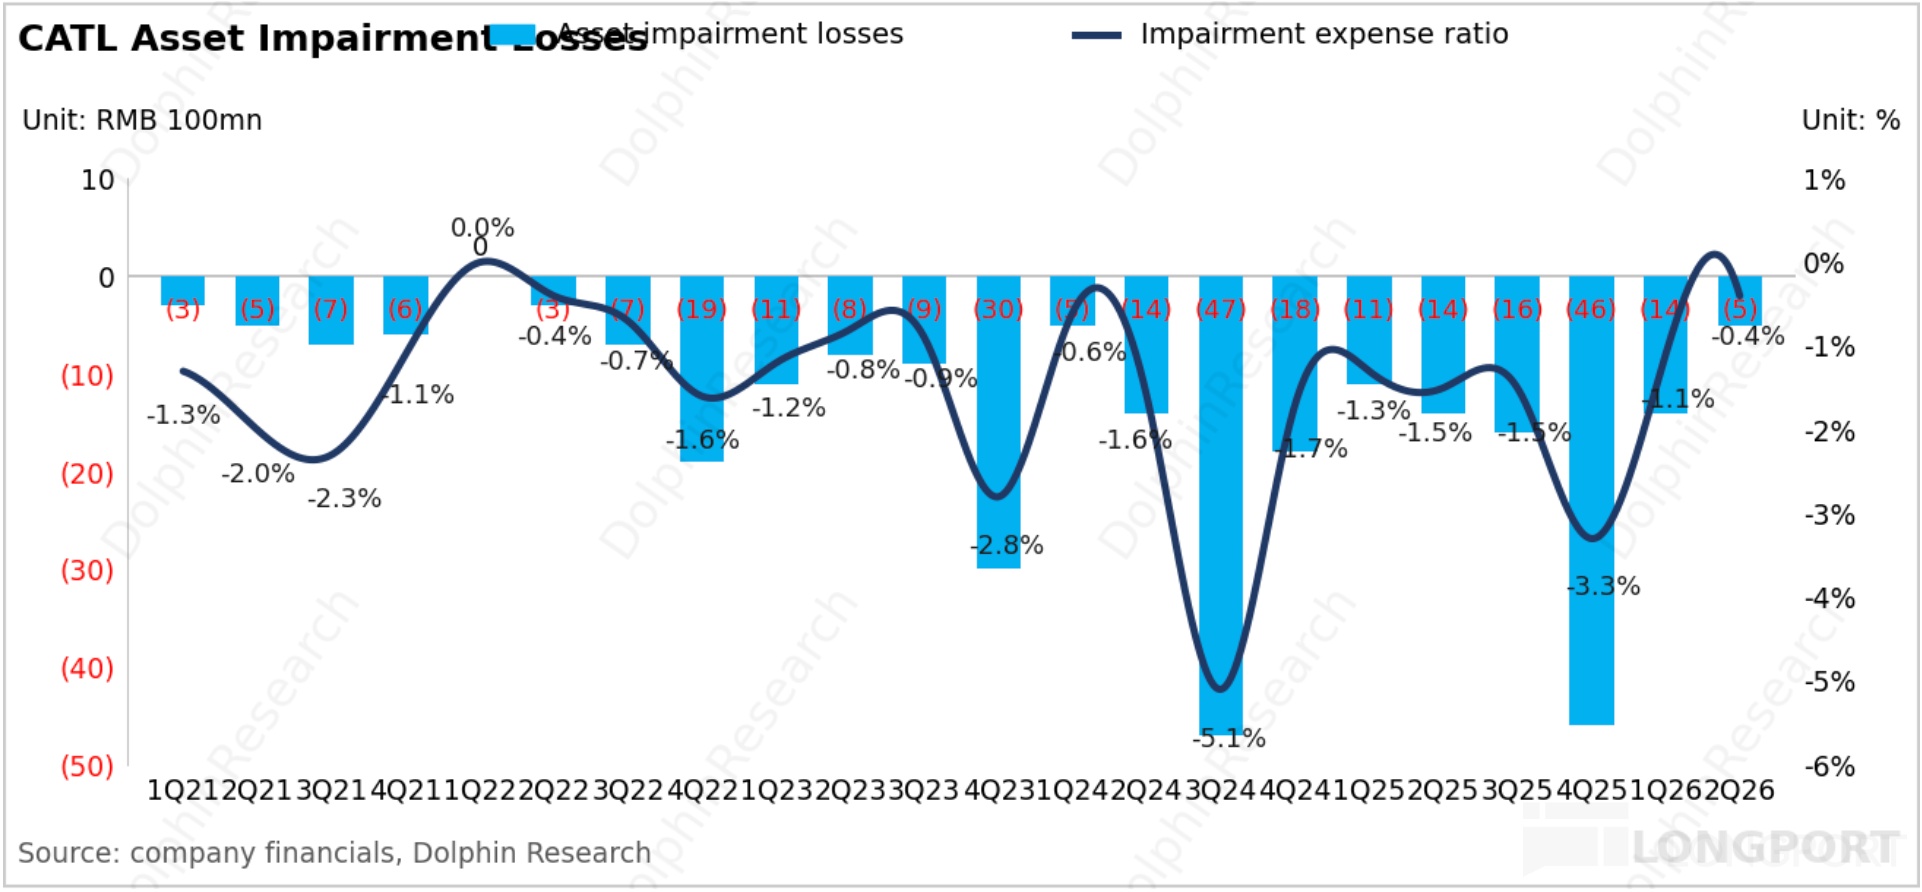
5) Impairment losses kept falling QoQ
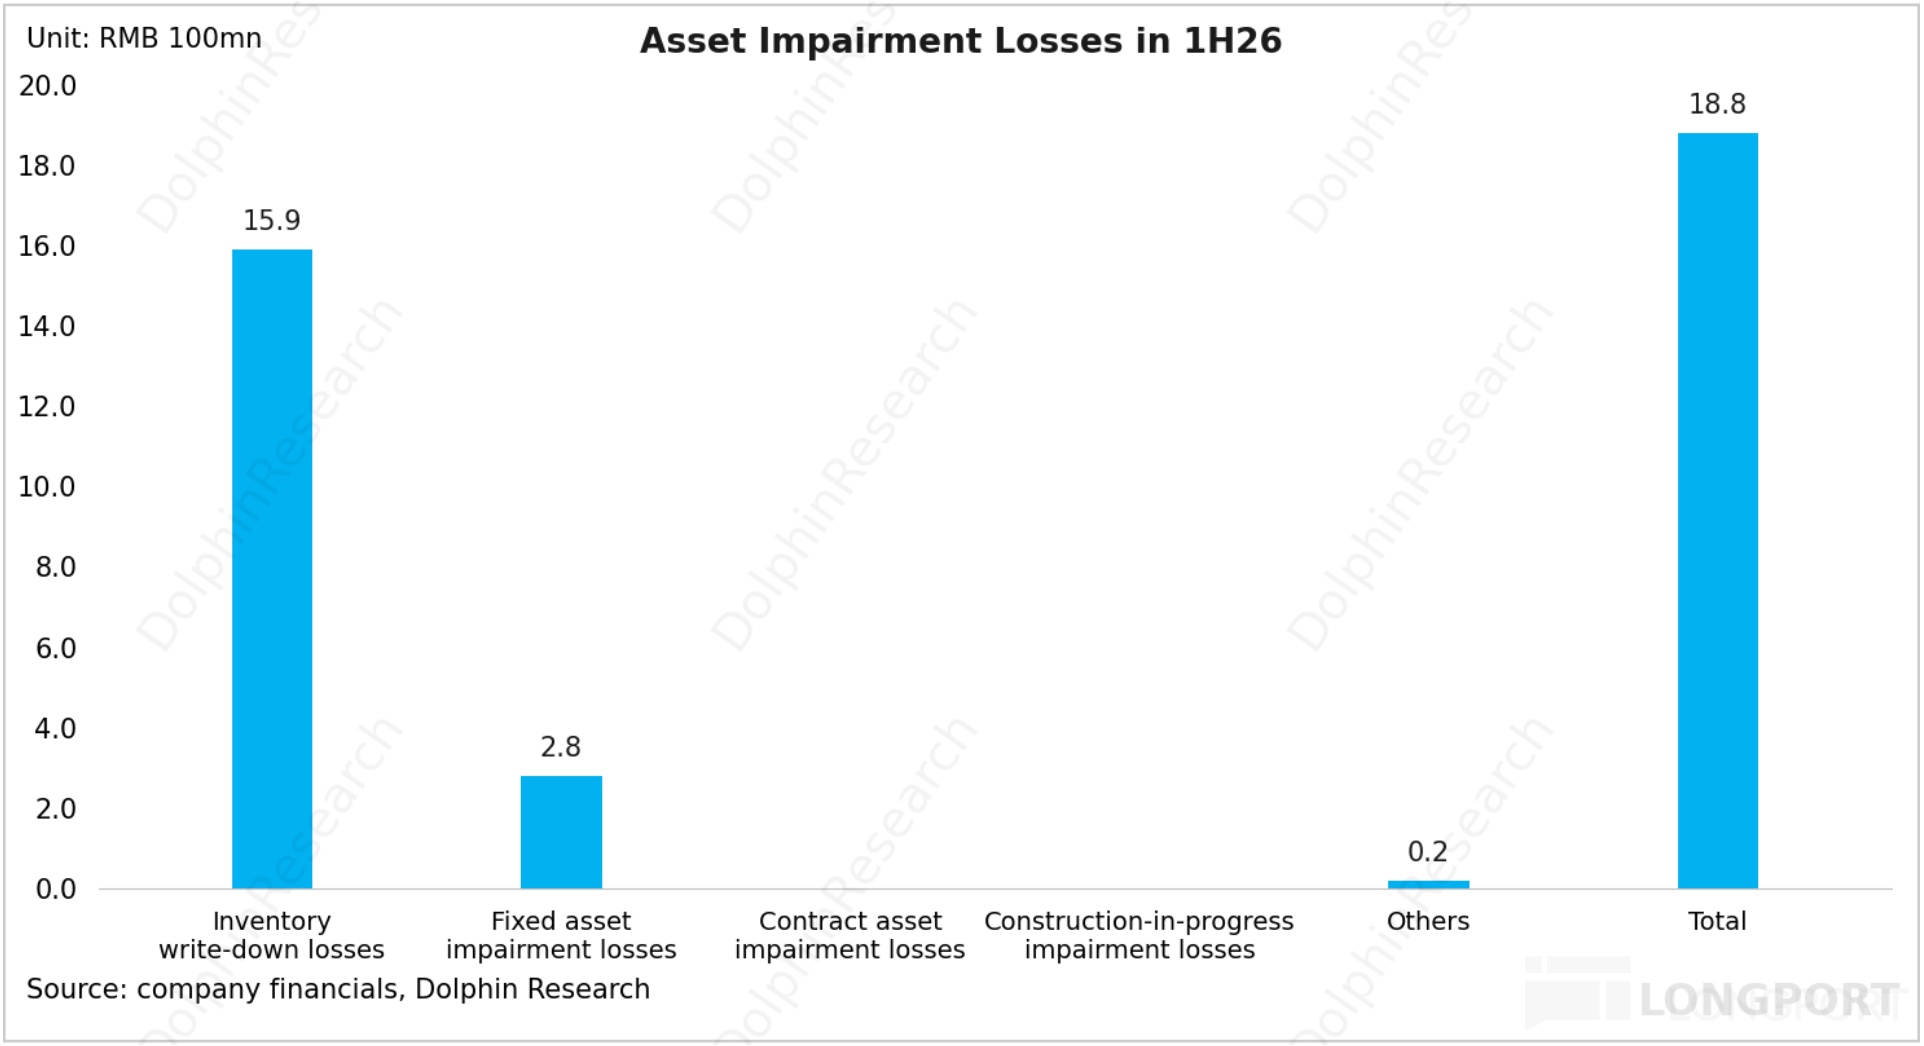
This quarter, asset impairment losses were ~RMB 0.5bn, bringing 1H26 to ~RMB 1.9bn, down ~RMB 4.5bn vs. 2H25’s ~RMB 6.4bn, a ~70% decline. As a share of revenue, 1H26 impairments fell ~1.8ppt QoQ to ~0.7%, a historical low.
Dolphin Research sees this as the result of prior heavy provisioning and input-price stabilization: 1) Legacy clean-up: CATL took prudent impairments in 2022–2025 on inventory, lithium resources, and older equipment, and the cycle has turned.
2) Price risk eased: Lithium carbonate stabilized in Q4 2025 and rebounded to RMB 150k–200k/ton in 1H26, lifting NRV and reducing the need for new, large write-downs. This alleviates downside risk.
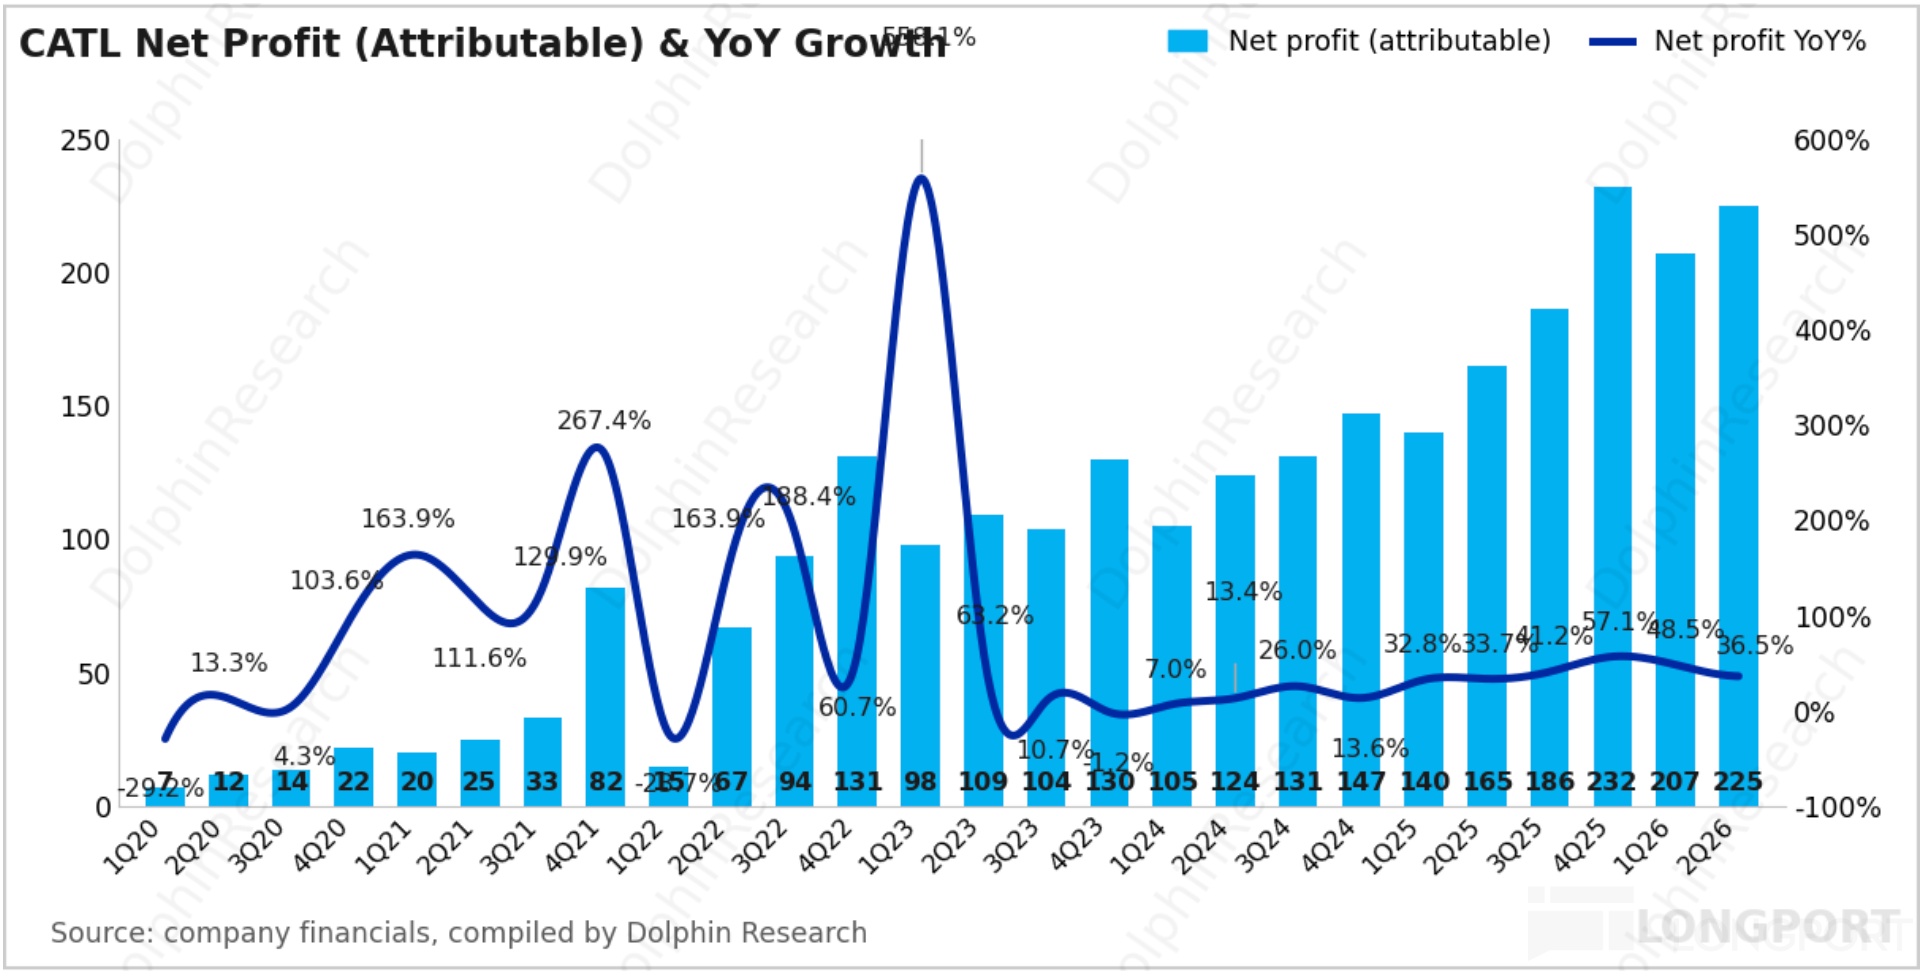
In Q2 2026, attributable net profit was ~RMB 22.5bn (+~37% YoY), below the ~RMB 23.4bn consensus. Ex-one-offs net profit was ~RMB 20.9bn (+~36% YoY).
Net profit per Wh slipped to ~RMB 0.097/Wh (-~12% YoY), below the ~RMB 0.106/Wh consensus. Shortfalls reflect incomplete pass-through and storage fixed-price exposure.
At the same time, CATL pursued a volume-over-price strategy to defend share, and lifted R&D in solid-state, sodium-ion, ultra-fast charging, and AIDC compute-power synergy. R&D expense rose RMB 0.8bn QoQ to RMB 6.1bn.
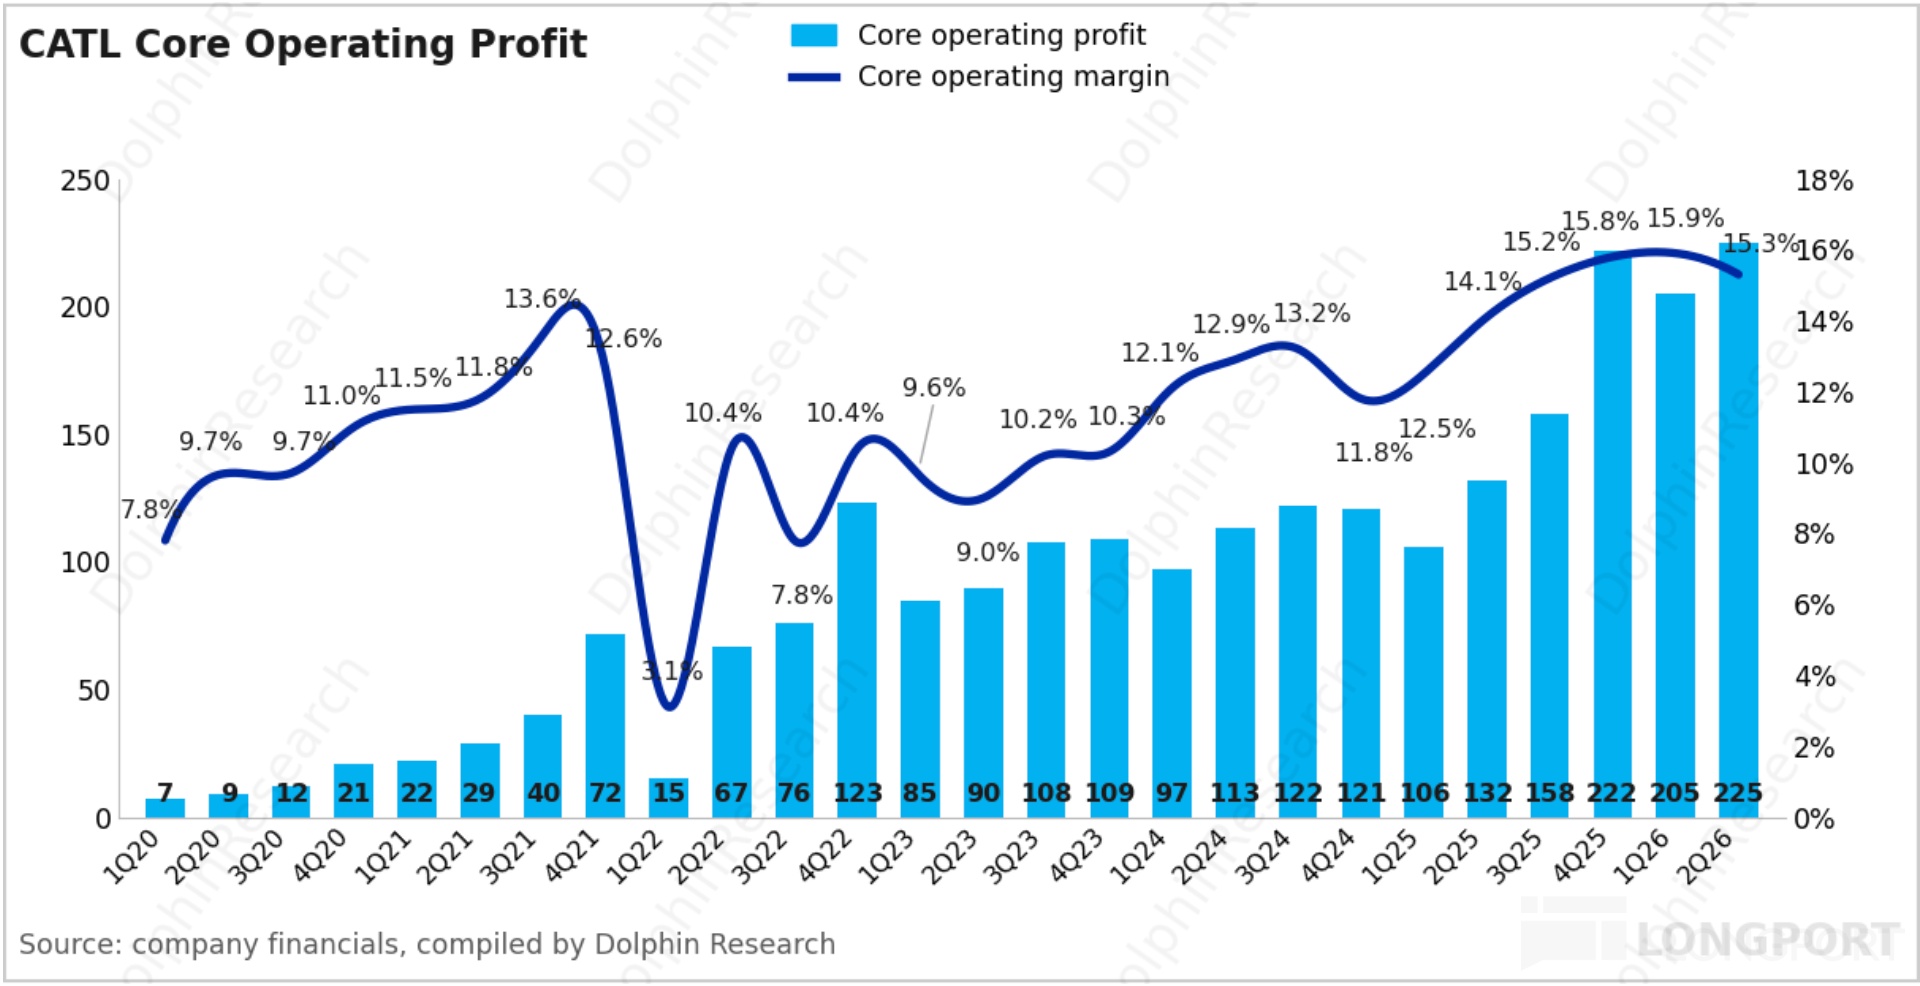
Dolphin Research also tracks core OP trends (GPM minus Opex minus asset/credit impairments). Q2 core OP was ~RMB 22.5bn, +70% YoY, with core OPM at 15.3%, down 60bps QoQ but still strong.
<End here>
Deep dives:
Jul 5, 2025: CATL: H-shares trading 20% rich — time for a value re-rate?
Jan 23, 2025: Reading CATL through TSMC: the inescapable cycle
Earnings tracking:
Apr 16, 2026: CATL: the unshakable TSMC of the energy era
Apr 16, 2026: CATL (1Q26 Trans): Q2 production still full, utilization at a high 85%–90%
Risk disclosure and disclaimer: Dolphin Research disclaimer and general disclosure



The copyright of this article belongs to the original author/organization.
The views expressed herein are solely those of the author and do not reflect the stance of the platform. The content is intended for investment reference purposes only and shall not be considered as investment advice. Please contact us if you have any questions or suggestions regarding the content services provided by the platform.