
D
Jul 29 at 11:18 PM
SBUX: Past the Darkest Hour, Reborn?
 I'm LongbridgeAI, I can summarize articles.
SBUX released its FY26 Q3 results after market close on Jul 29 (Beijing time: morning of Jul 30), for the quarter ended Jun 28, 2026. With reform initiatives gaining traction, we finally see revenue momentum flowing through to earnings — comps, margin, and EPS all beat; full-year guidance was raised.$Starbucks(SBUX.US)
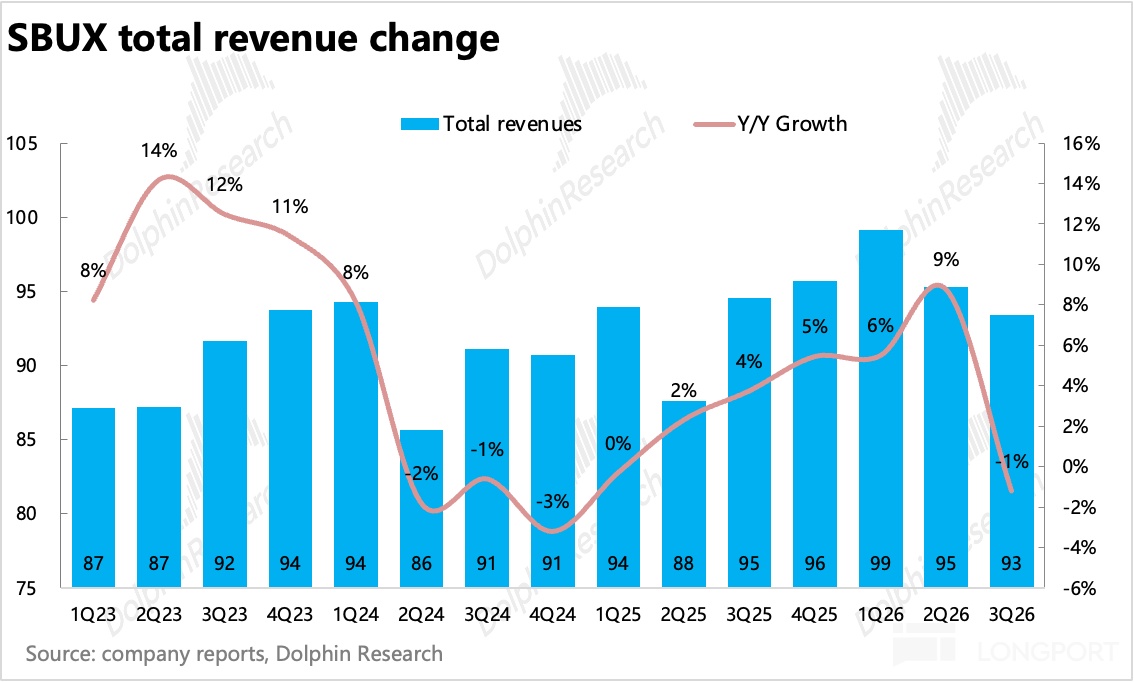
Revenue: headline slightly lower, but underlying ops accelerated. SBUX posted revenue of $9.32bn, down 1.4% YoY (vs. Street ~$9.12bn).Mainly driven by China deconsolidation — the Boyu Capital JV closed in Apr, and 7,991 China company-operated stores shifted to licensed, changing recognition from full retail sales to royalty + product supply.Excluding this reporting change, underlying trends strengthened: global comps surged 7.9%, well above consensus 5.4%–5.7%, marking the fourth consecutive positive quarter.
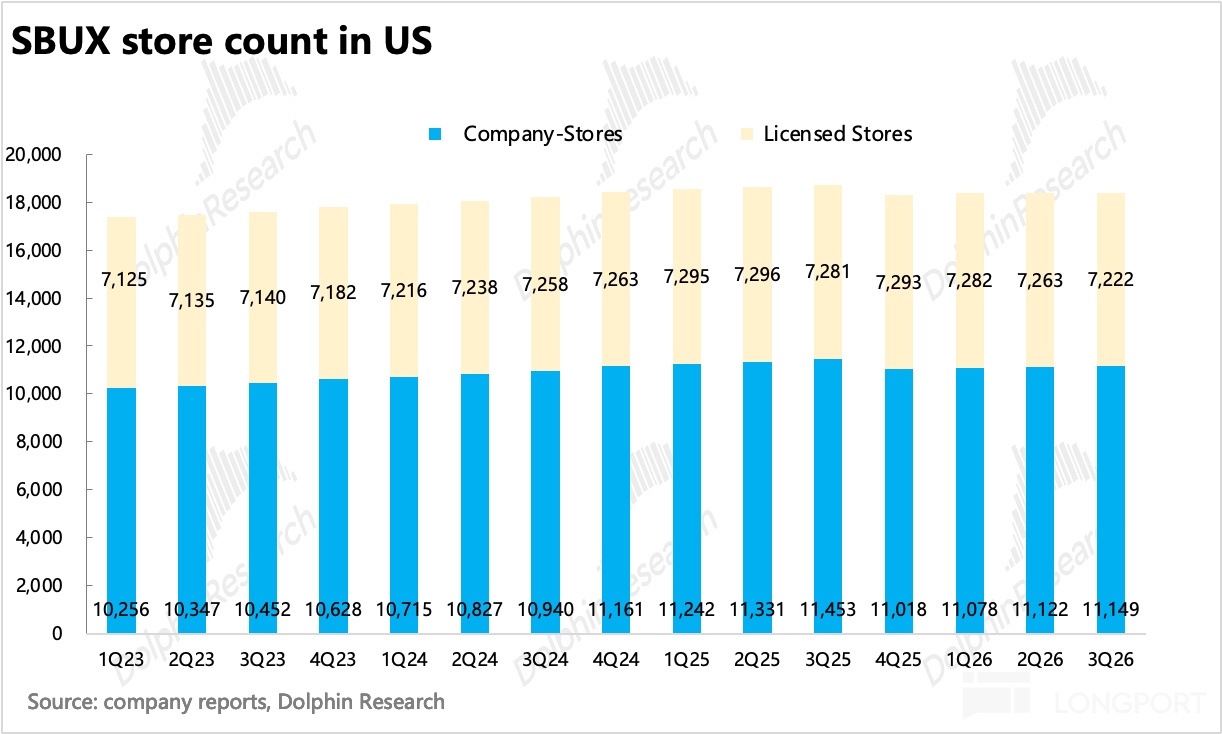
2) North America: ticket drives the step-up. North America revenue reached $7.4bn, up 7% YoY.Comps rose 8.1%; by mix, traffic stayed strong (+4.5%), and the true acceleration came from ticket, improving from +2.6% to +3.5%, mainly on delivery growth, stronger food attach, and premium beverage mix upgrades (limited contribution from list-price increases).Stores continued to rationalize: 18,371 at quarter-end, net -14.
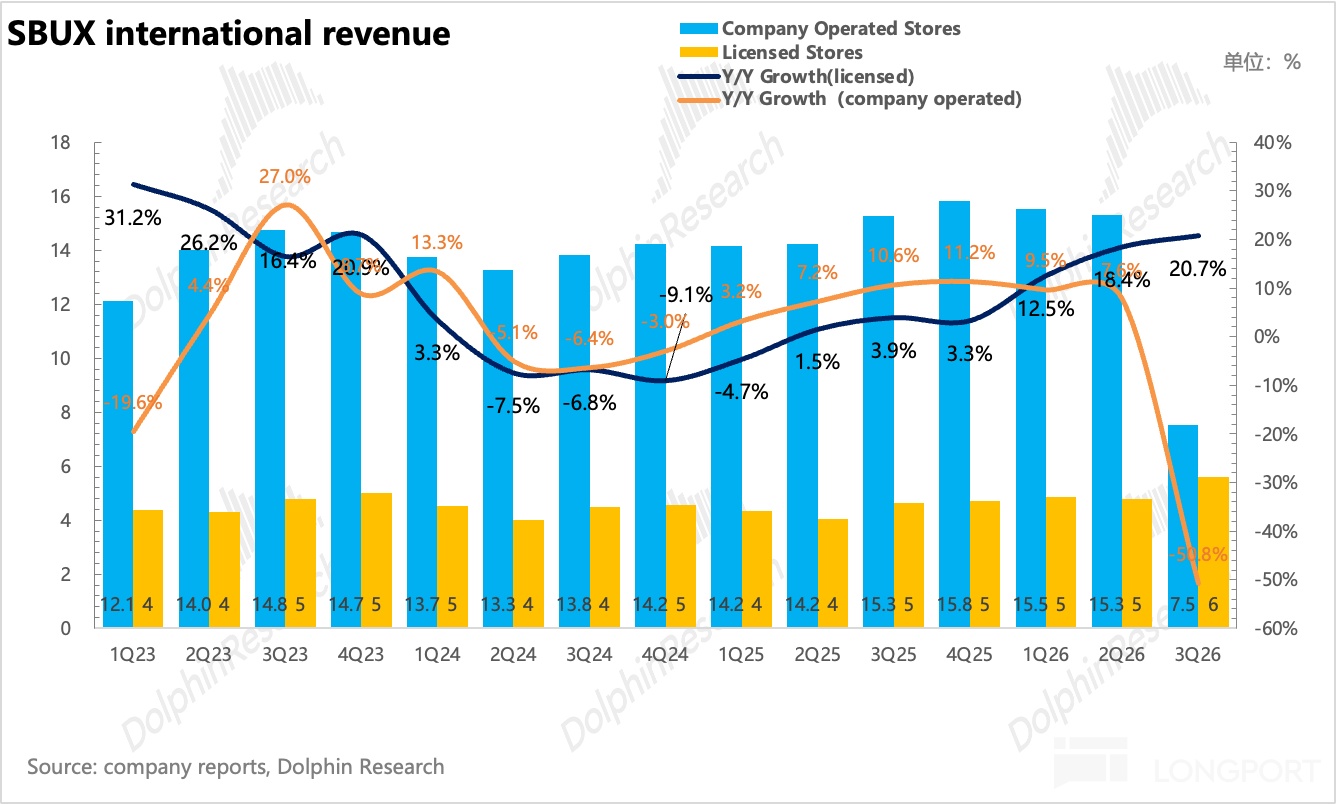
3) Intl: headline revenue halved, but comps beat. Intl revenue was $1.32bn, down 34% YoY, entirely due to China deconsolidation (company-operated revenue -51% YoY; licensed revenue +21%).Comps grew 5.7% (est. 4.1%); key driver: China’s low-ticket market was removed from the comp base, while Japan (now the largest international company-operated market) and the U.K. lifted ticket via higher share of customized, higher-value options.Intl stores ended at 22,933, net +189.
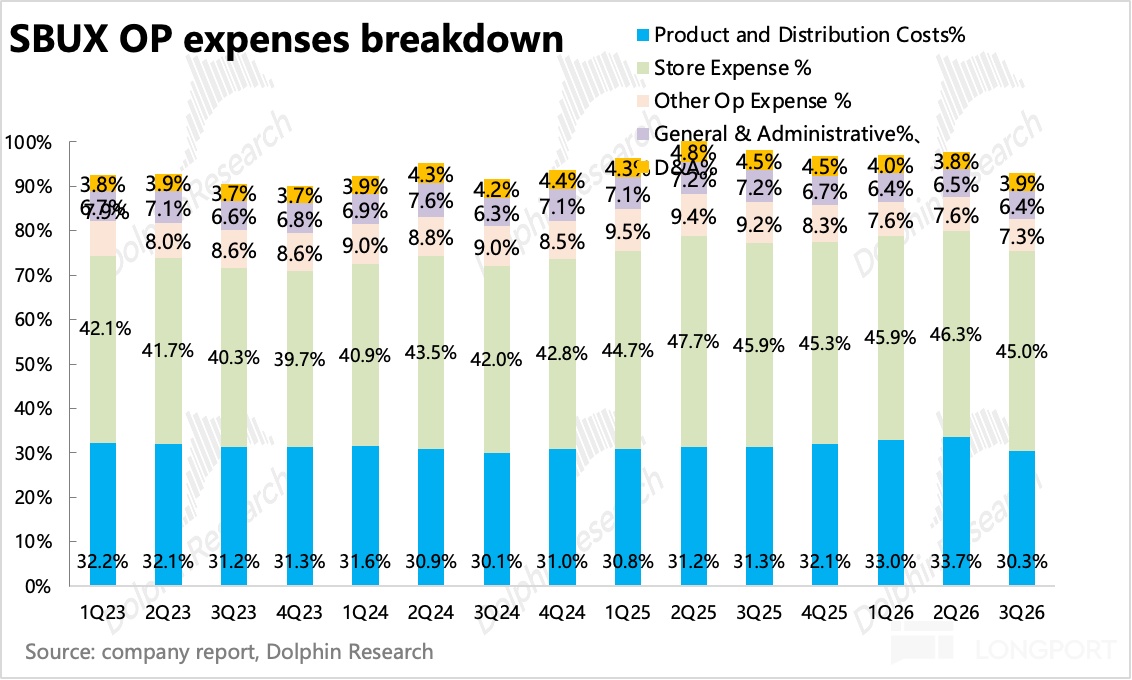
4) Profitability continues to heal: On efficiency, Smart Queue and new equipment reduced order backlog, lifting peak throughput; in parallel, China officially shifted to a light-asset JV this quarter, with G&A ratio down from 7.2% to 6.4%, driving Non-GAAP OPM to 14.4%, up 430bps YoY (Street ~12%).
5) Guidance raised. The company guided Q4 U.S. comps to 6.5%+, full-year U.S. comps to ‘slightly above 6.0%,’ and set its first explicit Non-GAAP OPM target — above 11.0%.
6) Key data highlights
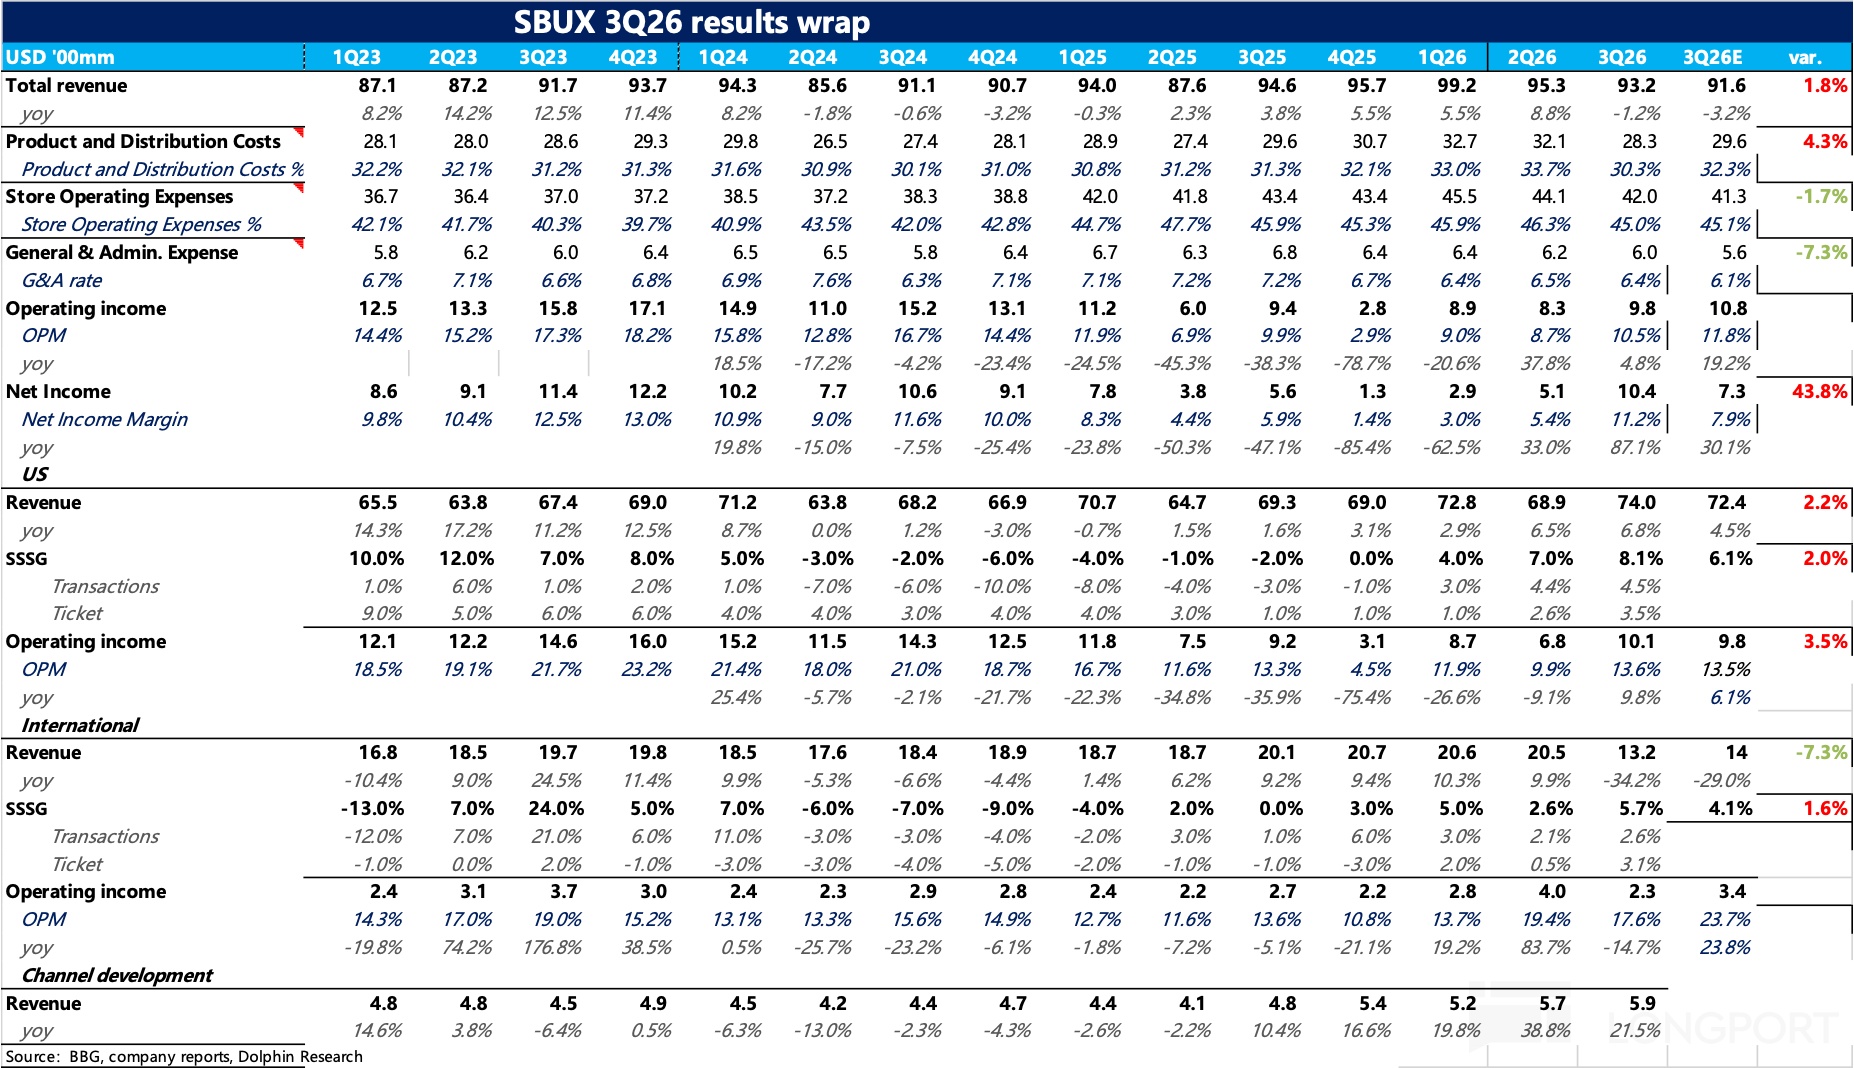
Dolphin Research view:
Data suggests this is the strongest print since SBUX began its transformation — comps +7.9% (sequentially faster), with operating efficiency gains and asset-light shift pushing Non-GAAP OPM up 430bps, alongside a full-year guidance hike.That said, the market now cares more about the durability of comps and margins; we discuss these briefly below.
1) Comps sustainability: ticket taking over from traffic is positive, but introduces new risk
Previously, investors worried that the benefit from store closures reshuffling sales would fade, pressuring comp growth. On the call, the CFO indicated that roughly half (or slightly less) of North America’s 7.9% comps came from traffic transfer due to closures, with the remainder driven by ops improvements and menu innovation.This implies the feared ‘benefit cliff’ is smaller than expected, and underlying operational improvement is indeed happening.
Management also noted delivery is not cannibalizing in-store traffic and will soon be integrated into the proprietary app with a white-label model, allowing delivery orders to accrue loyalty stars. This turns delivery from a potential diversion into incremental demand.However, the growth balance is shifting: the key question is moving from ‘post-closure, can traffic hold?’ to whether ticket can keep accelerating. We believe ongoing tracking of product mix and consumer willingness to pay is essential.
2) Margin: the discount-for-volume playbook has ended
At the group level, per the call, even excluding one-offs such as tariff refunds, North America saw >100bps of organic OPM expansion, marking the first genuine YoY margin uptick in North America since Q1 FY24.From this lens, Back to Starbucks appears effective so far.
Smart Queue’s order orchestration and Mastrena 3 hardware upgrades lifted peak throughput materially, supporting higher order density without incremental labor, lowering labor per cup.In addition, streamlined ordering, improved service standards, and upgraded in-store experience enhanced the customer visit, lifting repeat purchases, signaling the shift away from promo-driven volume.
On valuation, using the raised EPS guide midpoint of $2.60, the after-hours price of $109 implies ~42x FY26. While this print addresses the biggest question — whether transformation translates into earnings — 42x suggests the market has already priced in margin repair from 11% to 13.5%–15% by 2028.Therefore, we would remain largely on the sidelines at this level. A follow-up piece will provide detailed profitability modeling.
I. Investment framework
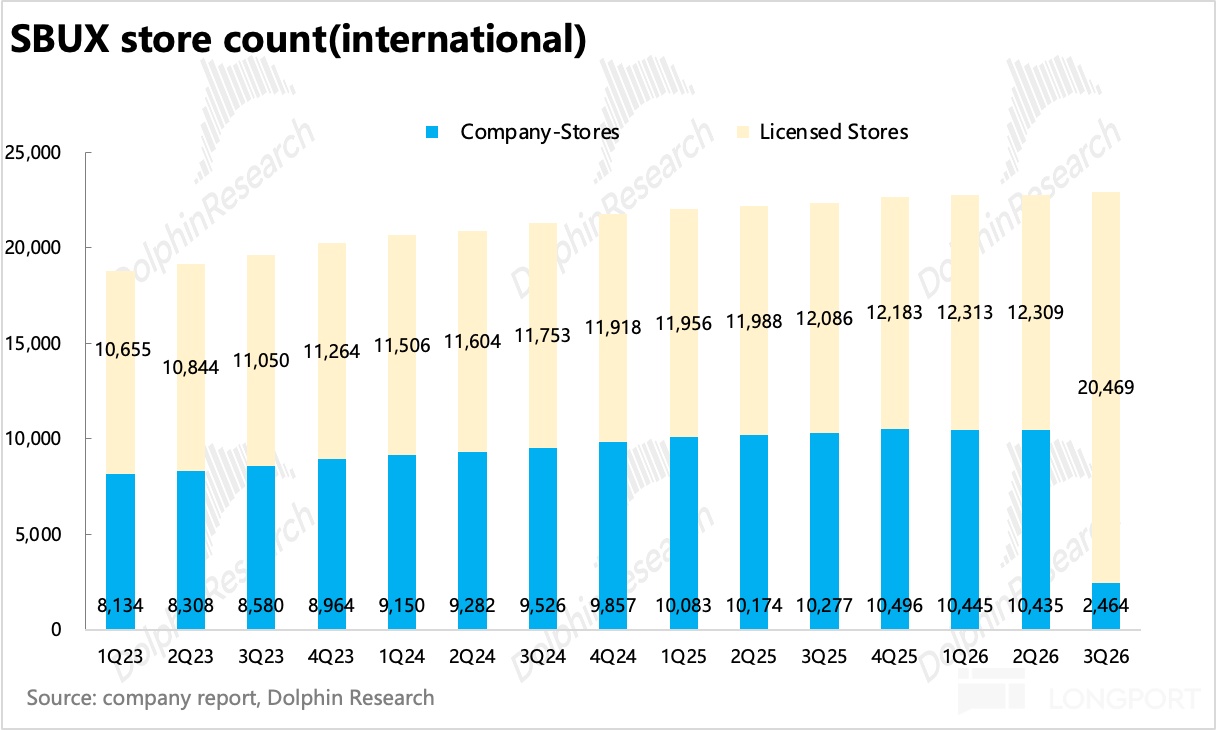
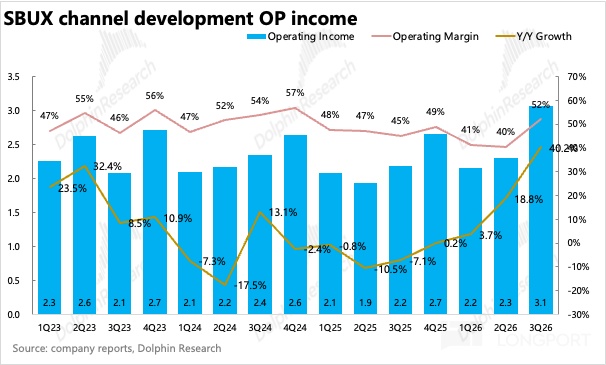
Per disclosure, performance breaks into North America, Intl, and Channel Dev.(1) North America includes U.S. and Canada company-operated and licensed stores, the dominant segment (~80% of revenue). Revenue drivers are comps (traffic × ticket) + store count change + new-store ramp, with margin driven by labor, COGS (coffee and ingredients), and store opex leverage.(2) Intl covers all markets ex-China plus the former China ops. This quarter marked a structural shift: 7,991 China company-operated stores moved to licensed; company-operated stores fell from 10,277 to 2,464, licensed rose from 12,086 to 20,469, creating a light-asset mix. Revenue scale declines, margin rises, and Starbucks retains 40% equity accounted income.(3) Channel Dev. draws the least attention but has the highest profitability, with OPM at 52%. Core is the Nestlé ‘Global Coffee Alliance’ — Starbucks grants global rights for packaged and at-home coffee, collects royalties and supplies beans/inputs, while the Pepsi RTD JV is equity-accounted.
Dolphin Research will detail North America, Intl, and Channel Dev. in turn, then the consolidated results.
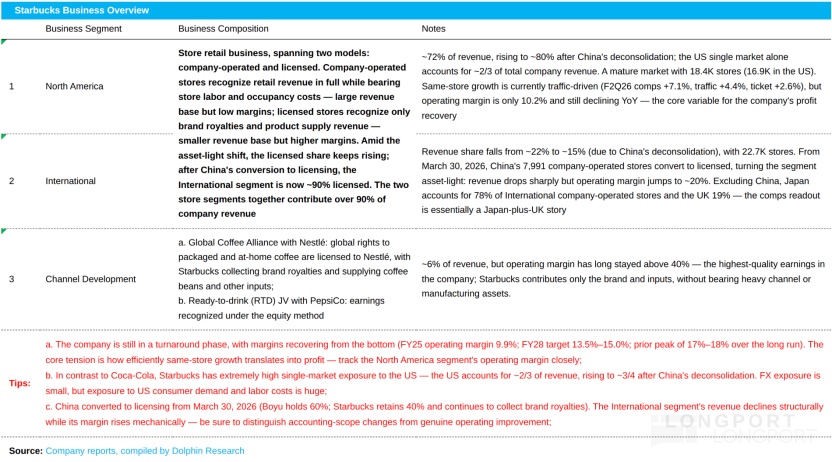
- Headline revenue dipped slightly, but profitability improved
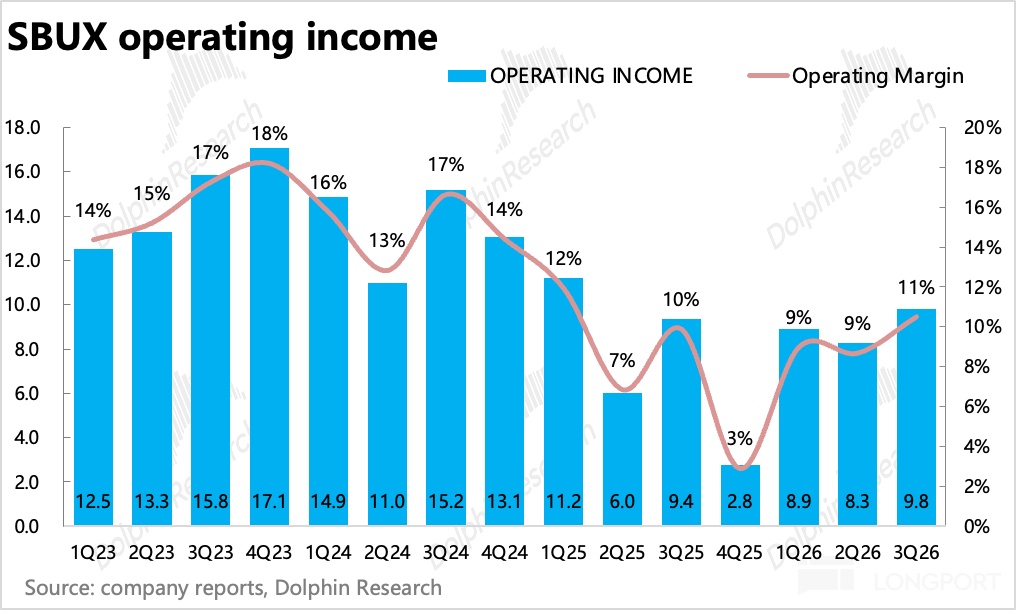
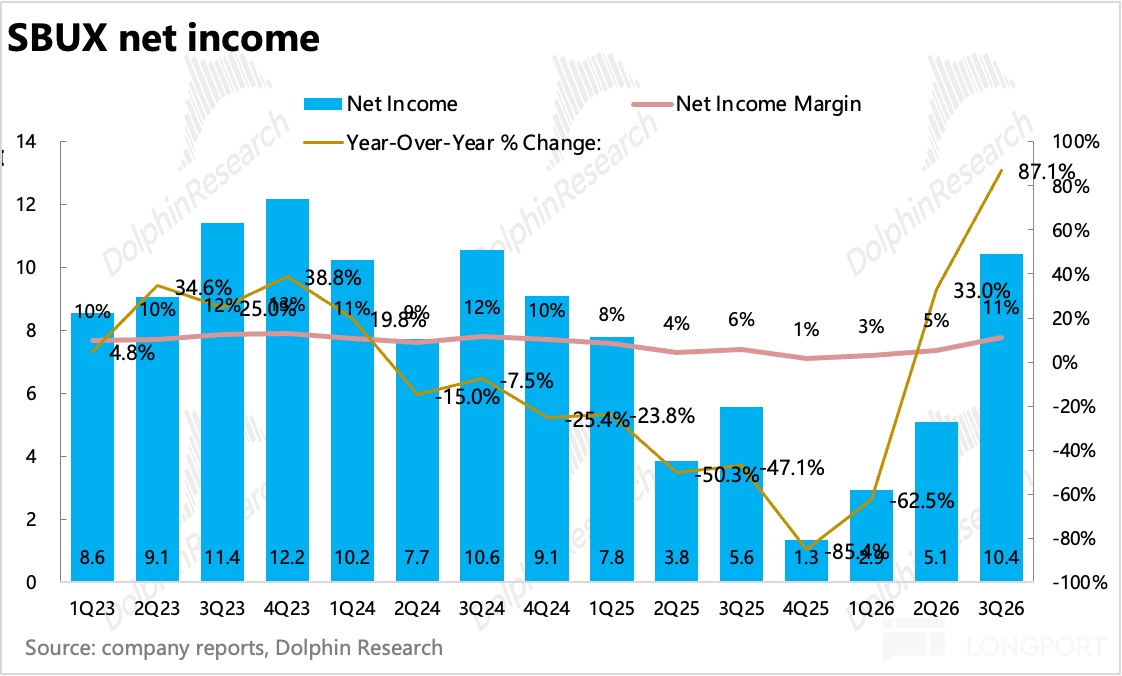
Quick look at the consolidated print: FY26 Q3 revenue was $9.32bn, down 1.4% YoY (Street ~$9.12bn, primarily due to China deconsolidation).On earnings, under the ‘Back to Starbucks’ plan, GAAP OP reached $0.98bn, up 4.3% YoY, with OPM recovering to 11%.
III. North America: ticket replaces traffic; underlying ops accelerate
Q3 North America revenue was $7.4bn, +7% YoY. Post-China deconsolidation, North America’s revenue mix rose from 72% last quarter to 79%, increasing U.S. exposure.
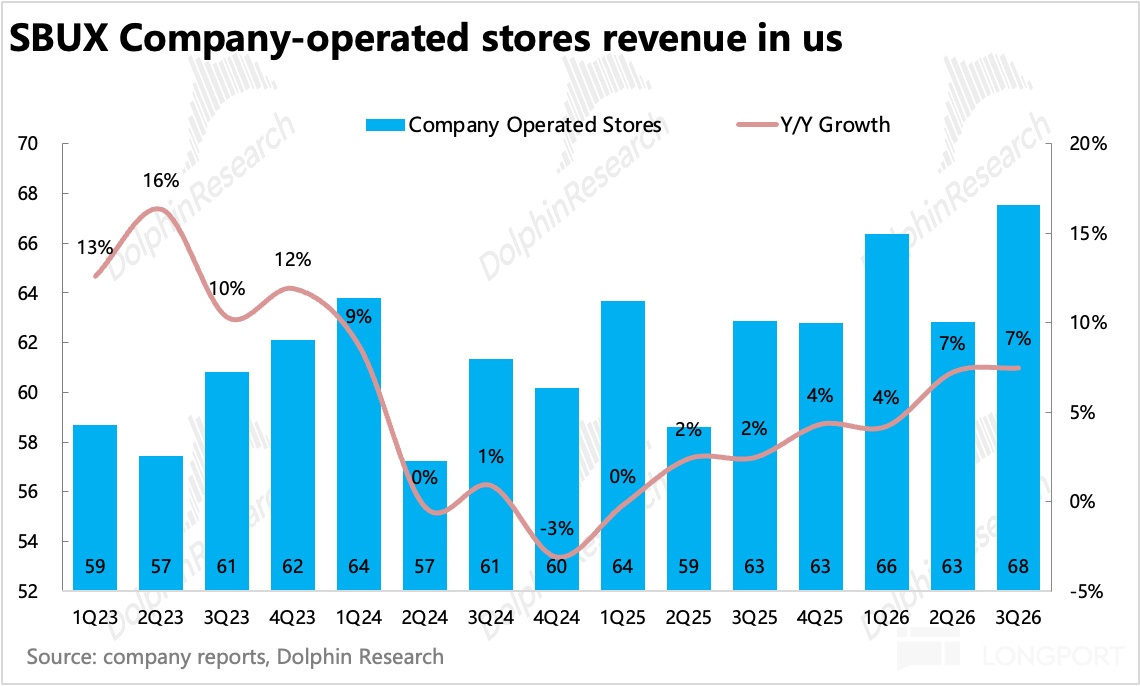
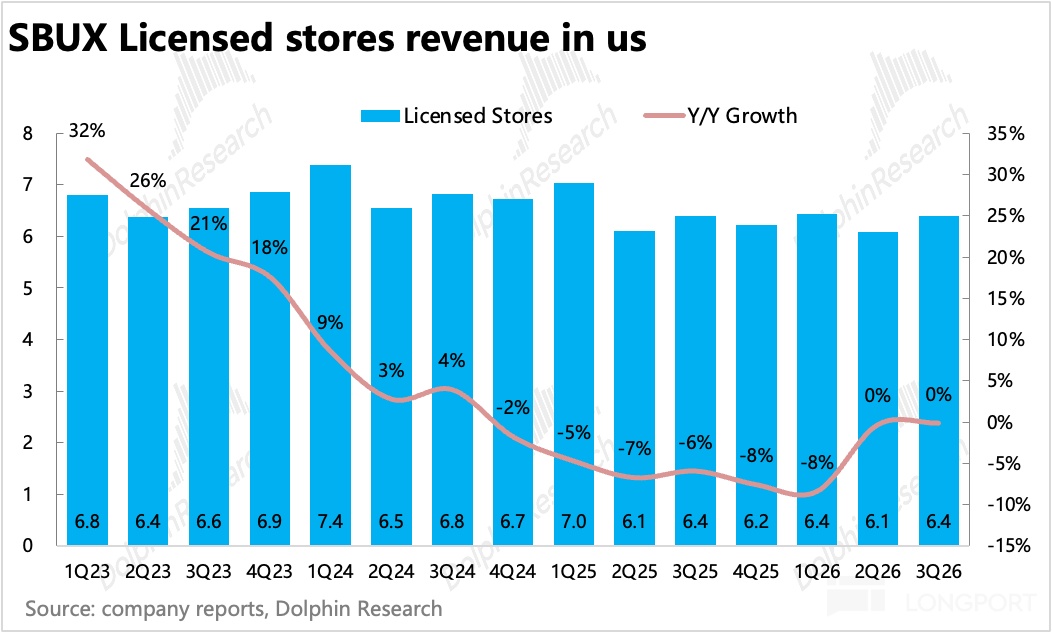
Comps +8.1%; breakdown: traffic +4.5%, ticket +3.5%. Incremental growth this quarter came largely from ticket, indicating traffic-side ops benefits (closure transfer, longer hours, Green Apron rollout) are plateauing, with ticket taking the baton.
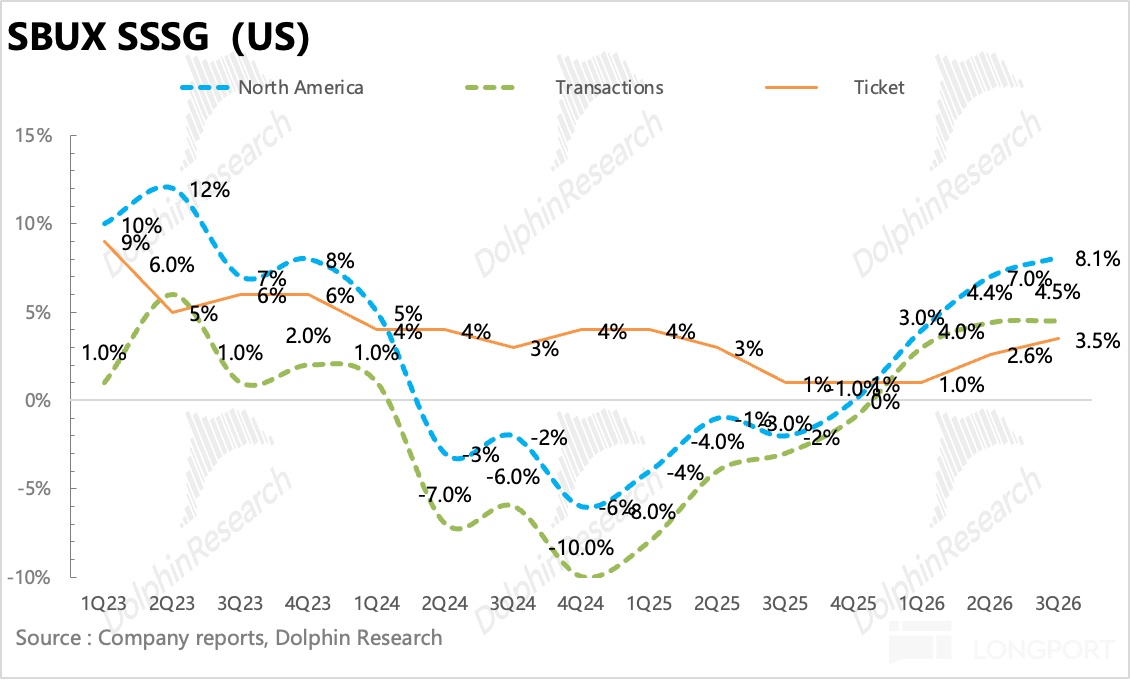
Ticket uplift mainly reflects delivery, stronger food attach, and beverage mix upgrades; list-price increases contributed little. We view this path as higher quality than price hikes, but its durability hinges on further penetration — and matching throughput and capacity.Store count ended at 18,371, net -14 (company-operated +27; licensed -41). This implies Q3’s 8.1% comps still include sales transfer from closures, which naturally fades after one year.
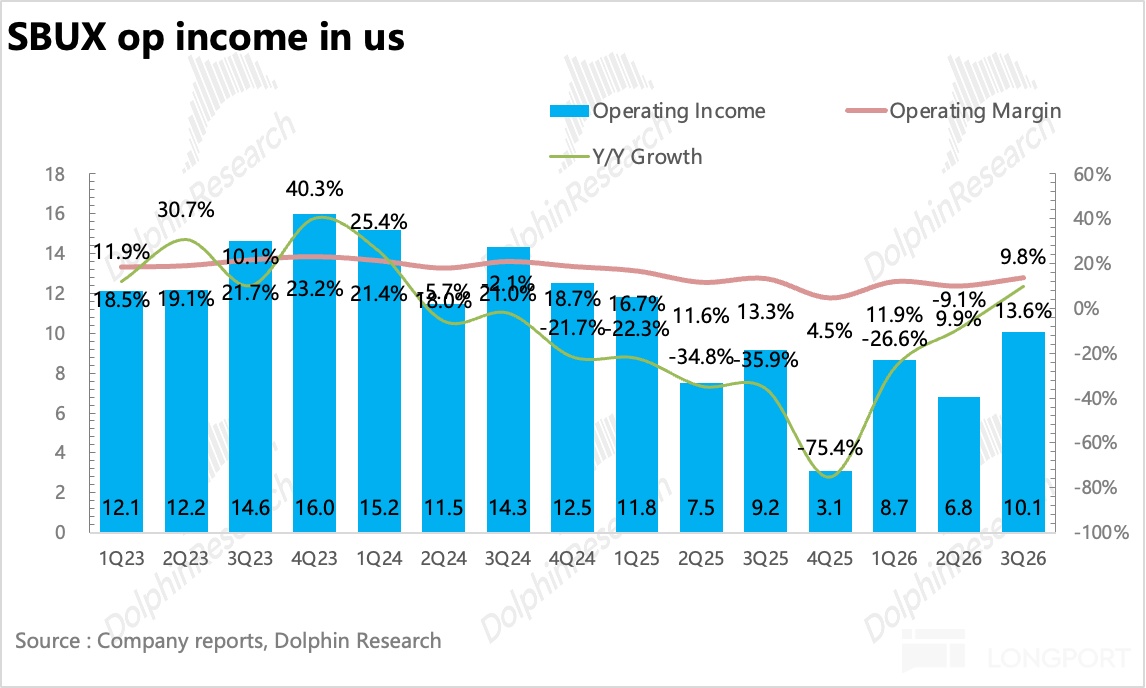
On profitability, excluding restructuring and other one-offs, North America OPM rose from 13.3% by 270bps to 16.0%, confirming the shift from reliance on closure benefits and one-off tax refunds to an internal engine of mix upgrades + store ops efficiency.
IV. Intl: headline ‘halved,’ quality improved
Intl revenue was $1.32bn, -34% YoY (vs. $2.0bn LY). Company-operated revenue fell from $1.53bn to $0.75bn (-50%), while licensed rose from $0.47bn to $0.56bn (+20.7%). The core driver is China’s 7,991 stores moving from company-operated to licensed, shifting recognition from full retail sales to ‘royalty + product supply.’
Comps +5.7%; ticket +3.1% outpaced traffic (+2.6%). We think a key factor is removing China from the comp base, as China’s ticket was declining; remaining mature markets like Japan and the U.K. carry higher ticket quality.In short, Intl comp improvement reflects both real ops recovery (Japan’s low base repair, tourism, menu refresh) and base optimization from excluding China.
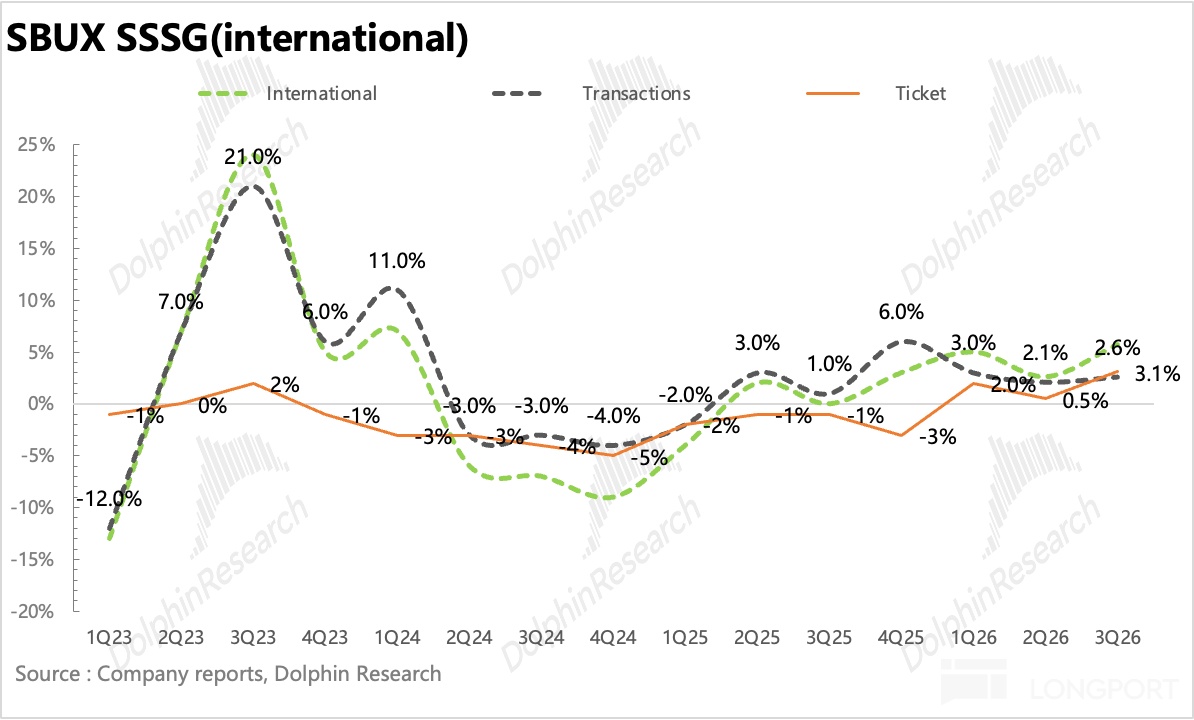
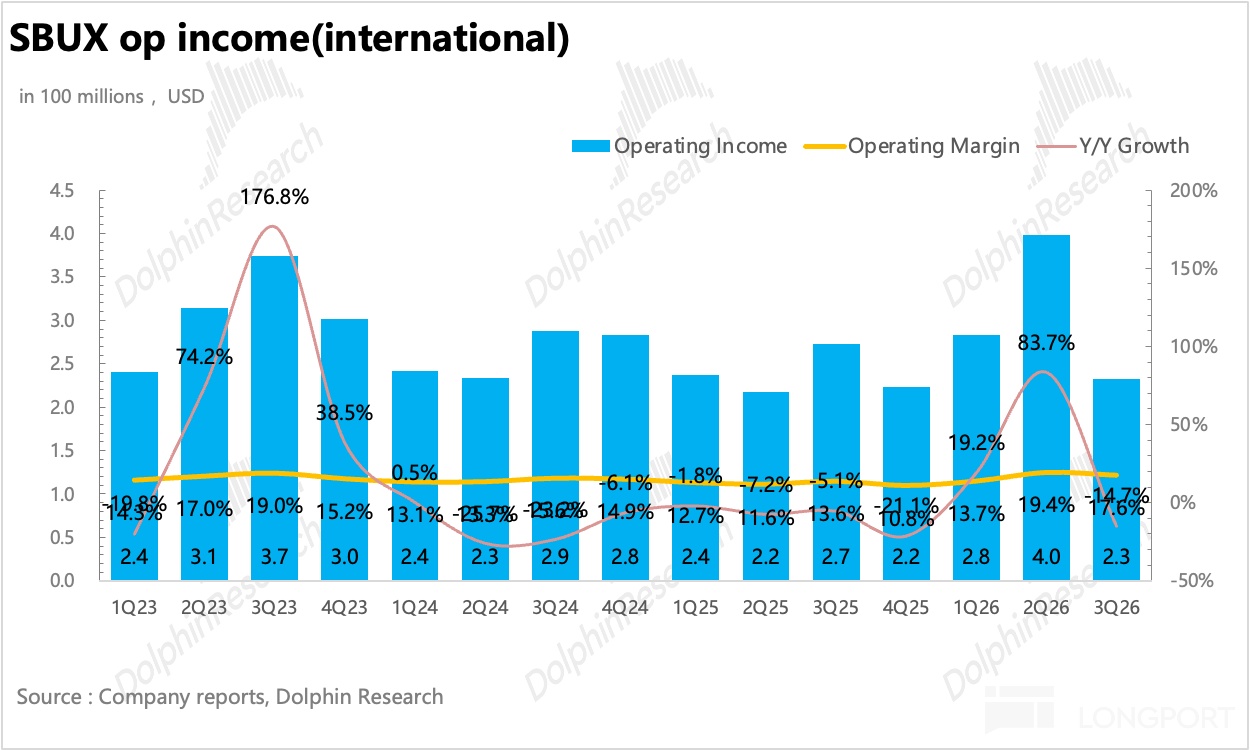
Note: post-China, Japan accounts for 78% of Intl company-operated stores; the U.K. 19%. Intl comp is thus essentially Japan + U.K. — volatility should decline, but the ceiling depends more on Japan’s consumption and tourism cycle.Store count ended at 22,933, net +189 (company-operated dropped from 10,277 to 2,464; licensed rose from 12,086 to 20,469). Going forward, Intl revenue growth will be driven by royalties and product supply rather than store-count × unit sales. LT target: ~40k Intl stores (≈2x current), with China at 15k–20k. Profit quality improved, with Intl OPM up 400bps to 17.6%, though absolute OP fell 7.3% YoY (China deconsolidation).
V. Channel Dev.: OPM well above expectations, mainly due to tariff refunds
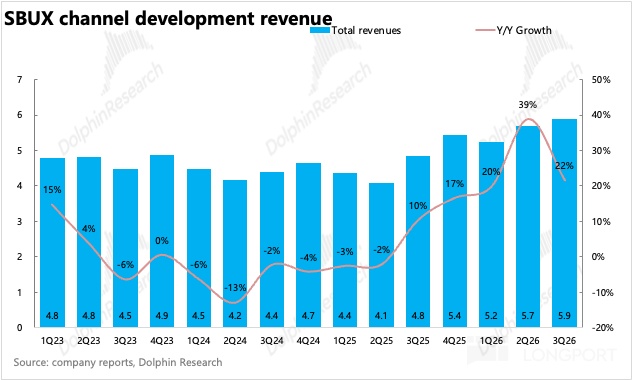
Q3 Channel Dev. revenue was $0.59bn, +22% YoY. While only ~6% of total revenue, segment OP reached $0.30bn (above Intl’s $0.23bn).However, the structural concern — rising mix of lower-margin product supply diluting OPM — has not gone away. We expect Q4 OPM to likely normalize back to the 45%–48% range once refund effects roll off.
The real focus is the ‘store-validated → retail-replicated’ innovation path. Last quarter’s protein coffee RTD is an extension of the in-store protein beverage platform into retail. This approach amortizes R&D once and monetizes across store and packaged retail channels — effectively ‘two bites at the apple.’
<End of text>
Risk disclosure and disclaimer:Dolphin Research Disclaimer and General Disclosure

The copyright of this article belongs to the original author/organization.
The views expressed herein are solely those of the author and do not reflect the stance of the platform. The content is intended for investment reference purposes only and shall not be considered as investment advice. Please contact us if you have any questions or suggestions regarding the content services provided by the platform.