
A


2 days ago, 10:33 PM
Dell was held for 315 days, and TEAM drew the results that very night.
 I'm LongbridgeAI, I can summarize articles.
In the same trading day, the two most expensive bets were placed on June 2027 and on the earnings report four hours later—the latter paid out that very night. On 8/6, there were 155 unusual trades with a long-to-short ratio of 6.3:1, with longs at $69.73 million against shorts at $11.12 million, marking the most extreme divergence in the past four trading days. However, the real split wasn't between bulls and bears, but in duration.
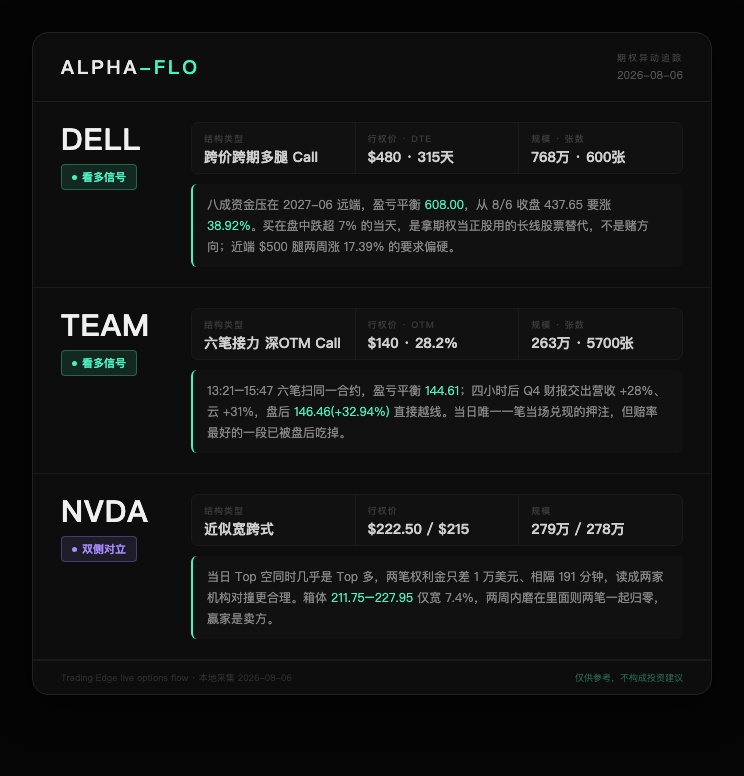
DELL Technologies
Direction: 🟢 Bullish
Expiration: 2027-06-17 (with another leg expiring 2026-08-21)
Strike Price: $480 (other leg $500)
Notional Size: ~$7.68 million (other leg ~$1.71 million, total underlying ~$9.39 million)
Volume: 600 contracts (other leg 1,244 contracts)
Structure Type: Multi-leg Buy Call across strikes and expirations (primarily long-dated)
Data Highlights: The far-dated 315-day contract had a unit price of $128.00 ($7.68M ÷ 600 contracts ÷ 100), with a breakeven of $608.00. DELL closed at 437.65 on 8/6, meaning it needs to rise another 38.92% just to break even. The near-term two-week contract had a unit price of $13.75, with a breakeven of $513.75, requiring a 17.39% increase. These two trades occurred 35 minutes apart, falling within the same down day—on 8/6, the stock dipped over 7% intraday, closing at −5.41%.
Bullish Viewpoint Comparison: The street interpreted the drop on 8/6 as profit-taking—after a nearly 9% surge on 8/4 and touching a 52-week high of 485.70 intraday on 8/5, short-term capital began hesitating on AI hardware valuations. Options money pushed back from the front, albeit heavily skewed: 80% of the capital was placed on the long-dated leg.
My Viewpoint: I won't follow the near-term leg; a 17.39% gain in two weeks is a stretch. For the long-dated leg, I accept the logic but not the price. Setting the strike at $480 and extending the duration to June 2027 implies, "This AI server cycle will run its full course of a year and a half, regardless of interim volatility." This is using options like equity, not betting on direction. I would wait for the 8/27 earnings report to see if this logic holds; currently, the 38.92% distance to breakeven is too expensive.
TEAM Atlassian
Direction: 🟢 Bullish
Expiration: 2026-09-18
Strike Price: $140
Notional Size: ~$2.63 million
Volume: 5,700 contracts
Structure Type: Six consecutive deep OTM speculative Calls
Data Highlights: Six sweeps from 13:21 to 15:47, all buying the same 28.2% out-of-the-money $140 Call, with a unit price of $4.61 ($2.63M ÷ 5,700 contracts ÷ 100), resulting in a breakeven of $144.61. The underlying stock was at 110.17, closing down 2.77%. Four hours later, earnings were released: Revenue $1.766 billion (+28% YoY), Cloud Revenue +31%, Adjusted EPS $1.80 vs consensus $1.50, GAAP Diluted EPS turned positive from −0.09 YoY to 0.55, RPO increased 44%. After-hours price hit 146.46, +32.94%, directly surpassing the breakeven point.
Bullish Viewpoint Comparison: Pre-earnings market consensus was "revenue growth approx. 19.8%," but the actual result was 28%. However, FY27 guidance was discounted—the company's own revenue growth forecast is approx. 13%, halved from FY26's 26%, and subscription ARR growth dropped from 23% to approx. 18%. In other words, the current period beat expectations, but future growth is slowing.
My Viewpoint: Earnings day is public information; someone daring to sweep six contracts four hours before earnings isn't necessarily informed, just bold—but this was the only bet on the day that paid off immediately, worth recording. I'm not chasing now: 146.46 is already above breakeven; the best risk-reward segment was eaten up by the after-hours move. The remaining 43 days earn delta, not mispricing. I'd rather watch where the underlying stabilizes after opening high on 8/7 and whether the 13% FY27 guidance will wipe out half of this rally.
NVDA NVIDIA
Direction: 🔵 Dual-sided Opposition
Expiration: 2026-08-21 (Call) / 2026-08-19 (Put)
Strike Price: $222.50 (Call) / $215 (Put)
Notional Size: ~$2.79 million (Call) / ~$2.78 million (Put)
Volume: 5,115 contracts (Call) / 8,566 contracts (Put)
Structure Type: Approximate Strangle (Inter-institutional opposition)
Data Highlights: This was the top short position of the day, and almost the top long—the two premiums differed by only $10,000. Call unit price $5.45, breakeven 227.95, needing a 4.09% rise; Put unit price $3.25, breakeven 211.75, needing a 3.31% drop. Current price 218.99 sits right in the middle. The two trades were 191 minutes apart, exceeding the reasonable window for a single institution's execution; I tend to read this as two institutions colliding head-on rather than one person playing a strangle.
Bullish/Bearish Viewpoint Comparison: On 8/6, NVIDIA ended a five-day winning streak, closing −0.10%. After hours, news emerged that Rubin Ultra's HBM configuration might be adjusted to address high-end storage shortages. This message can be used by both sides—bulls cite tight supply necessitating configuration changes, while bears argue product specifications are shrinking.
My Viewpoint: I won't follow either side, but I will watch this range. The gap between 211.75 and 227.95 is only $16.20, representing 7.4% of the current price; if NVIDIA grinds within this box over two weeks, both bets go to zero, and the seller wins. My judgment is that NVIDIA lacks a new catalyst to push it out of this box—the five-day win streak just broke, and the HBM news is ambiguous, making box oscillation the path of least resistance. I'll only acknowledge the bear case if it breaks below 211.75.
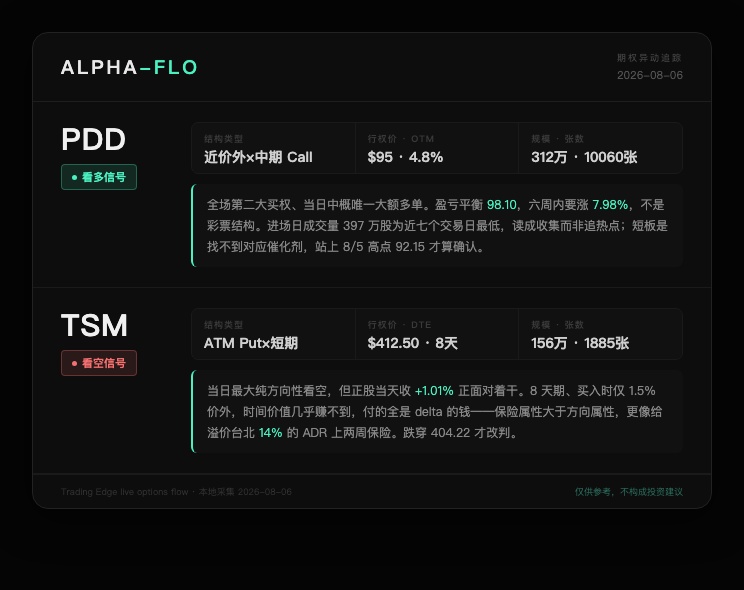
PDD Pinduoduo
Direction: 🟢 Bullish
Expiration: 2026-09-18
Strike Price: $95
Notional Size: ~$3.12 million
Volume: 10,060 contracts
Structure Type: Near OTM × Medium-term Buy Call
Data Highlights: The second-largest call buy of the session, and the only large long position among Chinese ADRs that day. Unit price $3.10, breakeven $98.10, requiring a 7.98% rise from the 8/6 close of 90.85 over six weeks. The strike is only 4.8% out-of-the-money, not a lottery structure.
Bullish Viewpoint Comparison: This trade has no corresponding event—PDD closed −0.09% on 8/6, with volume of 3.97 million shares, the lowest in seven trading days, and the Chinese ADR sector lacked a unified direction that day. In other words, buyers quietly entered 10,000 contracts on a day when no one was watching.
My Viewpoint: This is the only one of the five where I feel the risk-reward and positioning are acceptable. A 7.98% distance to breakeven paired with a six-week duration doesn't require a violent surge; completing a normal Chinese ADR rebound phase is sufficient. Entering the largest position on the day with the lowest volume suggests accumulation rather than chasing hotspots. The only reason I'm not chasing is the lack of a catalyst; the next earnings report hasn't yet entered the window for this contract. If I were to follow, I would wait for confirmation once it stands above the 8/5 high of 92.15.
TSM TSMC
Direction: 🔴 Bearish
Expiration: 2026-08-14
Strike Price: $412.50
Notional Size: ~$1.56 million
Volume: 1,885 contracts
Structure Type: ATM Put × Short-term
Data Highlights: The largest pure directional short of the day. Unit price $8.28, breakeven 404.22, requiring a 3.34% drop within 8 days. At purchase, the strike was only 1.5% out-of-the-money—this position offers almost no time value to earn; you pay entirely for delta.
Bullish/Bearish Viewpoint Comparison: The underlying stock didn't fall that day; instead, it rose 1.01% to close at 418.20. TSMC ADR traded at a 14% premium to Taipei spot prices, and the Taiwan stock market opened higher on the morning of 8/7, surging over 430 points. The buyer of the Put was directly opposing the stock price movement that day.
My Viewpoint: I interpret this as insurance, not a short. An 8-day, 1.5% OTM ATM Put has near-zero probability of profiting from time value; anyone buying knows this—it's more like someone holding TSMC spot shares using $1.56 million to buy two weeks of insurance on an ADR that is already 14% premium. I'm not following this trade, but it reminds me of one thing: at a 14% premium, institutions themselves don't dare to stay naked. If it truly breaks below 404.22, it's no longer just an insurance issue.
The next observation point is the week of 8/19–8/21: NVIDIA's two opposing positions expire simultaneously, and whoever breaks the box of 211.75–227.95 sets the tone. Also settling that same week is Dell's near-term $500 leg. Further ahead is the 8/27 Dell earnings report—that is the first validation for the $7.68 million bet on 2027.










The copyright of this article belongs to the original author/organization.
The views expressed herein are solely those of the author and do not reflect the stance of the platform. The content is intended for investment reference purposes only and shall not be considered as investment advice. Please contact us if you have any questions or suggestions regarding the content services provided by the platform.