
A


Aug 10 at 12:04 AM
SpaceX crossed the line today, but short sellers bet on October
 I'm LongbridgeAI, I can summarize articles.
On 8/7, the five largest trades among these 146 unusual activities all occurred within a concentrated window of 52 minutes, from 09:34 to 10:26. The long-to-short ratio was 5.8:1, with longs at $63.72 million against shorts at $11.02 million. However, the real divergence wasn't between bulls and bears—among the capital deployed in these five trades during the same opening window, the fastest trade crossed the breakeven point by the market close on the same day, while the slowest had to wait until October 16, and even then, it required a drop of 23.5% first.
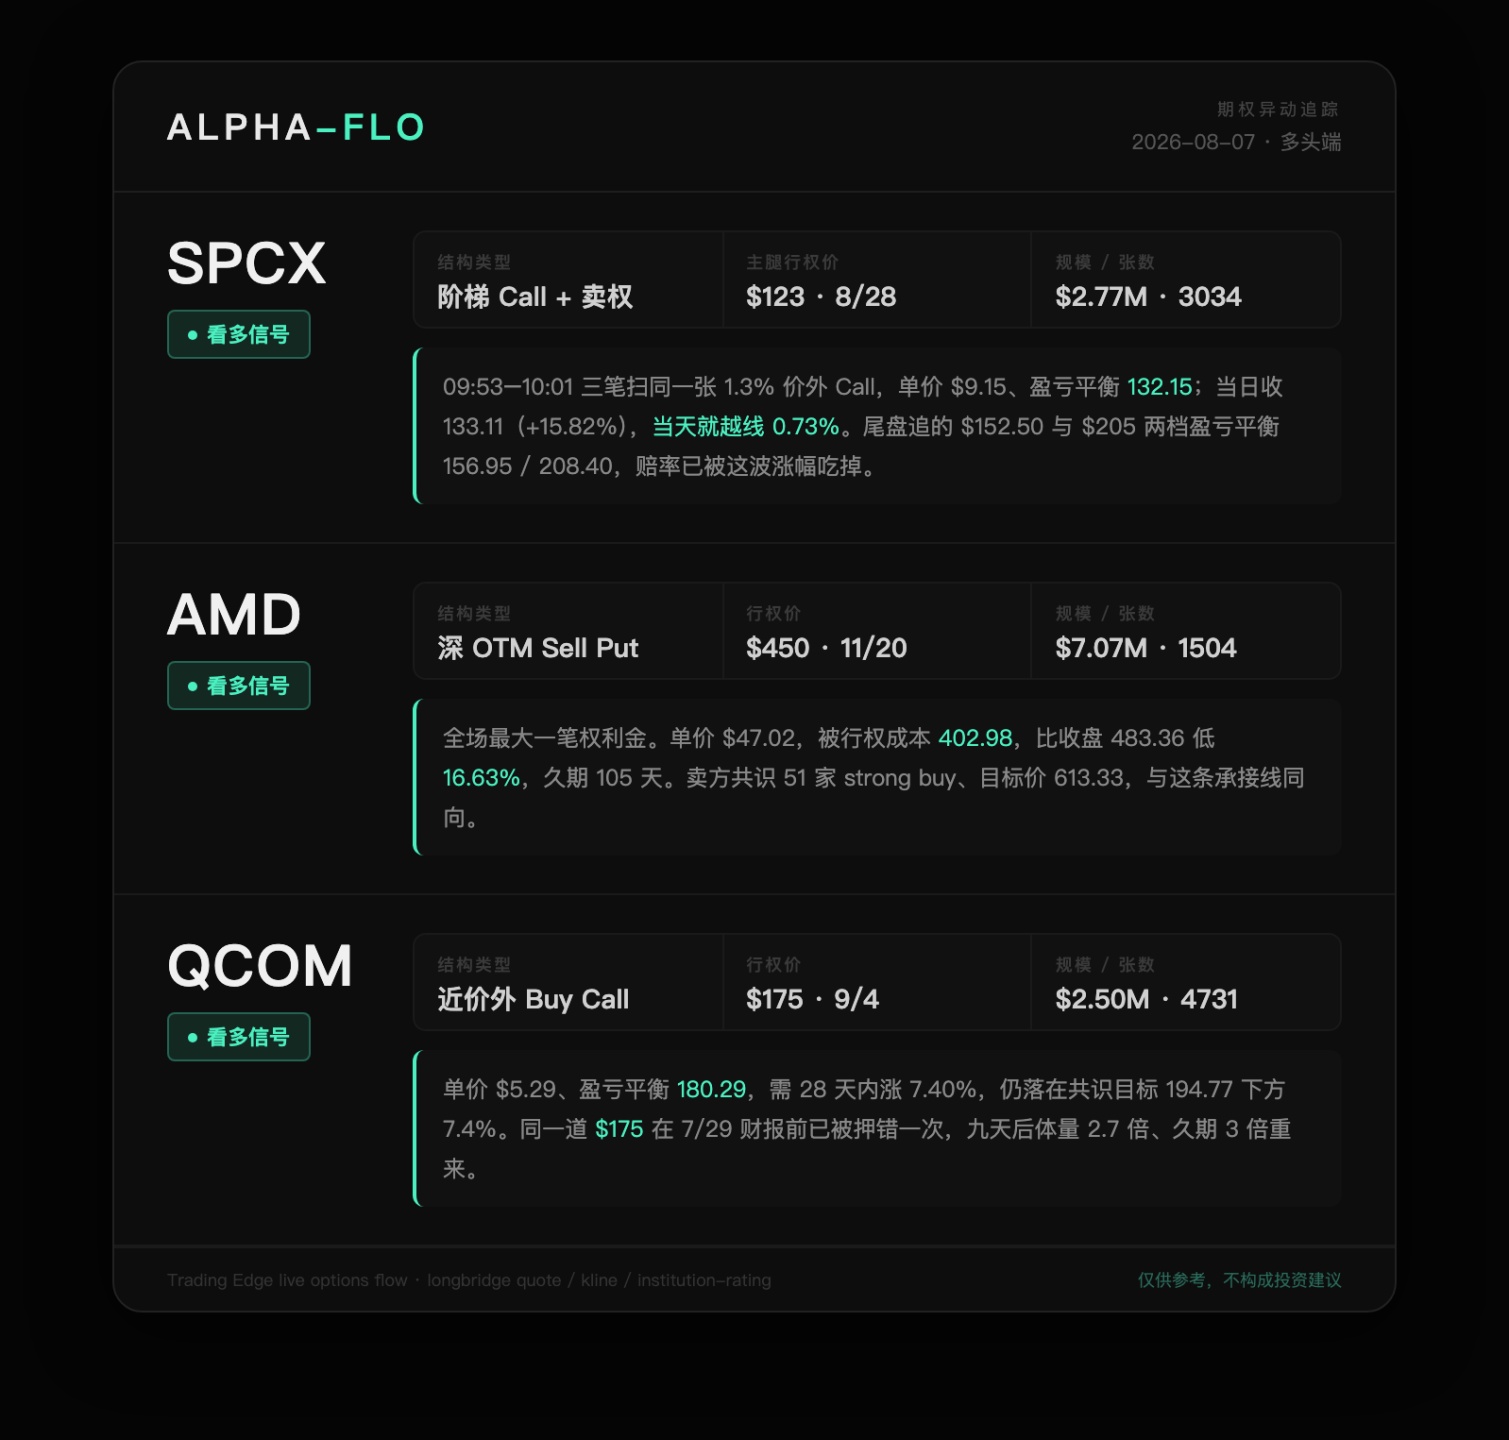
SPCX SpaceX
Direction: 🟢 Bullish
Expiration: 2026-08-28 (Main Leg) / 2026-09-04 / 2026-10-16
Strike Price: $123 (Main Leg) · $152.50 · $205 · $108 (Sell Put)
Notional Size: Approx. $2.77 million (Main Leg), underlying total approx. $4.07 million
Volume: 3,034 contracts (Main Leg, three trades)
Structure Type: Multi-leg Complex · Ladder Call + Sell Put Financing
Data Highlights: Three consecutive sweeps at 09:53, 09:56, and 10:01 into the same 8/28 expiration, which was only 1.3% out-of-the-money at the time, for the $123 Call. Unit price: $9.15 ($2.77m ÷ 3,034 contracts ÷ 100). Breakeven: 132.15. SPCX closed at 133.11 on 8/7, up 15.82%, with an intraday high of 133.48—this capital stood 0.73% above breakeven by the close on the same day, and its 21-day duration hadn't even started burning yet. The other three legs of the same underlying had consistent directions but vastly different positions: At 12:22, a sell of the 9/4 expiration $108 Put brought in $385,000, with an assignment cost of 104.55, which was 21.46% below the closing price. Late in the session at 15:05 and 15:16, they chased the $205/10-16 (unit price $3.40, breakeven 208.40, requiring a 56.56% gain) and the $152.50/08-28 (unit price $4.45, breakeven 156.95, requiring a 17.91% gain). Buying position in the morning, buying odds in the late session.
Bull Case Comparison: This +15.82% candle on 8/7 didn't come out of nowhere. The Q2 earnings released on 8/4 were solid—revenue of $7.814 billion (+92% YoY), adjusted EBITDA of $3.538 billion (+191%), and Starlink added 1.7 million net users in the quarter to reach 12 million. However, the market focused first on the $18.4 billion quarterly capital expenditure (of which $15.8 billion went to the AI division) and the shift to negative adjusted free cash flow, causing a direct 14% hit on 8/5. 8/6 was the first large-scale unlock date, with 911.5 million shares approved for circulation; expected insider selling pressure did not materialize, and the stock actually rose 6%. On 8/7, this was compounded by Argus upgrading to Buy with a target price of 160, and news that Tesla and SpaceX are building a $16.8 billion Terafab semiconductor plant in Texas. The bear case is also clear: The AI division has annualized revenue of $2.561 billion with 247% growth but an operating loss of $1.257 billion; the aerospace division has revenue of $962 million and an operating loss of $542 million; Starlink's ARPU has dropped from $85 to $66 per month. This is a company where two out of three business units are burning cash.
My View: I acknowledge the main leg in the morning session, but I don't follow the two in the late session. The reason is position—the $123 call was bought on the morning of the day the unlock 'boot dropped,' 1.3% out-of-the-money. You paid for delta, not lottery money, and half the answer was delivered by the close that day. The $152.50 and $205 were chased after the +15.82% move had nearly finished. The breakevens of 157 and 208 stand 21% and 61% above the 100-day moving average of 129.47, respectively; the odds were eaten up by that previous surge. SPCX makes its 5th appearance in this account's ledger. The previous four times (6/9, 6/22, 6/23, 6/26) it appeared as a supporting role alongside the storage and semiconductor sectors. Its characterization on the most recent appearance (6/26) was still 'bilateral volatility.' This round marks its first time taking the main seat as a unidirectional long. My observation line is 129.47—if it falls back below the 100-day moving average, the 21-day duration of the morning main leg won't be enough; resistance above is at 134.38, right next to the $135 IPO issue price.
AMD Advanced Micro Devices
Direction: 🟢 Bullish
Expiration: 2026-11-20
Strike Price: $450
Notional Size: Approx. $7.07 million
Volume: 1,504 contracts
Structure Type: Single Leg Deep OTM Sell Put · Rent Collection/Acceptance
Data Highlights: A single trade at 10:02 sold the $450 Put expiring in 105 days, bringing in $7.07 million, the largest premium in the entire session. Unit price: $47.02 ($7.07m ÷ 1,504 contracts ÷ 100). Assignment cost: 402.98, which is 16.63% lower than the 8/7 close of 483.36. When the order was placed, the underlying was approx. 484, with the strike set 7.1% below. AMD opened at 497.94 on 8/7, hit a daily high of 498.99, then drifted down to 476.06, closing at 483.36, down 1.20%—the seller executed during the rally peak, and the closing price was even lower than their entry price.
Bull Case Comparison: AMD's 8/4 earnings report was record-breaking—quarterly revenue of $11.5 billion, data center business up 107% YoY. However, the stock retreated from the 8/4 close of 518.58 to 483.36 on 8/7, giving back 6.79% over three trading days. A headline on longbridge on 8/9 put it bluntly: 'AMD stock falls due to declining free cash flow, but selling put options strategy attracts value investors'—the divergence isn't about growth, it's about cash flow. The sell-side consensus stands on the other side: 51 institutions gave a Strong Buy rating with a target price of 613.33 (updated 8/7), which is 26.89% above the close.
My View: I side with the sellers here. A 16.63% safety cushion paired with a 105-day duration means 'either AMD doesn't break below 403 before November, or I take delivery at 403'—and the level of 403 is only reachable if you smash another 15% below the low of the late-July pullback (closed 476.15 on 7/31, intraday low 475.76). AMD makes its 10th appearance in this account's ledger. The previous nine times were almost entirely calls, Put ladders, or bilateral hedges. This round sees the first pure seller rent-collection on this line, and it's directly the largest single trade in the session—shifting from 'high-level hedging' to 'low-level acceptance.' This shift itself is more important than the amount. Observation lines: 476.06 (8/7 intraday low, re-evaluate only if broken) and 402.98 (assignment cost, only when it drops here does the seller have to explain).
QCOM Qualcomm
Direction: 🟢 Bullish
Expiration: 2026-09-04
Strike Price: $175
Notional Size: Approx. $2.50 million
Volume: 4,731 contracts
Structure Type: Two Trades Same Contract Near OTM Buy Call
Data Highlights: Two sweeps at 09:34 and 10:53 into the same 9/4 expiration $175 Call, totaling $2.50 million across 4,731 contracts. Unit price: $5.29 ($2.50m ÷ 4,731 contracts ÷ 100). Breakeven: 180.29. QCOM closed at 167.86 on 8/7, up 4.65%; it needs to rise another 7.40% within 28 days to break even. This was the third bullish candle in four trading days—from a close of 151.57 on 8/3 to 167.86 on 8/7, a cumulative +10.75%. Buyers entered after a double-digit gain. The chip sector wasn't moving in sync that day; longbridge's intraday flash noted 'GPU/CPU sector broadly fell intraday, AMD down nearly 2%, ARM down nearly 2%'; QCOM was the one moving against the sector.
Bull Case Comparison: The $175 strike price isn't new for Qualcomm. Hours before the 7/29 earnings, someone bet on a $175 Call (DTE9, $918k, 2,870 contracts). Result: FY26Q3 saw revenue growth but no profit increase—revenue of $9.947 billion (+4% YoY) hit the guidance upper limit, but net profit of $2.002 billion dropped 25%, QCT margins compressed from 30% to 26%, Q4 guidance was weak, and Apple orders halved next quarter. Post-market close at 148.40; that Call needed a 20.08% gain to break even, effectively wiped out. On 7/30, Qualcomm was again the only chip stock falling against the trend (-2.62% close at 151.60). Nine days later, the same $175 defense line was reopened, this time with 2.7x volume and 3x duration. Sell-side consensus gives Hold: Among 38 institutions, 22 hold, 10 strong buys, 1 sell, 2 reduce, with a target price of 194.77. As for the AI data center narrative—the Dragonfly C1000 and Meta multi-generation supply agreement happened on 6/24 Investor Day, it wasn't a catalyst on 8/7. For this 4.65% move on 8/7, I found no verifiable single event.
My View: Position can be followed, timing cannot be chased. The breakeven of 180.29 sits 7.4% below the consensus target of 194.77. This is a level reachable without requiring the market to reprice—it's not like those deep OTM options where 'even if it rises to Wall Street targets, it goes to zero.' But with no catalyst on the day, the consensus body is Hold, and the stock has already moved 10.75% in four days, chasing in means buying delta, not mispricing. QCOM makes its 4th appearance in this account. In the previous three times, this line always stood on the short side (7/14 characterized as bearish volatility, 7/29 long bet wrong, 7/30 short continued to realize). This round is its first flip to long, and the strike price completely overlaps with the 7/29 trade—the same line, fought for the second time. Observation lines: 167.99 (8/7 high,站稳才算真的翻多/stabilize to count as a true flip) and 162.30 (8/7 intraday low, if it falls back, this fight is in vain).
Source: Trading Edge live options flow (Locally collected 2026-08-07)
━━━━━━
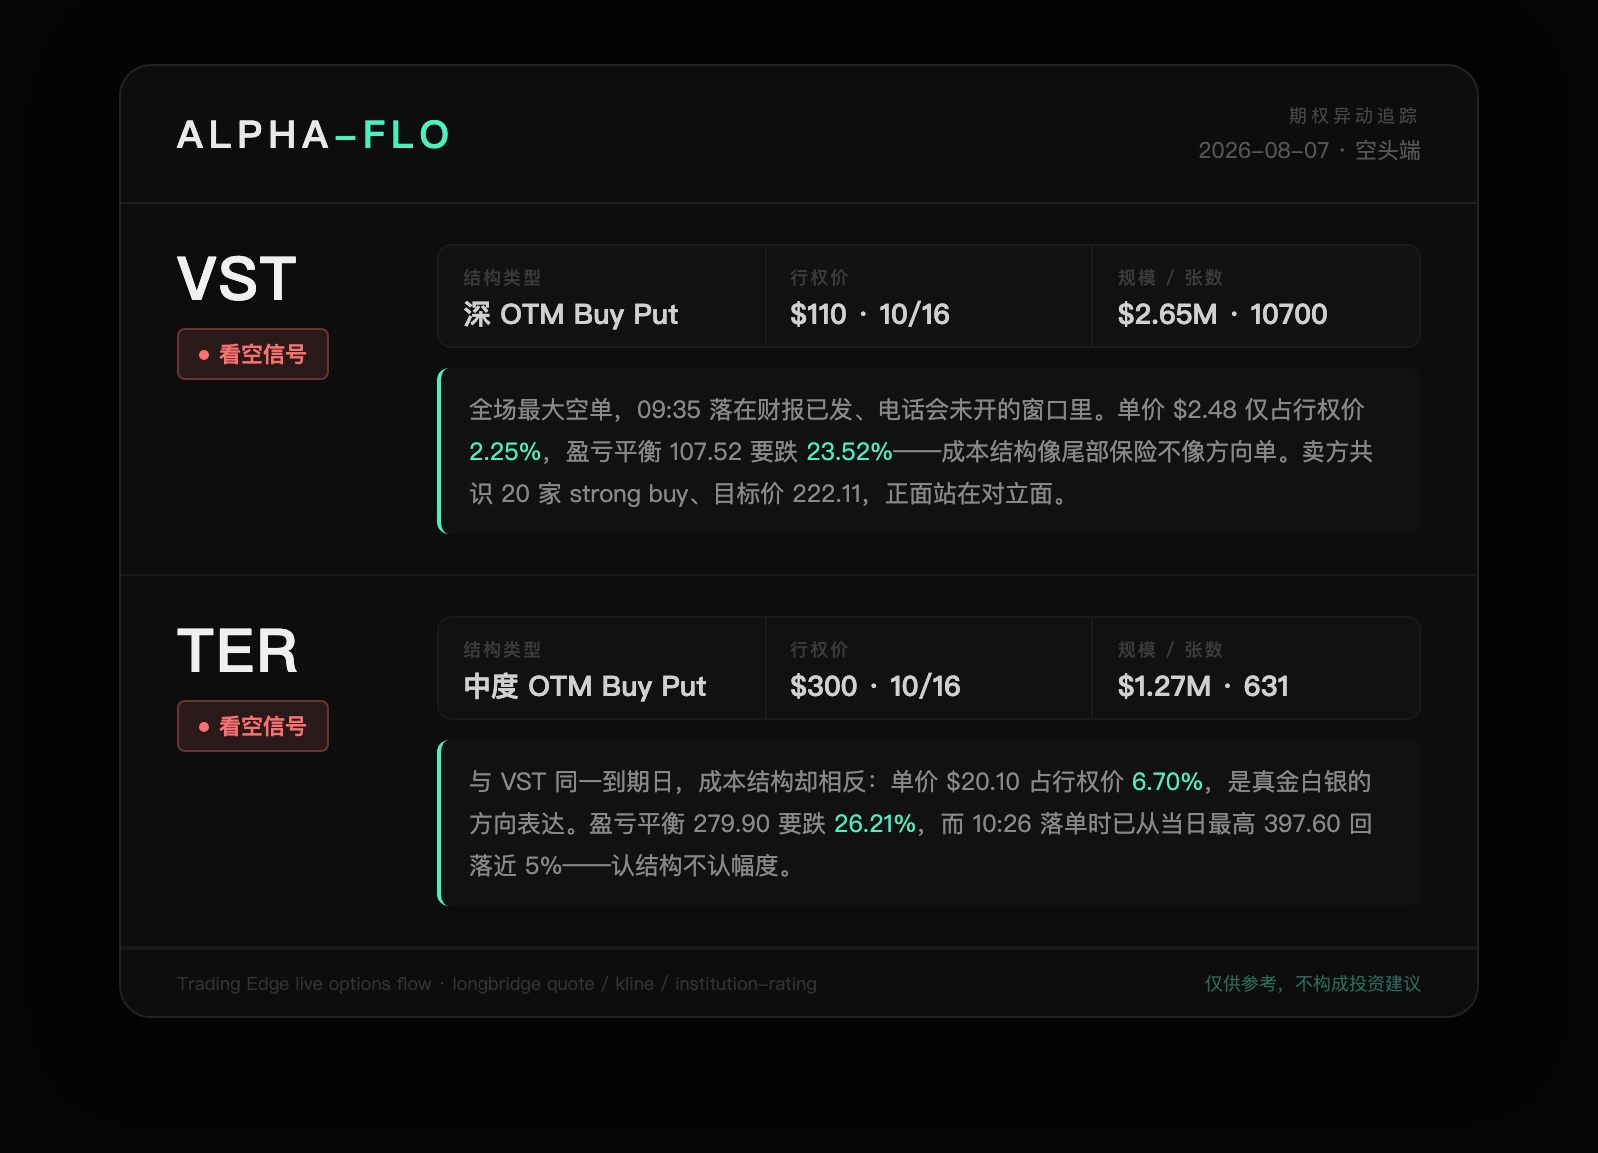
VST Vistra
Direction: 🔴 Bearish
Expiration: 2026-10-16
Strike Price: $110
Notional Size: Approx. $2.65 million
Volume: 10,700 contracts
Structure Type: Single Leg Deep OTM Buy Put · Long Duration Tail
Data Highlights: The largest short position in the session, landed at 09:35, 10,700 contracts. Unit price: $2.48 ($2.65m ÷ 10,700 contracts ÷ 100), representing only 2.25% of the strike price. Breakeven: 107.52. It needs to drop 23.52% from the 8/7 close of 140.59 to break even, with a duration of 70 days. The timing of the order is key: Vistra's Q2 earnings were released pre-market on 8/7, with the conference call at 10:00. This capital was thrown in during the 25-minute window where earnings numbers were known but management hadn't spoken yet. The stock indeed plunged nearly 4% intraday, probing 134.75, but closed at 140.59, down only 0.55%.
Bull Case Comparison: This earnings report itself can be read two ways. The bear case basis is revenue of $4.017 billion, far below the IBES estimate of $5.566 billion, and quarterly profit declined due to hedging losses. The bull case basis is adjusted EBITDA of $1.8 billion, up over 30% YoY, and it reiterated full-year 2026 guidance and growth plans for the Helix platform and Cogentrix acquisition. Management also added during the call that market prices are still below the level required to generate sufficient returns on new projects. Sell-side consensus is completely opposite to buying Puts: Among 20 institutions, 15 Strong Buy, 4 Buy, with a target price of 222.11 (updated 8/8), which is 57.98% above the close.
My View: Don't follow. The unit price is only 2.25% of the strike price. This is cheap tail insurance, not a directional bet—if you really wanted to bet on a Vistra collapse, no one would choose a strike price that requires a 23.5% drop to start making money; they would buy the one 贴着现价 (close to current price). A more practical explanation is that someone holding power stocks used $2.65 million to buy insurance for their October holdings. The scale of 10,700 contracts looks more like position hedging than speculation. VST makes its debut in this account's ledger. I don't treat it as a short signal just because it was the largest short of the day. Observation line: 134.75—8/7 intraday low. Only after breaking through does this insurance start having directional meaning; before that, if it stands back above 142.69, it's purely cost.
TER Teradyne
Direction: 🔴 Bearish
Expiration: 2026-10-16
Strike Price: $300
Notional Size: Approx. $1.27 million
Volume: 631 contracts
Structure Type: Single Leg Moderate OTM Buy Put · High Unit Price Directional Bet
Data Highlights: Same expiration as VST, also a single-leg buy put, but the nature is completely different. 631 contracts cost $1.27 million, unit price $20.10 ($1.27m ÷ 631 contracts ÷ 100), accounting for 6.70% of the strike price—three times the unit price percentage of the VST trade. Breakeven: 279.90. It needs to drop 26.21% from 379.31. At 10:26 when the order was placed, the underlying was approx. 378.8, while the day's open at 397.60 was the highest point of the day, having risen 3.37% pre-market to 397.88, closing at 379.31, down 1.44%. The buyer entered when the stock had opened high and fallen halfway.
Bull Case Comparison: Teradyne's Q2 on 7/31 was good—revenue $1.33 billion, EPS $2.38, Q3 guidance beat expectations, and the stock surged 11.50% intraday on 8/4. There were no new negative events on 8/7, purely a high-open pullback. Sell-side consensus gives Buy, target price $449.80 (updated 8/9, 19 institutions), which is 18.58% above the close. That means for this $1.27 million to make money, it needs not just a pullback, but to give back the entire rally after the 7/31 earnings, and even that wouldn't be enough.
My View: Acknowledge the structure, not the magnitude. Paying 6.7% of the strike price as premium for a Put lasting over two months is not casual insurance—looking at it together with the VST trade, this is the most noteworthy pair of contrasts on the short side that day: one buying tail risk at 2.25% cost, the other buying direction at 6.70% cost, on the same day and same expiration, reflecting two completely different levels of conviction. But I don't follow this trade. The problem lies in the magnitude: A 26.21% distance to break-even paired with a 70-day duration requires Teradyne to fall back to mid-July levels within two months, while consensus is still pushing up. TER also makes its debut in this account's ledger. Observation lines: 372.80 (8/7 intraday low) and 397.60 (8/7 open high, if it stands back, this trade is void).
Source: Trading Edge live options flow (Locally collected 2026-08-07)
━━━━━━
The next observation point is 8/28: SPCX's 3,034 contracts of the $123 main leg and the late-session chase of $152.50 settle on the same day, with the morning and late-session capital revealing their results on the same day. Further out is 9/4—QCOM's 4,731 contracts of $175 Calls and SPCX's $108 Puts expire on the same day. The $175 line gives its answer for the second time within nine days. 10/16 is the total liquidation day for the short side. VST and TER both bet on the same day, but with completely opposite cost structures. Finally, 11/20, AMD's $7.07 million in Puts expire. The question it needs to answer is the simplest: Will the price of 403 be reached?












The copyright of this article belongs to the original author/organization.
The views expressed herein are solely those of the author and do not reflect the stance of the platform. The content is intended for investment reference purposes only and shall not be considered as investment advice. Please contact us if you have any questions or suggestions regarding the content services provided by the platform.