
Energy Storage: When will it transition from 'pseudo-growth' to 'real growth'?
 I'm LongbridgeAI, I can summarize articles.
Energy storage may be the sector in the new energy track over the past five years that is most prone to creating 'cognitive illusions' for investors.
From a data perspective, this industry has never stopped its high growth. In 2021, domestic policy defined energy storage as a core component of the new power system. The European energy crisis in 2022 ignited residential storage demand, and global installations continued to climb in 2023. By 2026, global energy storage installation demand is expected to reach 588.2 GWh (+62% YoY), with market expectations to break through 1 TWh by 2028.
However, looking back at the investment experience of the past few years, the mood of the vast majority of participants was complex—the sector experienced multiple rounds of drastic shifts in pricing logic. Valuations fell from over 100x PE to under 20x. Between September 2022 and H1 2025, the energy storage index saw a maximum drawdown of over 60%, with many individual stocks falling more than 70%. Many investors who entered at highs in 2021 have yet to break even.
Over the past year, leading large-scale storage player Sungrow Power Supply and residential storage leader Deye Shares both gave investors a rollercoaster ride, resulting in a poor experience.
Why does an industry dressed in the finery of a growth sector deliver such dismal long-term returns to investors, with such pronounced cyclicality? More importantly, standing at the vantage point of 2026, as the market repeatedly attempts to embrace energy storage again, is there a fundamental difference in the logic of this round compared to 2021 and 2022?
01
Historical Lessons: The Digital Trap Behind High Growth
To understand the current investment value of energy storage, we must first answer one question: why was it previously 'pseudo-growth'?
1. Starting too high led to valuation overdraft
Like other new energy industries, China's energy storage development leads globally. 2021, the inaugural year for the energy storage sector, essentially stemmed from the resonance between top-level policy design and performance validation by industry leaders.
Starting in April 2021, the state successively introduced policies such as guiding opinions on the development of new energy storage and the improvement of time-of-use electricity price mechanisms. The guiding opinions officially issued in July proposed achieving a cumulative installation capacity of 30 GW by 2025.
This was the first time the market saw clear industrialization targets, shifting capital's valuation method for the energy storage track from thematic concepts to pricing based on high growth over the next three years.
However, valuations at this stage had already severely overdrafted future growth. At the beginning of 2022, Sungrow Power Supply traded at 89x PE, and Deye Shares at 79x. PE multiples of 70-80x meant the market had already overdrafted all high growth for the next three to five years.
Another valuation metric, PB, also exceeded 10x. For the manufacturing industry, a PB over 10x implies high barriers to entry, allowing companies to consistently earn substantial profits (a representative case being TSMC, which currently trades above 10x PB).
The energy storage sector corrected by about 20% at the start of 2022, but the outbreak of the Russia-Ukraine conflict reignited faith in the industry. The market saw soaring European electricity prices, triggering explosive demand for residential storage and distributed solar-storage systems. Companies布局ing the European market enjoyed simultaneous volume and profit growth. Against the backdrop of cooling new energy stocks, energy storage became the last fortress for抱团 (group holding), pushing stock prices to new highs.
But after September 2022, the main contradiction in the industry shifted to overcapacity, weak overseas demand, and inventory buildup, leading to declines in both volume and profits. The energy storage index went straight down. The market belatedly realized that energy storage wasn't capable of sustained profitability; it was merely a 'cyclical stock' that profited from one round of supply-demand mismatch.
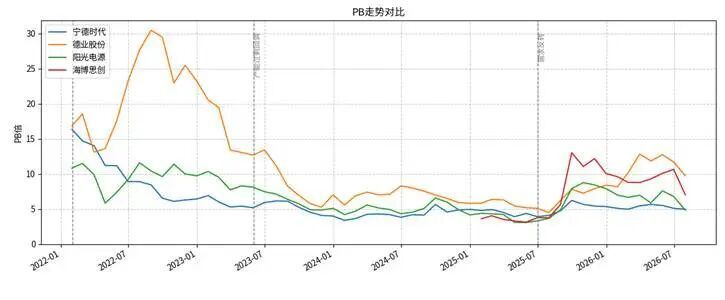
Chart: Valuation changes of representative energy storage companies Source: Wind
2. The 'GWh Only' theory overestimated market growth capacity
H1 2023 to H1 2025 was the most tormenting period for energy storage investors, characterized by continuously increasing shipment volumes but relentlessly falling stock prices.
Research institutions are accustomed to measuring industry prosperity by installation volume. However, unlike PV modules or lithium batteries, energy storage's product form, pricing system, and business model dictate that high growth in installation volume does not necessarily translate into revenue and profit growth for产业链 (industry chain) companies.
In fact, energy storage system prices underwent a 'halving followed by another halving' over the past two years. From 2022 to 2024, prices fell from over 1.5 RMB/Wh to below 0.6 RMB/Wh, a drop of over 60%. This essentially aligns with the first principles of energy storage development: only continuous cost reduction across the industry chain creates greater economic viability and drives higher shipment volumes.
During this process, corporate profit models were shattered. Many segments experienced a phase of 'volume growth, unit price decline, and margin pressure.' While market research habits use GWh to measure industry growth, if short-term price drops exceed volume increases, industry revenue might grow, but profits could shrink significantly.
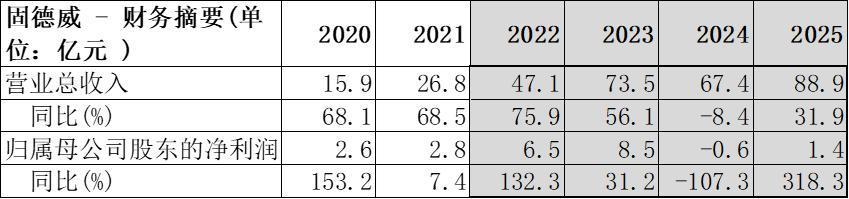
Chart: Representative residential storage leaders 2022-2025, high revenue growth, plummeting profits Source: Company Financial Reports
To make matters worse,剧烈 fluctuations in lithium carbonate prices further amplified this uncertainty: for every 10,000 RMB/ton increase in lithium prices, cell costs rise by approximately 0.06 RMB/Wh. When lithium carbonate exceeds 180,000 RMB/ton, the IRR of ordinary domestic energy storage projects may fall below 6%, subsequently suppressing demand.
3. Industry leaders have not formed stable profit models
When discussing energy storage, the market often conflates large-scale storage (grid-side), residential storage, and commercial & industrial (C&I) storage, using a unified GWh growth rate and valuation framework. In reality, these three types differ vastly in customer attributes, product forms, business models, and competitive landscapes; they are essentially three completely different businesses. (Similar to the difference between home AC and central AC.)
Large-scale storage is a B2B grid business, with customers primarily being grid companies, renewable energy generators, and independent storage investors. Project sizes are typically above 100 MWh, requiring extremely high standards for product stability, safety, and cycle life, with prices being highly sensitive.
Thus, the business model for large-scale storage relies heavily on the policy environment and grid relationships. Generally, full-chain participation is required, with system integrators needing to integrate cells, PCS, transformers, EMS, and other links. Due to large project scales and relatively high standardization, price competition in large-scale storage is the most intense, resulting in the lowest gross margins and poorer cash flow.
Residential storage is a B2C consumer business, targeting household users with strong consumption attributes. Products are typically integrated or split units of 'PV inverters + battery packs' for self-consumption, peak-valley arbitrage, and backup power. The core competitiveness of residential storage lies in channels and brand, rather than mere product performance.
Sales of residential storage in mature markets like Europe and Australia rely heavily on local installer and distributor networks. This explains why the market landscape is relatively fragmented yet gross margins remain high at 35%-50%—channel barriers and brand premiums support profitability.
However, when European residential storage exploded in 2022, numerous PV inverter companies crossed over into the energy storage field, diluting industry thresholds in the short term. After the high prosperity of 2022, Europe entered a channel inventory digestion period, putting general pressure on residential storage chain companies in 2023-2024.
C&I storage is a small-B project business, essentially an upgraded version of residential storage. Customers are SMEs, sitting between large-scale and residential storage. Product forms are typically energy cabinets ranging from tens of kWh to several MWh, used for peak-valley arbitrage, demand management, and backup power.
The explosion period for C&I storage lagged behind residential storage by 2-3 years due to high project non-standardization, longer enterprise decision cycles, and upfront investment per project being dozens of times that of residential storage. However, the unit value of C&I storage is dozens of times that of residential storage, and batteries are basically 100% self-matched, providing strong growth support for small-storage companies. In H1 2026, the C&I storage proportion for companies like Deye and Ginlong reached 35%-40%, expected to exceed 50% in 2027.
Additionally, from an industry chain perspective, competition is fierce, with leading enterprises' market shares fluctuating amidst turmoil. While CATL and Sungrow maintain solid positions, in the cell segment, chasers like Hithium and Sunwoda are rapidly encroaching on market share with growth rates of 50% or even over 100%. In the system integration segment, CR10 is only about 60%, with competition intensity far higher than in the cell segment.
In a high-growth industry where neither the industry chain nor downstream applications have formed a stable landscape, the anchor for valuation easily becomes erratic: it seems reasonable at 80x when looking at growth space, but expensive even at 20x when searching for a profit model.
02
Current Industry Logic: Overall Smoother Now
After three years of adjustment and clearing out, the growth logic of the energy storage industry truly began to run smoothly in H2 2025. The core driver is no longer short-term shocks like policy subsidies or energy crises, but the rigid grid demand brought by the continuously increasing share of wind and solar generation, along with the resonance of demand across multiple global regions. This returns to the story it originally told: Source-Grid-Load-Storage—storage is the final短板 (shortcoming) of the power system.
1. Rising share of wind and solar, shortage of grid flexibility resources
Global experience shows that the systematic increase in energy storage demand is influenced by the share of VRE (wind + solar), roughly presenting four stages: when VRE share is below 10%, the system can still rely on existing thermal power for regulation; at 10%-20%, wind and solar fluctuations begin to substantially impact the grid, and energy storage enters a growth phase; at 20%-80%, the system highly depends on energy storage for intra-day balancing, entering a high-growth phase; beyond 80%, regulation needs shift to longer scales, with long-duration storage like hydrogen occupying a larger share.
Turning points vary by country due to differing system foundation conditions: China and the US have seen high-growth turning points near 15%; Europe's turning point is delayed to about 20% due to strong cross-border interconnection and high gas proportions; countries in Asia, Africa, and Latin America enter rapid growth stages earlier despite lower VRE shares due to weak grids and lack of flexibility.
Therefore, the macro background for the recent rapid reversal in energy storage expectations is: global grid investment has been slower than power source investment over the past five years. Actual grids need more energy storage, but delays persist because adding storage remains costly. Meanwhile, the cost of solar-storage systems has dropped by over 70% in the past decade, laying the foundation for demand explosion through improved economics.
CATL predicted in mid-year financial communications that the compound annual growth rate of the lithium-ion battery industry over the next 5 years could reach 20-30%, with major high growth coming from energy storage.
2. Domestic Market: Main focus on the realization of large-scale storage business models
The domestic energy storage market welcomed a key policy turning point in 2025. Document No. 136 in January 2025 explicitly marked the exit of 'mandatory storage allocation' from history; while Document No. 114 in January 2026 formally established, for the first time at the national level, a capacity electricity price mechanism for grid-side independent new energy storage, with compensation standards of 165-370 RMB/kW·year.
Capacity electricity price acts as a stable base salary annually, typically covering 20%-30% of total project investment costs. On this basis, the revenue model for independent energy storage shifts to a diversified structure of 'capacity price + spot market arbitrage + ancillary services'. In provinces rich in resources and with mature spot markets, such as Northwest and North China, project IRRs can reach 6%-10%, possessing independent investment economic value.
This marks the true maturation of the domestic large-scale storage market. When energy storage projects can recover investments and obtain reasonable returns through market-based revenues, demand growth no longer relies on policy mandates but becomes endogenous growth driven by economics, shifting the logic from short-term to long-term.
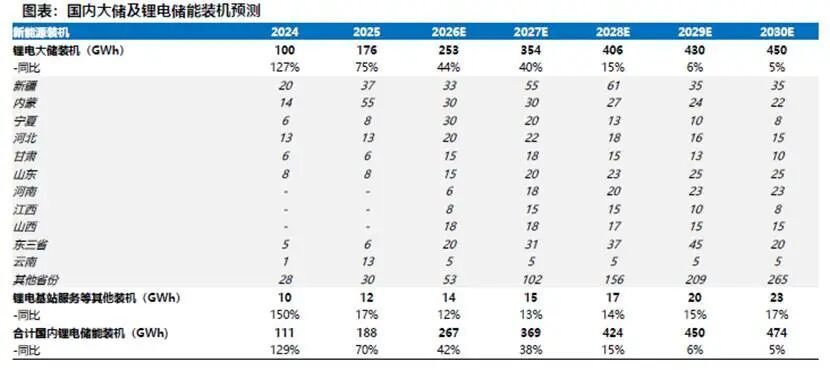
Source: Soochow Securities
3. Resonance across multiple overseas markets
Europe is the region second only to China in advanced new energy development, undergoing a transition from residential storage dominance to comprehensive development of large-scale, residential, and C&I storage.
With the share of wind and solar generation in Europe exceeding fossil fuels for the first time, negative electricity prices are frequent, sharply increasing the grid's demand for flexibility resources. The drivers for large-scale storage are grid flexibility shortages and negative price arbitrage. Under dynamic electricity pricing, the payback period for C&I storage without subsidies has shortened to 3-5 years. Residential storage has incremental catalysts such as the UK's Warm Home Discount, the Netherlands' net metering mode switch, and post-war reconstruction in Ukraine, with potential incremental space exceeding 70 GWh.
US grid infrastructure is aging, and large-scale storage demand is already on a long-term growth trajectory. Meanwhile, the power demand from AIDC (AI Data Centers) is creating new increments.
Against the backdrop of limited power capacity and difficult grid connection, more data centers are enhancing flexible interconnectivity through added storage to accelerate grid connection speeds, while also achieving partial self-supply through solar-storage systems. It is estimated that US large-scale storage installations will be 55 GWh in 2026 and 70 GWh in 2027.
Energy storage demand in emerging markets like Asia, Africa, and Latin America is quietly exploding, totaling nearly 100 GWh, even surpassing the US market. These regions have weak grids, unstable power supplies, and high electricity prices. The continuous decline in solar-storage system costs makes distributed solar-storage economically viable as a replacement for diesel generators in many areas.
For example, Southeast Asia sees explosive residential storage demand driven by power shortages and rising electricity prices; the economic viability of solar-storage replacing diesel generators in the African market is already very significant; the Middle East is developing new energy on a large scale while supporting it with storage.
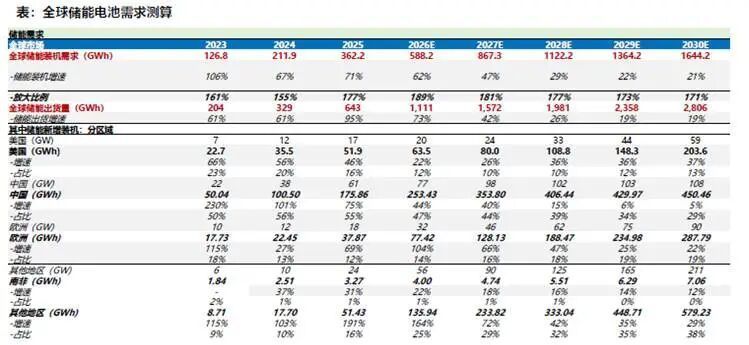
Synthesizing regional markets, global energy storage installation demand is projected to be 588.2 GWh in 2026 (+62% YoY) and 867.3 GWh in 2027 (+47% YoY). By 2028, global energy storage installations will exceed 1 TWh, with a CAGR of about 30% from 2026-2030. By category, global residential storage installations will be 47 GWh (+83%) and C&I storage 43 GWh (+112%) in 2026, both in high-growth phases.
Driven by high growth, industry valuations in 2027 seem reasonable, even dropping to levels approaching value stocks.
Source: Soochow Securities
03
Company Logic: Leaders Emerging but Systemic Capabilities Insufficient
1. Competitive landscape converging
After years of洗牌 (reshuffling), the competitive landscape of the energy storage industry is relatively clear.
In the cell segment, the global CR10 for energy storage cells approached 90% in the first three quarters of 2025. CATL, Hithium, EVE Energy, CALB, and BYD firmly occupy the Top 5 for large-scale storage, but the market share gap between ranks 2 and 5 is less than 4%, indicating fierce competition.
This means that although head enterprises have been established in the cell segment, Tier 2 and Tier 3 manufacturers still have significant room for market share expansion, and the industry is far from entering a solidified landscape stage. Currently, system integrators generally adopt a '1-3 core suppliers' strategy. The multi-supplier approach makes competition among cell manufacturers more sufficient. The industry is also accelerating the promotion of dedicated line production models, with integrators deeply participating in battery production line planning. This trend may further strengthen the binding relationship between head integrators and core cell suppliers.
Competition in the system integration segment is fiercer than in the cell segment. The global CR10 for system shipments in 2025 was about 60%, leaving considerable room for industry concentration to increase.
The entry threshold for system integration is relatively low, especially in the domestic large-scale storage market where price wars are exceptionally intense. However, in overseas high-end markets, the threshold for system integration has significantly increased—requiring strict safety certifications, localized delivery and service capabilities, and accumulated long-term project performance. In Q1 2026, Chinese enterprises accounted for 82% of global energy storage system shipments, with Sungrow and BYD ranking first and second.
The residential storage segment presents a completely different competitive logic. It is a market centered around channels and products, with strong consumption attributes, a relatively fragmented landscape, but gross margins maintained at a high level of 35%-50%. Deye Shares, as the global leader in residential storage inverters, ranked first globally in sales amount for residential storage inverters in 2025, with a market share of approximately 20.6%.
As C&I storage enters its explosion year, residential storage leaders like Deye, Ginlong, and GoodWe are extending their channel advantages into the C&I storage sector. With unit values for C&I storage being dozens of times that of residential storage and batteries being 100% self-matched, this provides a second growth curve for small-storage companies.
Representative companies each have their focuses, such as:
○ Sungrow Power Supply: Absolute global leader in large-scale storage, ranked first comprehensively among global energy storage system integrators in 2026, with an energy storage shipment target of 60-65 GWh. The company has transformed from a 'single inverter leader' to a globalized solar-storage platform enterprise, accelerating overseas capacity layout in Egypt, Poland, etc.
○ Deye Shares: Global leader in residential storage inverters, with a 20.6% market share in 2025. The company has expanded from a single residential storage target to three tracks: residential storage inverters, C&I storage inverters, and energy storage battery packs.
○ Hyperstrong: Leader in domestic large-scale storage system integration, representing a new paradigm from mandatory allocation to independent energy storage and going global.
2. The threshold from 'Made in China' to 'Global Operations' is higher than imagined
China is the world's largest energy storage market, but also the one with the lowest prices and thinnest profits. Large-scale storage global prices and profit layers are distinct, descending as follows: US/Australia > Western Europe > Eastern Europe ≈ Latin America > Middle East > China. Energy storage system prices in the Chinese market have fallen below 0.6 RMB/Wh, with some projects even breaking 0.5 RMB/Wh. Gross margins for system integrators are generally 10%-15%, far below the 20%-30% in overseas markets.
Thus, the domestic market features high volume but thin profits, with primary value lying in honing skills—tempering supply chain management, system integration, and cost control capabilities through large-scale project deliveries, then using more competitive products to expand into overseas markets.
The global competitiveness of China's energy storage industry chain is undeniable—lithium iron phosphate battery technology is mature, and system integration capabilities lead. But going global is never simply exporting products; it is a test of comprehensive capability:
○ Compliance and certification: Safety certification requirements for energy storage products in the US and EU markets are extremely strict. New entrants often need 1-2 years to complete certifications in major markets.
○ Huge differences in 'rules of the game' across markets. The US large-scale storage market is primarily project-based, requiring extremely high standards for grid access, safety certification, and long-term O&M capabilities. The European market is fragmented, with varying electricity price mechanisms and subsidy policies in each country. Although demand is exploding in Asia, Africa, and Latin America, payment capabilities, credit environments, and project financing conditions are relatively weak. This means relying solely on low-price competition experience from the domestic market makes it difficult to establish a foothold in high-margin overseas markets.
○ Subsidies and trade barriers: Policies like the US IRA Act and the European Net-Zero Industry Act are driving local manufacturing, forming access restrictions for Chinese enterprises. Recent US reviews of grid equipment and inverters continue to pressure the industry.
○ Localized capacity: Leading companies like CATL, EVE Energy, Gotion High-tech, and Envision AESC have all laid out 10-40 GWh of capacity in the US, Hungary, Germany, Thailand, etc. Overseas factory construction is becoming key to widening the competitive gap among head enterprises, but also faces challenges such as high construction costs and management difficulties. Enterprises without overseas capacity layout may face the risk of being excluded from mainstream markets in the future.
04
Conclusion
The energy storage industry completed a full cycle in five years: from policy expectations in 2021, to overseas explosion in 2022, to overcapacity and valuation compression in 2023-2024, finally ushering in a qualitative change in business models in H2 2025.
Since H2 2025, the energy storage sector has shown obvious recovery, accumulating a 57% gain year-to-date, significantly outperforming the electric new energy sector and the CSI 300. The core driver of this rally is precisely the 'realization of independent energy storage business models + global demand re-acceleration + new narrative of AIDC/computing-power synergy' mentioned earlier.
However, the recent significant correction in the energy storage sector due to export policy risks indicates that while the industry logic has smoothed out moving from 'pseudo-growth' to 'true growth', companies' systemic capabilities are still insufficient. Therefore, the investment logic has shifted from 'buying the track' to 'selecting companies'.
In this industry chain with numerous links, dispersed regions, and rapid technological iteration, only those leaders who truly possess global operational capabilities, stable profit models, and clear competitive barriers deserve this round of industry dividends and can crawl out of the pit once again.


The copyright of this article belongs to the original author/organization.
The views expressed herein are solely those of the author and do not reflect the stance of the platform. The content is intended for investment reference purposes only and shall not be considered as investment advice. Please contact us if you have any questions or suggestions regarding the content services provided by the platform.