
SKILL Workshop | Breakout win rate looks high? Don’t treat it as a signal yet
 I'm LongbridgeAI, I can summarize articles.
SKILL Workshop · Issue 6 · Breakout Backtest
Ming has his eye on a stock that just hit a new high. The backtest says: nearly 70% of the time, it was up 20 days after a breakout.
Just as he was about to act, Uncle Leo asked one question:
“This stock has been rising for the past year anyway. If I bought on a random day and held for the same 20 days, what would the odds of a gain be?”
Run the numbers and it’s also over 60%. Subtract one from the other, and the breakout really adds less than two points.
Ming thought he’d caught a signal. Most of it was just the “this stock was already rising” backdrop.
💻 Breakout Backtest helps you see through a win rate: whether it can be trusted, and whether it counts as a signal.
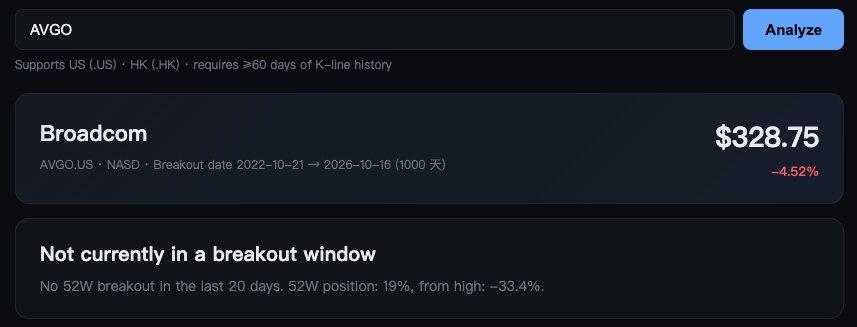
Add a baseline, and the win rate becomes readable
Most tools give you one good-looking win rate. This radar does three more things:
✅ A baseline. The baseline is the odds of a gain if you bought the same stock on any day and held for the same number of days. Win rate minus baseline is the breakout’s true excess. For example, 69% minus a 67% baseline leaves an excess of just 2 points, which is of limited use.
✅ A confidence range. A stock may break out only a dozen or so times in four years, so the sample is small. The radar adds an interval: say the true range is 44% to 86%. If that straddles 50%, it’s hard to call it a signal.
✅ Lit up only if it holds up. A cell is coloured only when the excess is large enough and the interval sits above the baseline; otherwise it’s greyed out. In testing, over 90% of cells are grey: in most cases the sample simply isn’t enough to draw a conclusion.
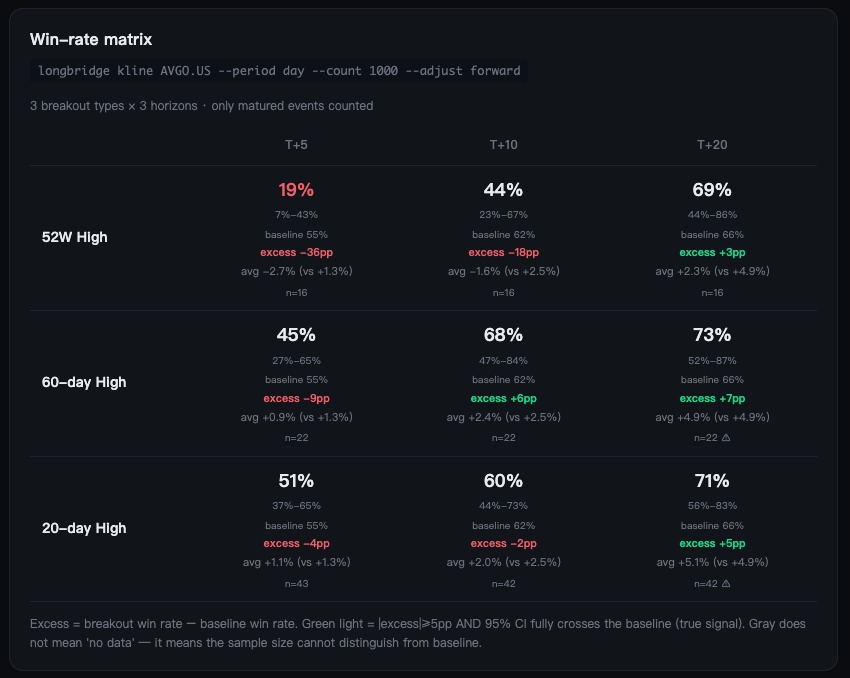
What you see on one screen
- 9-cell win-rate matrix: three breakout types (52-week / 60-day / 20-day highs) × three windows (5 / 10 / 20 days later), each cell with its baseline and excess
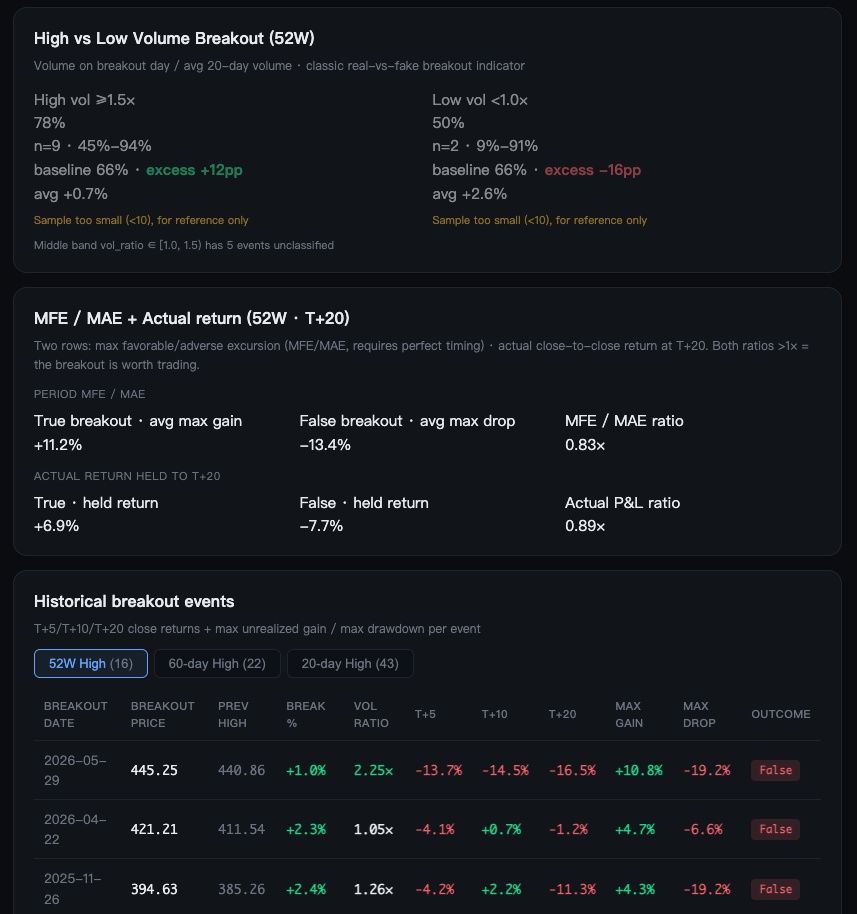
- High vs low volume: uses the stock’s own history to test whether the old saying “high volume is real, low volume is fake” actually holds
- Real vs fake breakout paths: how far the real group rises at best on average, how far the fake group falls at worst on average, and what holding to day 20 actually earned or lost
- Every breakout in detail: price on the day, previous high, volume ratio, the move over the next 5/10/20 days and the real/fake label, one row per breakout
- Candlestick markers: over the past few hundred days, where each breakout happened and whether it was real or fake, all marked on the chart
Data comes from 4 Longbridge CLI commands
The radar’s algorithm isn’t complicated. The hard part is clean data on a consistent basis, and these few commands are enough:
klinepulls 4 years of daily candlesticks, used to find breakouts, calculate what happens next and work out volume multiplesquotefetches the live price andstaticthe company name and exchange, for the first screenmarket-statuschecks whether the market is open
Breakout Backtest · install in 3 steps
Prerequisite: Longbridge Skill (CLI) must be installed first before this
.skillpackage can be downloaded and run.
1️⃣ Tap the download link to get the ZIP file (no need to unzip it — import it straight into your AI assistant)
2️⃣ Open your AI assistant, find [Skill Centre / Plugin Centre] → tap Import → select the ZIP file; or drag the ZIP into the chat box and follow the prompts.
3️⃣ Send “Open Breakout Backtest”, and your browser opens automatically.
Longbridge Skill · how to install
For step-by-step guides, see: Skill user guide, Official installation guide
⚠️ Skills only run in supported assistants such as Claude. The
.skillpackage can’t be opened on its own.
🎁 Comment to win!
Join in either way:
1. Share a screenshot: post a screenshot of your result from Breakout Backtest
2. Make a request: tell us which tool you’d most like SKILL Workshop to build next
Everyone who joins gets 288 Task Coins, and we’ll draw 1 valid participant at random to receive an AI Exclusive Pro Card (30 days), worth HK$148.
Campaign period: now until 7pm on 28 October 2026. Rewards will be issued within 15 working days after the campaign ends.
*This tool is for research and educational purposes only and does not constitute investment advice. Longbridge reserves the right of final interpretation.
The copyright of this article belongs to the original author/organization.
The views expressed herein are solely those of the author and do not reflect the stance of the platform. The content is intended for investment reference purposes only and shall not be considered as investment advice. Please contact us if you have any questions or suggestions regarding the content services provided by the platform.