
Aichi Electric (NSE:6623) Earnings Growth And 6.6% Margin Challenge Discounted Valuation Narrative
 I'm LongbridgeAI, I can summarize articles.
Aichi Electric (NSE:6623) reported FY 2026 Q4 revenue of ¥36.6 billion and basic EPS of ¥235.37, with trailing 12-month revenue at ¥129.4 billion and EPS of ¥907.43. The company achieved a 27.6% earnings growth and a net profit margin of 6.6%. Despite quarterly EPS fluctuations, the overall trend shows profitability improvement. The stock trades at a P/E of 8.4x, below industry averages, with a dividend yield of 2.88%. Investors are encouraged to consider long-term trends rather than short-term volatility in their assessments.
Aichi Electric (NSE:6623) has wrapped up FY 2026 with fourth quarter revenue of ¥36.6 billion and basic EPS of ¥235.37, while trailing 12 month revenue sits at ¥129.4 billion with EPS of ¥907.43. Over the past year, the company has seen revenue move from ¥120.3 billion to ¥129.4 billion and trailing EPS advance from ¥710.99 to ¥907.43, alongside a net profit margin of 6.6% and described high earnings quality that support a more efficient earnings base. Taken together, these results indicate a period in which profitability and income generation have held up for shareholders.
See our full analysis for Aichi Electric.
With the latest earnings picture in place, the next step is to see how these numbers line up against the main narratives investors follow around Aichi Electric and where those stories might need a rethink.
Curious how numbers become stories that shape markets? Explore Community Narratives
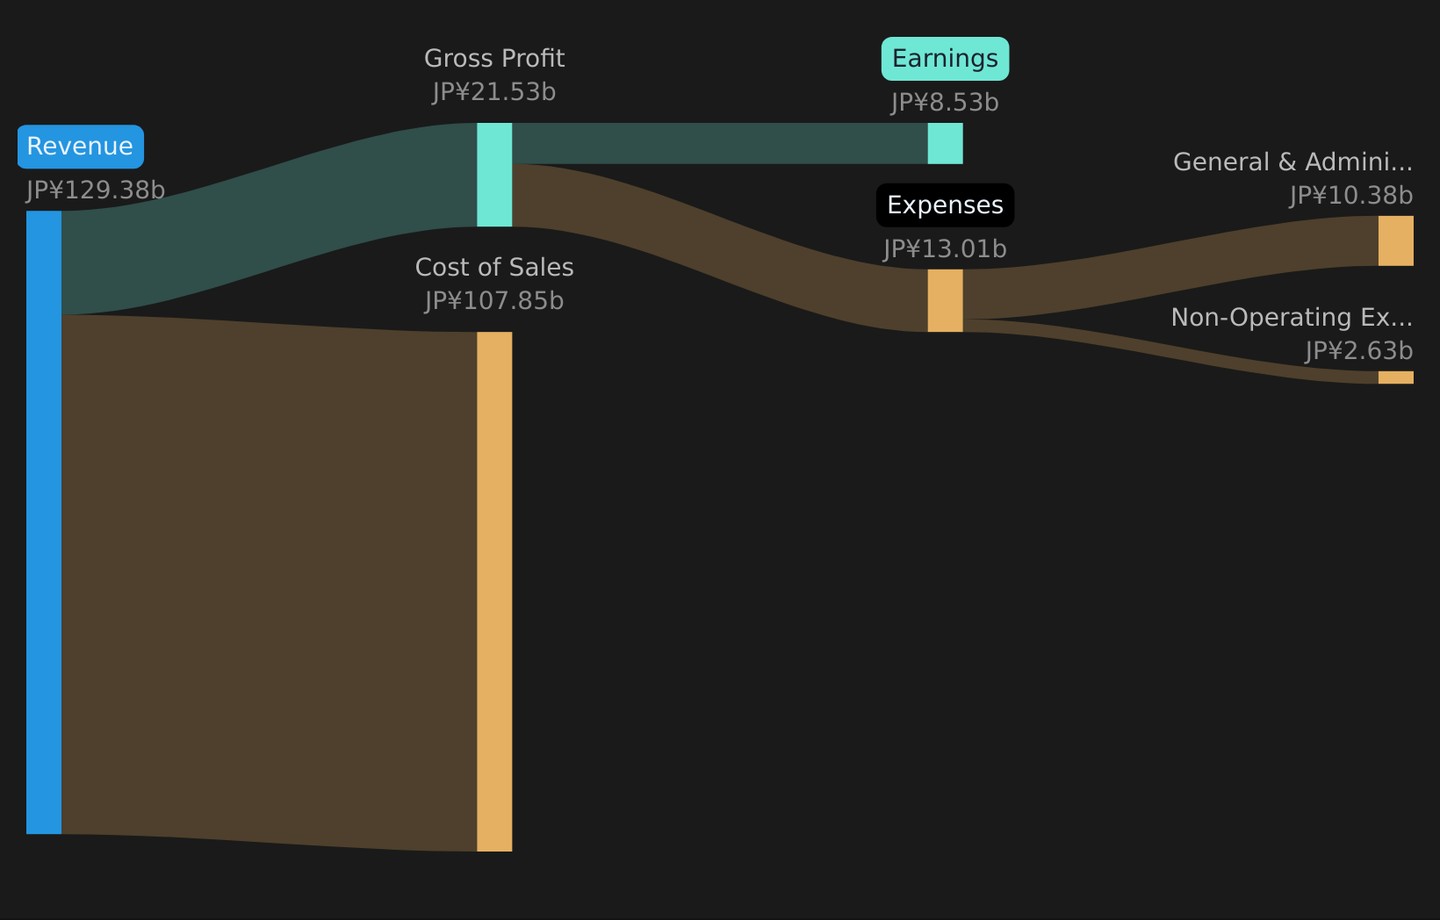
27.6% earnings growth and margin at 6.6%
- Over the last 12 months, Aichi Electric generated ¥8,527 million in net income and a 6.6% net margin, with trailing earnings up 27.6% compared with the prior year.
- What supports a bullish angle is that this 27.6% trailing earnings growth sits alongside a 10.7% per year five year earnings growth rate and a 6.6% margin, which bulls can point to as a mix of scale and profitability, while critics can still question how repeatable that pace is given there is only one year of the higher growth figure in view.
- Supporters often highlight that both the 27.6% trailing growth and the 10.7% multi year pace are tied to actual net income numbers, from ¥6,684 million a year earlier to ¥8,527 million now.
- Skeptical investors may focus on how much of the 1 percentage point margin change from 5.6% to 6.6% reflects underlying operations versus factors that might not recur, which is not detailed in the figures provided.
To see how this mix of higher margins and earnings growth fits into different long term storylines, it helps to hear how other investors connect the dots through Aichi Electric over time 📊 Read the what the Community is saying about Aichi Electric..
Quarterly EPS swings around a higher base
- Within FY 2026, quarterly basic EPS moved between ¥204.76 and ¥254.28, with ¥235.37 in Q4 sitting above the ¥179.54 level in Q4 FY 2025 and trailing 12 month EPS at ¥907.43.
- What challenges a simple bearish take on volatility is that, while skeptics might focus on EPS shifting between quarters, the step up from ¥710.99 to ¥907.43 on a trailing 12 month basis and net income rising from ¥6,684 million to ¥8,527 million shows those swings are occurring around a higher full year base, even though the exact drivers behind each quarter are not broken out here.
- Bears might single out the move from ¥254.28 in Q3 FY 2026 to ¥235.37 in Q4, but that sits against a full year pattern where each FY 2026 quarter’s EPS is above the FY 2025 figures provided.
- Supporters can counter that trailing EPS rising by almost ¥200 over the year suggests the business exited FY 2026 with more earnings per share than at the same point a year ago, despite quarter to quarter shifts.
P/E of 8.4x and 2.88% yield
- At a share price of ¥7,640, the trailing P/E of 8.4x sits below both the 15.4x peer average and the 14.8x industry average, while the stock also offers a 2.88% dividend yield and is compared with a DCF fair value of ¥9,297.28.
- One point that supports a bullish valuation case is that the shares trade below the DCF fair value of ¥9,297.28 and around 17.8% under the stated fair value estimate while also on a lower P/E than peers, yet the same numbers give more conservative investors room to ask whether the discount simply reflects differences in perceived risk or growth that are not spelled out in the dataset.
- Backers of the optimistic view can point to the combination of 27.6% trailing earnings growth, a 6.6% net margin and a 2.88% yield as evidence that the lower 8.4x P/E is not coming with obviously weak profitability in the period shown.
- More cautious holders may argue that, without itemised risk factors, it is not clear why the market is pricing Aichi Electric at a discount to both peers and the DCF fair value, so they will often want to compare this profile with other companies on similar metrics before acting.
Next Steps
Don't just look at this quarter; the real story is in the long-term trend. We've done an in-depth analysis on Aichi Electric's growth and its valuation to see if today's price is a bargain. Add the company to your watchlist or portfolio now so you don't miss the next big move.
If this combination of earnings, valuation and yield looks promising, now may be a good time to review the figures yourself and stress test the story against your own expectations. To see which strengths stand out and why investors are optimistic, take a closer look at the 3 key rewards
See What Else Is Out There
While Aichi Electric reports higher earnings and a 6.6% margin, the discount to peers and its DCF value raises questions about perceived risk and sustainability.
If that uncertainty around why the market prices this earnings profile at a discount makes you cautious, compare it with companies highlighted in the 48 resilient stocks with low risk scores for a clearer sense of alternatives.
This article by Simply Wall St is general in nature. We provide commentary based on historical data and analyst forecasts only using an unbiased methodology and our articles are not intended to be financial advice. It does not constitute a recommendation to buy or sell any stock, and does not take account of your objectives, or your financial situation. We aim to bring you long-term focused analysis driven by fundamental data. Note that our analysis may not factor in the latest price-sensitive company announcements or qualitative material. Simply Wall St has no position in any stocks mentioned.
New: Manage All Your Stock Portfolios in One Place
We've created the ultimate portfolio companion for stock investors, and it's free.
• Connect an unlimited number of Portfolios and see your total in one currency
• Be alerted to new Warning Signs or Risks via email or mobile
• Track the Fair Value of your stocks
Try a Demo Portfolio for Free