
A Look At Kubota’s (TSE:6326) Valuation After Strong Q1 Earnings And Reaffirmed 2026 Guidance
 I'm LongbridgeAI, I can summarize articles.
Kubota (TSE:6326) reported strong Q1 earnings with double-digit revenue and profit growth, reaffirming its 2026 guidance. The stock saw a 4.22% increase in one day and a 25.51% rise year-to-date, with a total shareholder return of 80.91% over the past year. Despite a P/E ratio of 14.6x, below industry averages, concerns remain about slower growth compared to the JP market and a low return on equity of 8.4%. A DCF analysis suggests the stock may be overvalued at ¥2,814, raising questions about future growth potential.
Why Kubota’s latest earnings are on investors’ radar
Kubota (TSE:6326) has moved into focus after a strong first quarter earnings release, with double digit revenue and profit growth, reaffirmed 2026 guidance, and an unchanged dividend forecast that together underline management confidence.
See our latest analysis for Kubota.
The strong earnings update appears to have fed directly into sentiment, with a 1-day share price return of 4.22% and a year to date share price return of 25.51%. The 1-year total shareholder return of 80.91% points to building momentum rather than a short term spike.
If Kubota’s move has you rethinking where industrial and automation trends could go next, it might be worth scanning the market through our robotics and automation stock ideas via the 32 robotics and automation stocks
With Kubota shares up 80.91% over the past year and trading at a modest 7.9% discount to the average analyst price target, the key question is simple: is there still a buying opportunity here or is future growth already priced in?
Price-to-earnings of 14.6x: Is it justified?
Kubota is trading on a P/E of 14.6x, which sits slightly below the Machinery industry average of 15.1x and well below the peer average of 23.1x.
The P/E ratio compares the current share price to earnings per share and is a quick way to see how much investors are paying for each unit of profit. For an established industrial business like Kubota, this often reflects what the market expects from future earnings, cash generation, and the stability of those earnings.
Here, the picture is mixed. On one hand, Kubota’s earnings growth over the past year of 9.9% exceeded both its 5 year average of 5.3% and the Machinery industry’s 7.5%, and earnings are forecast to grow 6.71% per year. On the other hand, earnings and revenue are both expected to grow slower than the wider JP market, and return on equity of 8.4% is considered low, with forecasts pointing to a similar level in three years. Against that backdrop, a P/E below the peer and industry fair P/E estimate of 24.9x suggests the market is not assigning a premium for that growth profile, and there is room for the multiple to move closer to the level suggested by the fair ratio if sentiment stays supportive.
Compared to the Machinery industry average P/E of 15.1x, Kubota’s 14.6x looks slightly restrained, and the gap to the peer average P/E of 23.1x is much wider. When set against the estimated fair P/E of 24.9x, the current multiple implies the stock is trading at a discount to the level the fair ratio points to, while still reflecting the company’s moderate growth outlook and low return on equity.
Explore the SWS fair ratio for Kubota
Result: Price-to-earnings of 14.6x (ABOUT RIGHT)
However, there are still clear pressure points, including slower expected earnings and revenue growth than the wider JP market, and a modest 8.4% return on equity.
Find out about the key risks to this Kubota narrative.
Another view: What the DCF model says
While the P/E of 14.6x hints at value, the SWS DCF model tells a different story. With the share price at ¥2,814 and an estimated future cash flow value of ¥2,632.89, the stock screens as overvalued by this method. This raises a simple question: how much weight do you put on cash flow models versus earnings multiples?
Look into how the SWS DCF model arrives at its fair value.
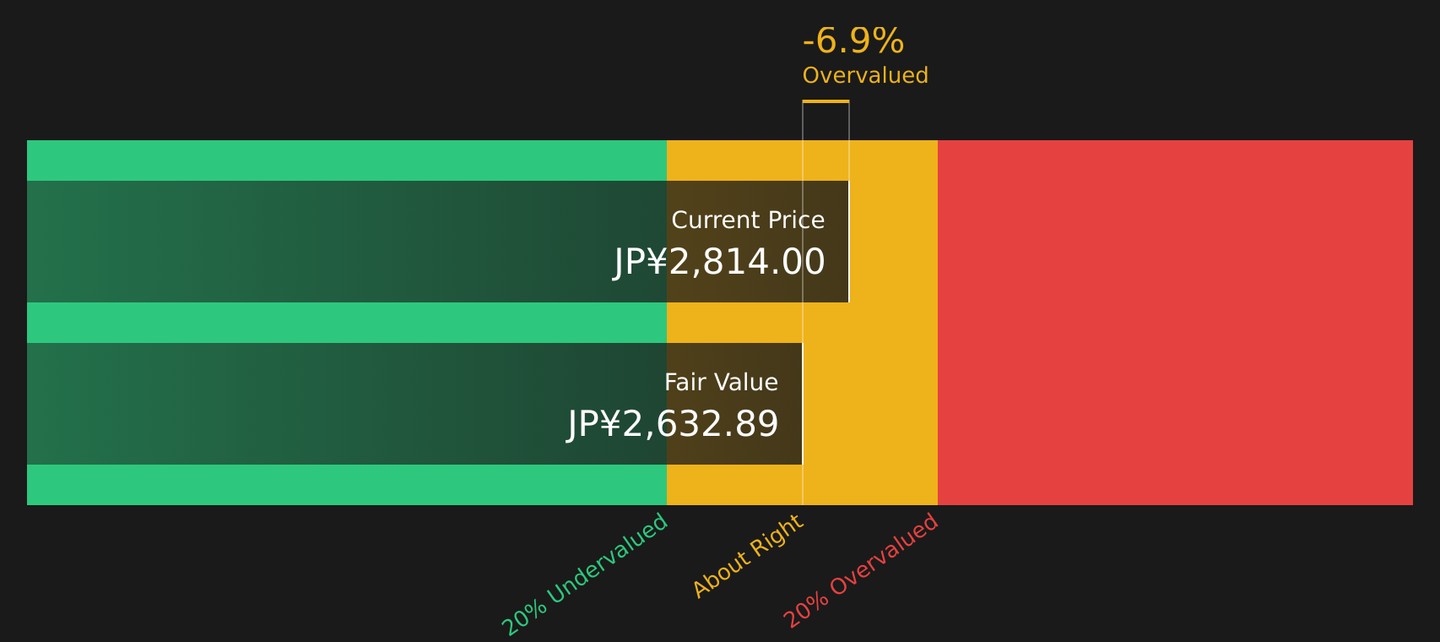
Simply Wall St performs a discounted cash flow (DCF) on every stock in the world every day (check out Kubota for example). We show the entire calculation in full. You can track the result in your watchlist or portfolio and be alerted when this changes, or use our stock screener to discover 15 high quality undervalued stocks. If you save a screener we even alert you when new companies match - so you never miss a potential opportunity.
Next Steps
With mixed signals on value and expectations, the real question is how this balance of risks and rewards fits your own approach. Move quickly through the data, weigh both sides of the story, and let the 5 key rewards and 2 important warning signs guide your next steps.
Looking for more investment ideas?
If Kubota has sharpened your focus, do not stop here, some of the most interesting opportunities often show up where few investors are currently looking.
- Target potential upside with screener containing 54 high quality undiscovered gems, and see which under-followed stocks still show solid fundamentals.
- Prioritise resilience by scanning 53 resilient stocks with low risk scores for companies that combine stability with lower risk scores.
- Zero in on financial strength using the solid balance sheet and fundamentals stocks screener (37 results), so you are not caught off guard by weak balance sheets later.
This article by Simply Wall St is general in nature. We provide commentary based on historical data and analyst forecasts only using an unbiased methodology and our articles are not intended to be financial advice. It does not constitute a recommendation to buy or sell any stock, and does not take account of your objectives, or your financial situation. We aim to bring you long-term focused analysis driven by fundamental data. Note that our analysis may not factor in the latest price-sensitive company announcements or qualitative material. Simply Wall St has no position in any stocks mentioned.
Valuation is complex, but we're here to simplify it.
Discover if Kubota might be undervalued or overvalued with our detailed analysis, featuring fair value estimates, potential risks, dividends, insider trades, and its financial condition.
Access Free Analysis