
SMC (TSE:6273) Stock Valuation Weighed After Recent Share Price Swings
 I'm LongbridgeAI, I can summarize articles.
SMC (TSE:6273) stock valuation faces scrutiny following recent price volatility, with a 17.6% monthly decline contrasting a 27.1% annual gain. Analysis presents mixed signals: the P/E ratio of 24.7x suggests good value against peers but appears expensive relative to the broader Japan machinery sector and DCF models. While the P/E is near fair estimates, discounted cash flow analysis indicates the stock is overvalued, prompting investors to weigh risks in key end markets like autos and semiconductors.
Recent share performance and context
SMC (TSE:6273) has drawn attention after recent price swings, with the stock up 5.8% on the day, roughly flat over the past week, but down 17.6% over the past month.
See our latest analysis for SMC.
The recent 1 month share price return, down 17.6%, contrasts with a 1 year total shareholder return of 27.1%. This suggests that momentum has cooled after a stronger run for longer term holders.
If you are comparing SMC with other industrial automation and machinery stocks, this is a good moment to scan the market using our robotics and automation ideas via the 33 robotics and automation stocks.
So with a 1 year total return of 27.1% but a 1 month decline of 17.6%, is SMC now trading below what its recent results and outlook might justify, or is the stock already reflecting expectations for future growth?
Price-to-earnings of 24.7x: Is it justified?
On a preferred multiple basis, SMC trades on a P/E of 24.7x, which sits below its peer group average but above the wider Japan machinery sector.
The P/E ratio compares the current share price to earnings per share, so it reflects how much investors are paying for each unit of current earnings. For a business focused on automatic control equipment with global reach across sectors like autos, semiconductors, and factory automation, earnings based measures are a common yardstick for comparing valuation.
Relative to its own peer set, SMC is described as good value, with a P/E of 24.7x compared with a peer average of 29.2x. That suggests the current price does not fully match up to what similar companies trade on. Against the broader Japan machinery industry though, where the average P/E is 14.1x, SMC is described as expensive, which points to the market assigning a premium for its earnings profile. Compared with an estimated fair P/E of 25.5x, the current multiple is also close to the level the market could shift towards over time if that reference holds.
Explore the SWS fair ratio for SMC
Result: Price-to-earnings of 24.7x (ABOUT RIGHT)
However, you also need to weigh risks such as any slowdown in key end markets like autos or semiconductors, as well as shifts in global capital spending patterns.
Wall Street's queuing for one rocket. While SpaceX counts down to its IPO, other companies tied to the new space race are already in orbit. → 20 Compelling Space Companies watchlist · Global Space Race Investing Ideas screener · Scan the sector by valuation on Rocket Lab's valuation page.
Another view: DCF paints a sharper contrast
While the current P/E of 24.7x looks close to the fair ratio of 25.5x, the SWS DCF model tells a very different story. With SMC at ¥65,510 versus an estimated future cash flow value of ¥24,825.43, the stock screens as expensive when viewed through this cash flow lens. Which signal matters more for you?
Look into how the SWS DCF model arrives at its fair value.
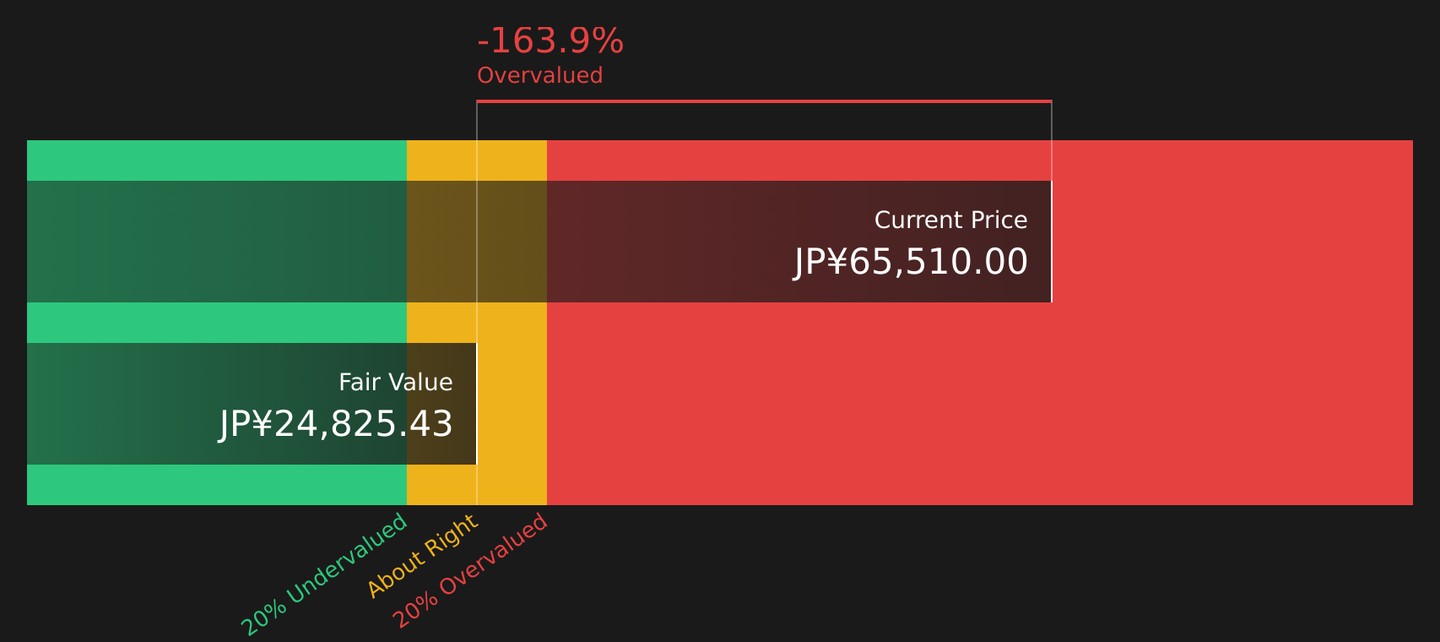
Simply Wall St performs a discounted cash flow (DCF) on every stock in the world every day (check out SMC for example). We show the entire calculation in full. You can track the result in your watchlist or portfolio and be alerted when this changes, or use our stock screener to discover 16 high quality undervalued stocks. If you save a screener we even alert you when new companies match - so you never miss a potential opportunity.
Next Steps
Given the mixed signals in this article, it makes sense to pressure test the data yourself and decide how the trade off between upside and risk feels to you. To weigh both sides properly, take a closer look at the 1 key reward and 1 important warning sign.
Looking for more investment ideas?
If you stop with just one stock, you risk missing opportunities that better match your goals, so widen your search and let the data work for you.
- Target potential mispricing by scanning companies that combine quality fundamentals with attractive valuations using the 16 high quality undervalued stocks.
- Strengthen your income focus by reviewing higher yielding opportunities screened as 51 dividend fortresses.
- Prioritise resilience by assessing companies flagged as 50 resilient stocks with low risk scores.
This article by Simply Wall St is general in nature. We provide commentary based on historical data and analyst forecasts only using an unbiased methodology and our articles are not intended to be financial advice. It does not constitute a recommendation to buy or sell any stock, and does not take account of your objectives, or your financial situation. We aim to bring you long-term focused analysis driven by fundamental data. Note that our analysis may not factor in the latest price-sensitive company announcements or qualitative material. Simply Wall St has no position in any stocks mentioned.
New: Manage All Your Stock Portfolios in One Place
We've created the ultimate portfolio companion for stock investors, and it's free.
• Connect an unlimited number of Portfolios and see your total in one currency
• Be alerted to new Warning Signs or Risks via email or mobile
• Track the Fair Value of your stocks
Try a Demo Portfolio for Free