
How to Identify the Bubble Peak of the AI Cycle?
 Complete. Here is the key summary
GF Securities' strategy team released a report stating that identifying the bubble peak of the AI Industry Life Cycle should not rely on valuations or monetary conditions, but rather return to the industry's earnings cycle. The report proposes two key empirical thresholds: an earnings growth rate falling below 30% or a decline in growth rate exceeding 50%, either of which signals a step-down in market returns. The current AI boom cycle is still ongoing, but internal differentiation will intensify
Amid growing controversy in the technology growth sector, a key question faces investors: Where does the current AI Industry Life Cycle stand, and how can we judge the arrival of a bubble peak? GF Securities' strategy team provides the answer: Neither valuations nor monetary environments are effective signals for market tops; the true basis for judgment must return to the industry's own earnings cycle.
In a report released on July 26, GF Securities strategy analysts Liu Chenming, Zheng Kai, and others pointed out that there are two key empirical thresholds for identifying turning points in prosperity: earnings growth falling below 30%, or the rate of growth decline exceeding 50%. Once these "red lines" are touched, historical data shows that market returns will experience a significant step-down.
Regarding the current AI sector, the team's judgment is that global penetration rates remain low and tech giants continue to expand their CAPEX, meaning the AI Industry Life Cycle is still in progress. However, divergence in prosperity across different segments within the industry will become increasingly pronounced.
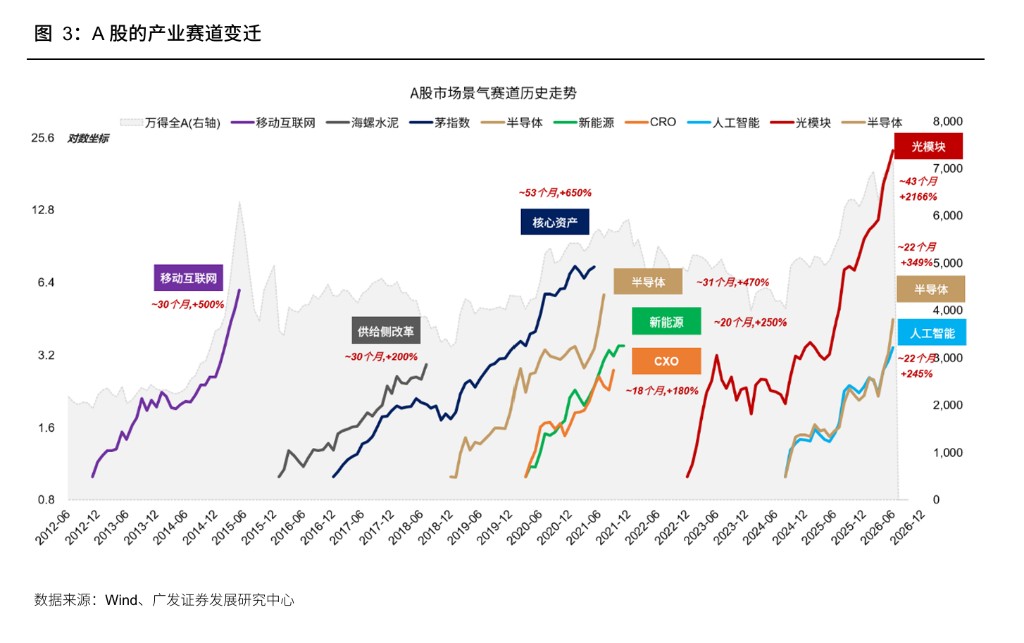
The release of these conclusions coincides with a significant widening of divergence in the A-share technology growth sector. The second-quarter reports of public mutual funds show that the allocation ratio for the electronics industry has risen to 43.7%, setting a new historical record and sparking widespread market discussion on "industry cycle bubbles" and "style rebalancing." GF Securities' analysis provides investors with a framework of trackable indicators based on historical statistical patterns.
Valuation and Monetary Environment: Two "Ineffective" Top Signals
GF Securities' team first dismissed two common methods for judging market tops.
Regarding valuation, PE levels at market peaks for different sectors have historically ranged from dozens to hundreds of times, showing vast differences and making them difficult to use as a unified reference. More importantly, valuation peaks usually appear earlier than stock price peaks, with exceptions such as the 2015 A-share liquidity crisis.
Regarding the monetary environment, since the 1990s, capital markets have mostly continued to rise during multiple Federal Reserve hiking cycles, with 2022 being a notable exception. Tightening liquidity eventually transmits to corporate earnings, but there is a significant lag—the peak of the Dotcom Bubble in 2000 was about 1 year after the first rate hike, while the peaks in 2007 and 2018 were about 3 years after the first rate hike.
Therefore, the core conclusion of the report is: To judge the bubble peak of an industry cycle, one must return to the industry's own earnings cycle, rather than relying on valuation levels or external monetary conditions.
30% and -50%: Two "Red Lines" for Prosperity Turning Points
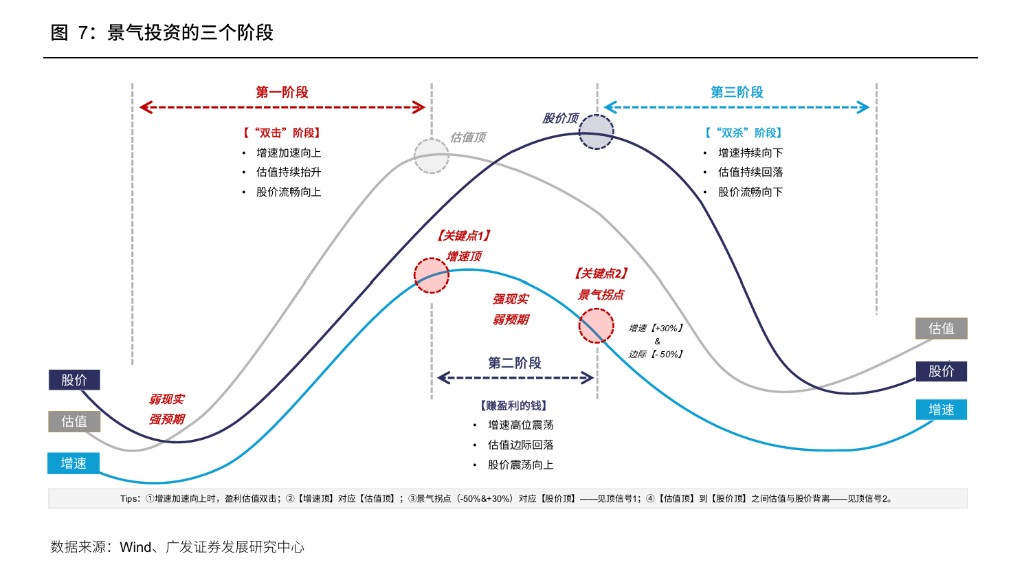
GF Securities distinguishes marginal changes in prosperity into two levels: first, a turning point in the speed of growth acceleration (growth inflection point), which is easier to identify; second, a turning point in the upward prosperity cycle (prosperity inflection point), which corresponds to the true top region for stock prices.
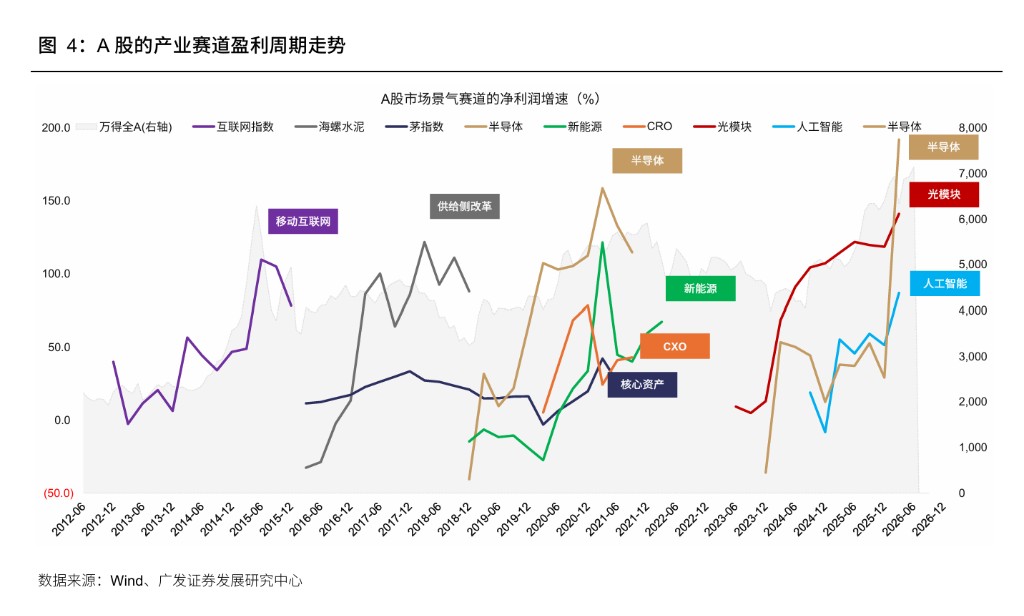
The emergence of a prosperity inflection point corresponds to two scenarios: earnings growth drops below 30%, or the rate of growth decline exceeds 50%—at which point the compression in PE will outweigh the contribution from EPS growth, putting pressure on stock prices.
These two thresholds are not subjective but derive from large-sample statistical back-testing of A-shares from 2005 to the present.
The significance of the 30% growth rate is reflected in multiple dimensions: For stocks whose annual gains rank in the top 10% of the market, the median growth rate of net profit deducting non-recurring items averaged about 30% from 2010 to 2026; 30% is also the watershed between value investing and prosperity investing—when growth exceeds 30%, the theoretical valuation level corresponding to the DCF pricing model is extremely high, valuation constraints basically fail, and the market prices primarily based on prosperity; once growth falls below 30%, valuation levels once again become a key factor influencing expected returns.
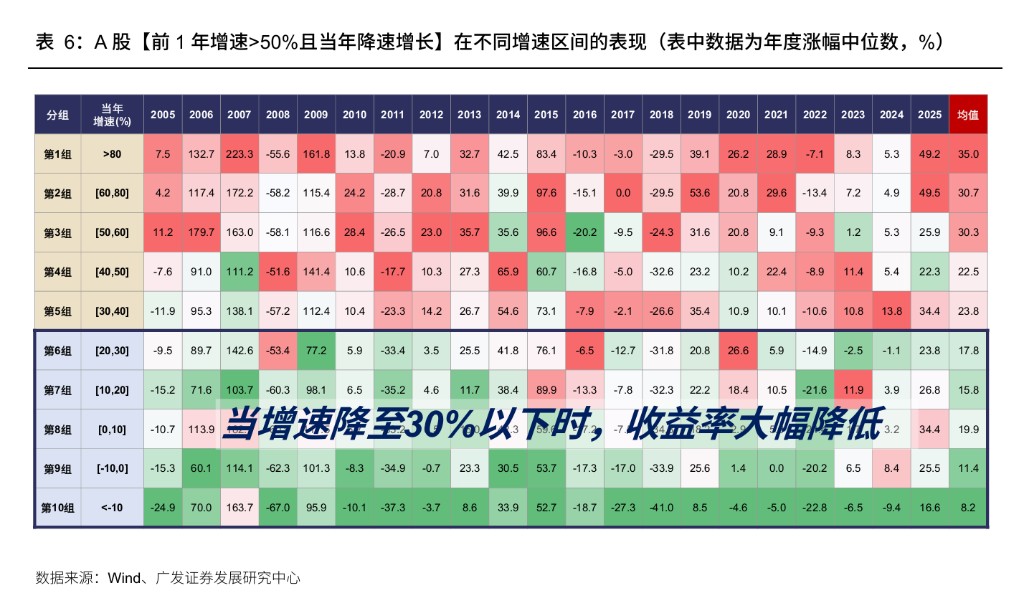
The significance of the -50% growth decline is equally clear: Statistical grouping of stocks with previous year's growth over 50% that are currently decelerating shows that those with a growth decline of less than 50% can still maintain good performance, while those with a decline exceeding 50% see significantly lower returns. Notably, the higher the base of previous growth (e.g., over 100%), the higher the market's tolerance for deceleration, and the above threshold can be appropriately relaxed to 60%.
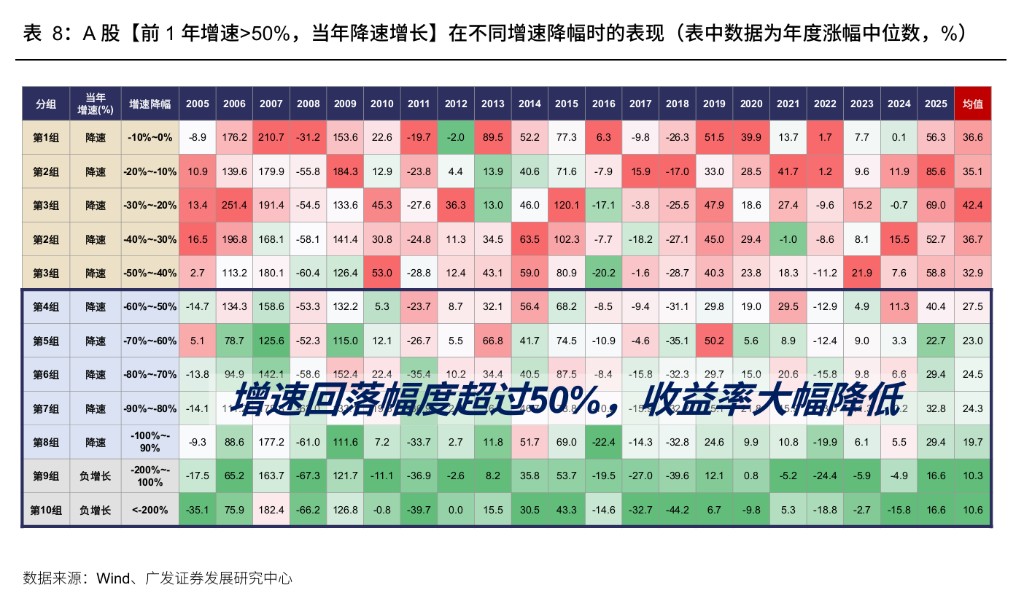
Four Types of Sectors: Different Logics for Identifying Top Signals
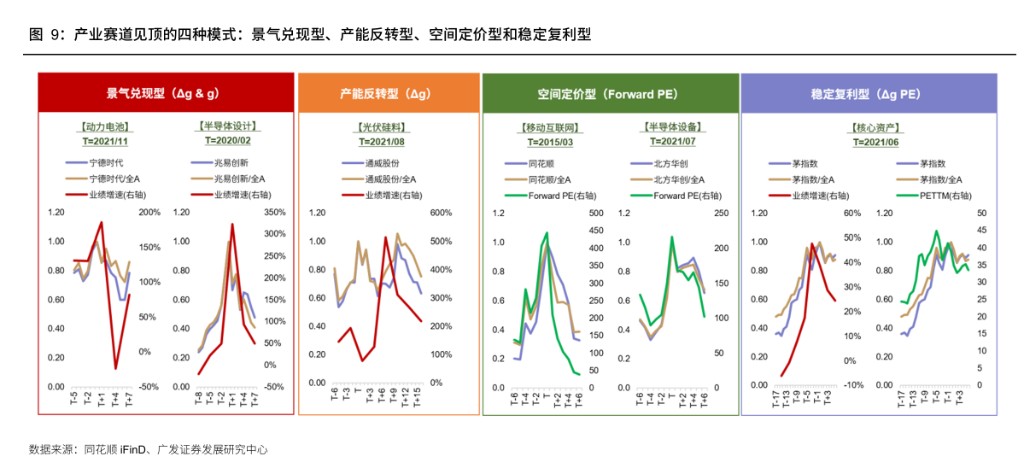
GF Securities points out that 30% and -50% are probabilistic rules in a statistical sense. Judging the peak for specific sectors requires combining the dominant pricing models of each segment. The report categorizes historical prosperous sectors into four types.
Prosperity Realization Type takes the shift from strong to weak earnings momentum as the core signal, focusing on tracking g (earnings growth rate) and Δg (rate of change in growth). Typical cases include power batteries from 2020 to 2022 and semiconductor design from 2019 to 2020—CATL's forward valuation peaked before its stock price, with earnings growth halving closely following the stock price top; GigaDevice exhibited characteristics where earnings growth halved, and the stock price top and valuation top were basically synchronized.
Capacity Reversal Type also focuses on Δg, but high supply elasticity means earnings may present a double-top structure. Taking Tongwei Shares as an example, the first significant drop in growth led to a valuation top, but earnings subsequently accelerated again, sending the stock price back up; only when the second decline in growth persisted did the trend turn into a clear correction. For such sectors, a single trigger of halving growth does not necessarily mean the end of the rally.
Space Pricing Type sees its top signal in the cessation of upward revisions to long-term expectations. Current earnings in these sectors are insufficient to reflect long-term value; the market mainly trades on user growth, order space, and long-term earnings, with stock price tops synchronizing with Forward PE highs. Mobile internet and semiconductor equipment are typical cases—stock price tops for Naura Technology and Hithink RoyalFlush synchronized with forward valuation tops, while the decline in current earnings growth lagged significantly behind.
Stable Compounding Type peaks usually accompany a simultaneous slowdown in earnings growth expectations and valuation contraction, requiring comprehensive judgment rather than reliance on a single indicator. Taking the 2021 "Mao Index" as an example, both the valuation top and the growth deceleration slightly preceded the stock price top.
US Stock Review: Rate Hikes Are Not Scary, But Prosperity Inflection Rules Still Apply
By systematically reviewing four historical cases in the US stock market, GF Securities verified the cross-market applicability of the above rules and distilled three conclusions.
The 1980 US Energy Bubble was a typical case of prosperity investing: EPS growth peaks for companies like ExxonMobil and Chevron led stock price tops by about 2 to 3 quarters. Stock prices continued to rise during the period of high growth oscillation, and the rally only ended after growth rapidly declined (falling below 30% or halving).

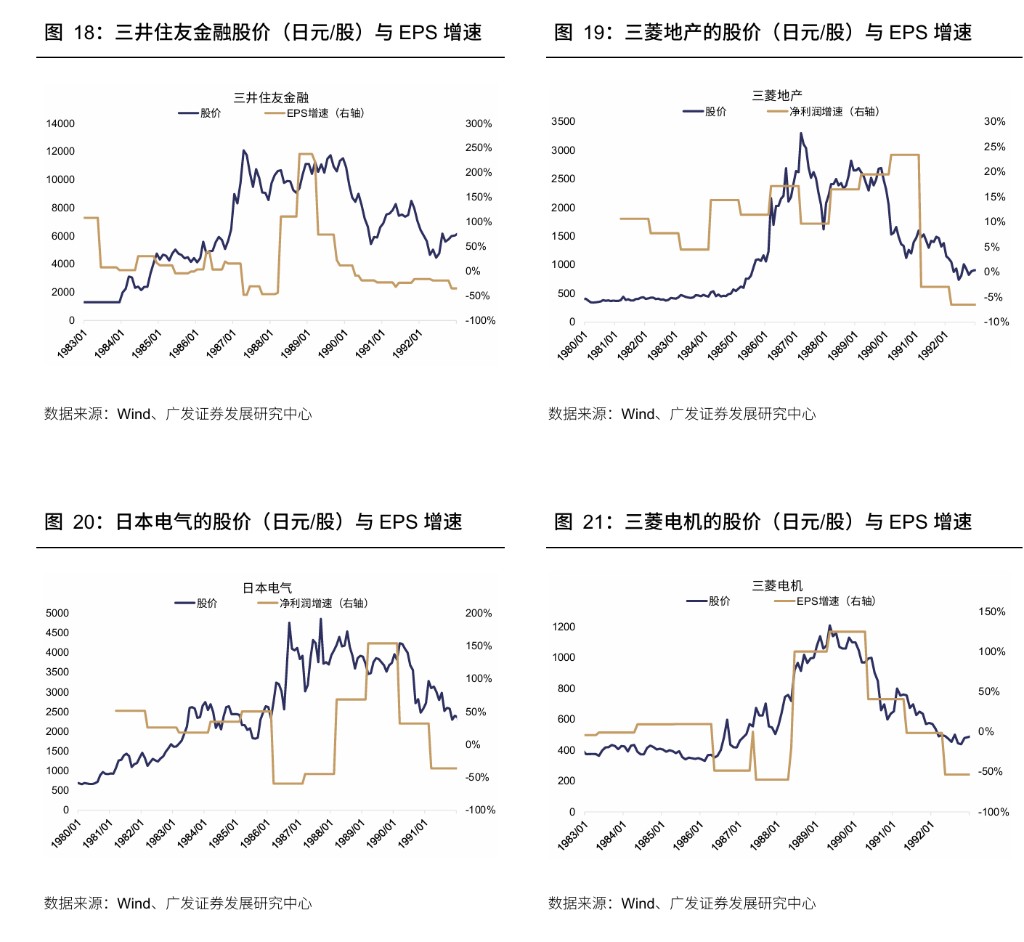
The 1989 Japanese Real Estate and Semiconductor Bubble presented another form: Sharp policy U-turns (continuous rate hikes, loan restrictions, land value tax, etc.) combined with external shocks caused stock price highs and earnings highs for listed companies like Sumitomo Mitsui Financial Group and Mitsubishi Estate to appear basically simultaneously. This is similar to the situations in A-shares in 2015 and South Korea in 2026—exogenous shocks may cause stock price tops to appear earlier than or simultaneously with growth tops.
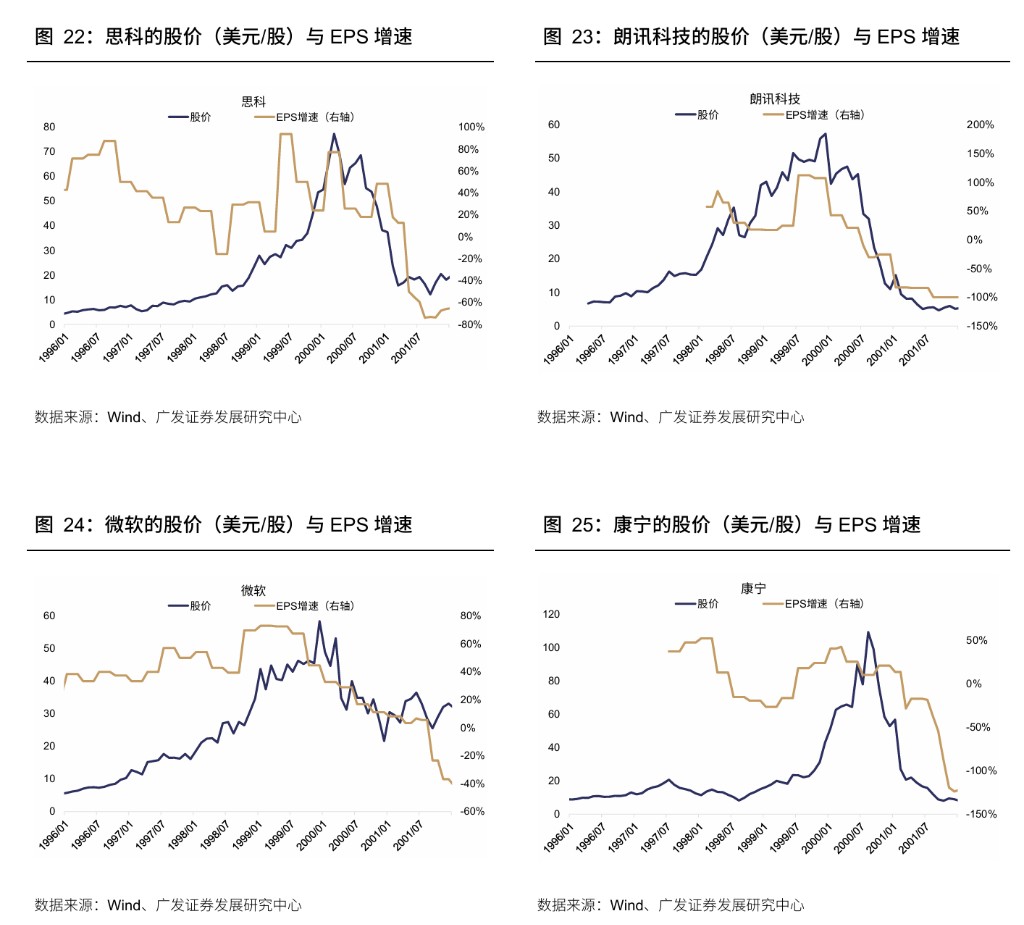
The common features of the 2000 Dotcom Bubble and the 2008 Subprime Mortgage Crisis were: Stock prices of companies like Cisco, Lucent, and Microsoft continued to rise during periods of high earnings growth oscillation, and continuous rate hikes eventually burst the bubble; earnings growth for companies like Bank of America and PROLOGIS REIT also peaked before stock prices, but continuous monetary tightening was the true terminator.
The report concludes that rate hikes themselves are not scary, but caution is needed in the middle to late stages of hiking cycles. The reason is that one of the common factors in every bubble burst is that continuous rate hikes ultimately lead to a turnaround in the macro environment and corporate earnings.
Statistical rules for prosperity inflection points also exist in the US stock market: Returns drop significantly when growth falls below 30%, but this rule has weakened since 2010—possibly due to abundant macro and market liquidity in recent years, as well as share buybacks by listed companies smoothing out some volatility.
Current AI Sector: Prosperity Is Ongoing, But Differentiation Will Intensify
Returning to the core question of the current market: Where does the AI sector stand?
GF Securities' judgment is that the AI Industry Life Cycle is still in progress. According to a Microsoft report, the global AI penetration rate in the first quarter of 2026 was 17.8%, with 31% in the US, 31% in Germany, and 16% in China. Referring to the development laws of the PC and internet industries, penetration rates need to reach 40% to 50% to potentially trigger a prolonged stagnation in stock prices. Current overall penetration remains significantly low—especially regarding formal deployment into production environments. Meanwhile, CAPEX expansion by tech giants continues.
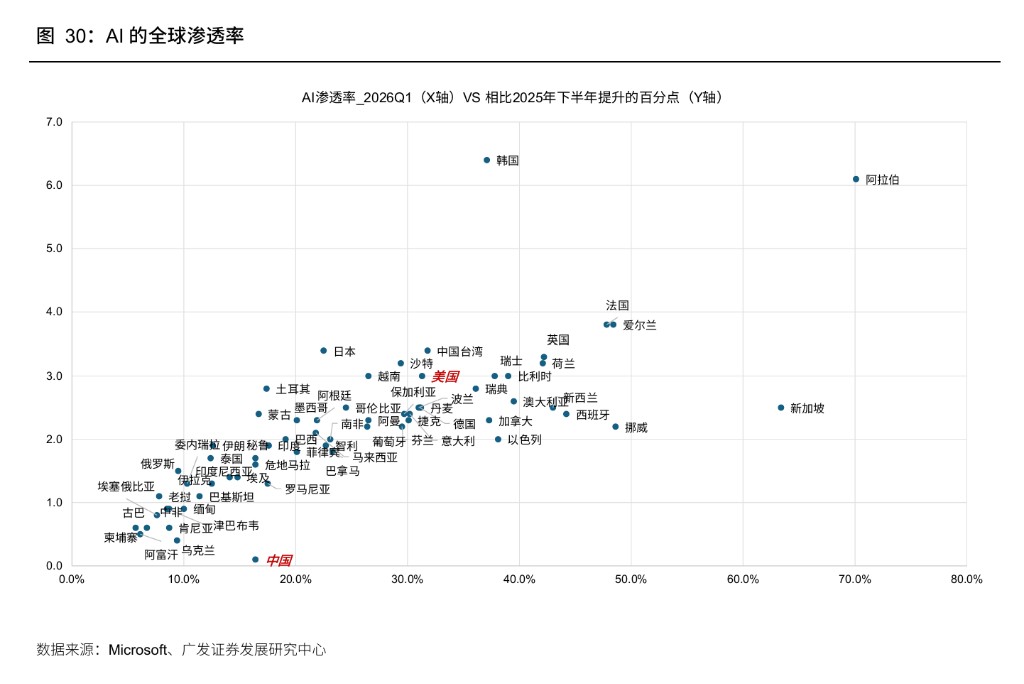
The team further pointed out that even if core AI assets experience a marginal slowdown in the second derivative of earnings growth (corresponding to a phased high in apparent valuation), it does not mean the emergence of a prosperity inflection point. Industry strength and penetration rates will continue to support EPS and stock prices.
This means that the required granularity for researching the AI sector is increasing. Broad-brush sector judgments will gradually give way to refined tracking of prosperity in each segment.
Risk Warning and Disclaimer
The market carries risks; investment requires caution. This article does not constitute personal investment advice, nor does it consider the specific investment goals, financial status, or needs of individual users. Users should consider whether any opinions, views, or conclusions in this article align with their specific circumstances. Investors bear full responsibility for decisions made based on this content.