
 I'm LongbridgeAI, I can summarize articles.
Global macroeconomic conditions are deteriorating as markets shift from maintaining high rates to repricing hike risks, driven by rising US inflation and energy prices. The Fed rate hike probability is near certainty, with ECB also raising rates. Bond yields surged, tightening financial conditions via higher discount rates rather than liquidity shortages. Bitcoin consolidated at high levels amid ETF outflows and derivatives deleveraging, reflecting a cooling market focused on risk repricing without capitulation.
Last week, the global macroeconomic and financial environment shifted further from "maintaining high interest rates" to "repricing the risk of interest rate hikes." The situation in the Strait of Hormuz deteriorated further, and rising US inflation data and energy prices reinforced market concerns about double-dip inflation. This week, the probability of a Fed rate hike is almost a certainty, and US Treasury yields have risen rapidly. Financial conditions have therefore tightened further, manifested in a further rise in risk-free interest rates and asset discount rates. After a violent rebound in August, BTC continued to consolidate at high levels, experiencing a mild pullback last week and retesting and validating support at key on-chain cost levels. Meanwhile, ETF funds turned to net outflows, stablecoin growth slowed, and derivatives continued to deleverage. Overall, the current market is closer to a risk repricing phase driven by rising macro discount rates, insufficient incremental demand, and internal deleveraging; the overall market is cooling down, but a capitulation sell-off has not yet occurred. Last week's economic data showed that the US CPI rose 0.4% month-on-month and 3.4% year-on-year in August, with the year-on-year growth rate remaining unchanged from July; core CPI rose 0.3% month-on-month, and the year-on-year growth rate fell from 2.5% to 2.4%. Looking at the year-on-year data, core inflation continued its slow decline, but the 0.3% month-on-month growth rate was still higher than expected, failing to meet the condition of "significantly declining inflation data" emphasized by Federal Reserve Chairman Warsh for not raising interest rates. In addition, the energy CPI rose 2.1% month-on-month in August, and gasoline prices rose 3.9% month-on-month, with energy prices once again becoming one of the main drivers of rising inflation. The pressure on the production side is more pronounced. In August, the PPI final demand index rose 0.4% month-on-month, and further increased to 5.4% year-on-year from 4.8% in July; excluding food, energy, and trade services, the PPI rose 0.3% month-on-month and reached 4.7% year-on-year. Among these, final demand energy prices rose 4.2% month-on-month, with diesel prices jumping 24.1% in a single month. This indicates that the current inflation risk not only comes from the direct impact of oil prices on the CPI, but may also gradually transmit to the prices of core goods and services along the transportation, manufacturing, and supply chains. Meanwhile, Brent crude oil closed at $104.61 per barrel on September 11, and WTI closed at $100.05 per barrel, both rising by more than 8% in a single week. The energy shock has thus become one of the most important second-order risk variables in the current macroeconomic environment. The job market also failed to provide clear signs of easing sufficient to offset inflation risks. August nonfarm payrolls increased by 162,000, significantly exceeding expectations, while the unemployment rate remained unchanged at 4.1%. Job growth slowed somewhat from previous periods, but was not enough to constitute a clear recession signal. In other words, the current policy balance is closer to "the economy remains resilient, but inflation faces renewed upside risks." Following the release of this data, FedWatch data showed the probability of a 25bp rate hike in September rose to approximately 85%–86%. The European Central Bank also raised its three policy rates by 25bp simultaneously on September 10th: the deposit facility rate rose to 2.50%, the main refinancing rate to 2.65%, and the marginal lending rate to 2.90%. While the ECB's rate hike was largely anticipated by the market, its policy action further confirmed that the energy shock is reinforcing inflation constraints for major central banks globally. The bond market reacted particularly directly to this change. From September 4th to September 11th, the 2-year Treasury yield rose from 4.37% to 4.63%, an increase of approximately 26 basis points (bp); the 10-year yield rose from 4.78% to 4.96%, an increase of approximately 18 bp. The 2s-10s yield spread narrowed from approximately +41 bp to approximately +33 bp. This week's yield curve flattened in a bear market, indicating that the market is first reassessing the recent path of the Federal Reserve's policy. The 20-year and 30-year yields reached approximately 5.38% and 5.35% respectively on September 11th, indicating that the absolute discount rate remains at an extremely high level. "Tightening financial conditions" is not equivalent to "a shortage of dollar liquidity." Fed Net Liquidity was approximately $5.92 trillion, expanding slightly by about 1.19% week-over-week; the SOFR also remained around 3.6%, indicating no out-of-control pressure in the money market. The US dollar index also failed to strengthen significantly this week, instead weakening for the second consecutive week. Therefore, the macroeconomic pressure this week mainly stemmed from a rapid rise in funding costs—namely, the risk-free rate and the asset discount rate—rather than a precipitous contraction in the amount of funds. The equity market also quickly priced in this logic. For the week, the S&P 500 fell 0.8%, the Nasdaq fell 0.7%, and the Dow Jones fell 1.6%.
Crypto Market
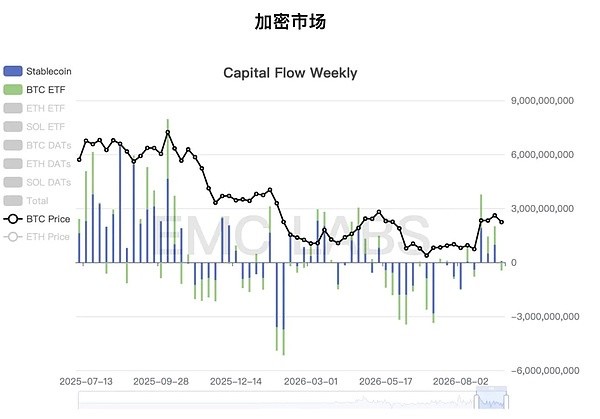
BTC ETF and Stablecoin Inflow/Outflow Statistics (Weekly)
BTC's price structure last week was highly consistent with the macroeconomic environment.
BTC's price structure last week was highly consistent with the macroeconomic environment.
The price opened at approximately $79,832 on September 6th and closed at approximately $77,279 on September 12th, a weekly decline of about 3.2%. The weekly high was approximately $80,560 and the low was approximately $76,047, with a range of about 5.7%. The price faced the most significant pressure during the period of rapid increases in PPI, CPI, and US Treasury yields from September 10th to 11th, but found some support after falling to around $76,000. This trend indicates that macroeconomic shocks caused a repricing of risk, but the forces involved were relatively balanced and the situation was not out of control. Marginal fiat currency funding is the most obvious weakness. eMerge IS data shows that from September 8th to 11th, the US spot BTC ETF experienced net outflows for four consecutive trading days, totaling approximately $462.7 million. Compared to the large net inflows seen the previous week, traditional allocation-oriented funds have clearly shifted to a defensive stance after interest rate expectations turned hawkish again. Stablecoins haven't seen a large-scale exodus, but supply has leveled off, decreasing by approximately $106 million over the past 7 days. Centralized exchanges saw a net increase of approximately 6,904 BTC in their balances, while long-term supply decreased by approximately 7,168 BTC in a single week. The profit and loss structure remains in a phase of "significantly narrowed profit buffer, but not yet fully turned to loss." eMerge IS data shows that the overall market MVRV is approximately 1.45, long-term MVRV is approximately 1.56, and short-term MVRV is approximately 1.08, indicating the market hasn't yet undergone significant stress testing. The overall market still has unrealized profits, but short-term positions only have an average profit buffer of about 8%. If BTC falls further, they are most likely to be the first to enter a state of widespread unrealized losses, thus creating selling pressure. The derivatives market continues to act as an amplifier. eMerge IS data shows that open interest decreased by approximately $1.83 billion last week, a drop of about 2.72%. Long positions were liquidated by approximately $215 million during the week, funding rates fell back to near neutral levels, and derivatives trading activity declined simultaneously. Leverage exposure is decreasing, and funding rates have returned from a significant long premium to a more neutral structure. Based on data from multiple sources, we believe the current market exhibits weak marginal demand for spot goods, with long-term holders still in a net allocation phase. Derivatives leverage is being compressed, but disorderly capitulation has not yet occurred. Since late August, after BTC quickly broke through the short-term cost price, it has been pressured by the cost price of all active investors in the market and the May rebound high of $82,000. We define the August trend as a "rebound" driven by the US dollar and US Treasury credit trading, but its strength has approached a reversal. Therefore, there is a probability of a cyclical reversal in the market. This judgment is still in the verification stage. The deterioration of the macro-financial background this week provides a good observation window for this verification. So far, there has been no collapse. We still need to continue to observe the support at $76,000 and $72,000. If the latter is effectively broken, then the August rebound will be defined as a "rebound" rather than a "cyclical reversal".
Market Outlook
The core market assessment in the near term remains the definition of the August rebound: is it a rebound triggered by sovereign credit exchanges or a prelude to a cyclical reversal?
This week, global markets are entering a super week for central banks, with the Federal Reserve, the Bank of England, and the Bank of Japan announcing their September interest rate decisions. Although the market has already priced in some of these decisions, volatility is bound to increase. Furthermore, any guidance from these central banks could trigger a market rebound after the uncertainty is resolved. For the crypto market, the voting results of the CLARITY Act on September 15th (Eastern Time) also warrant attention.
Within the market, the key focus is on the testing of the support levels at $76,000 and $72,000, and the market's reaction when both long and short positions encounter resistance.