

Assessing Hulic (TSE:3003) Valuation After Record Profits Higher Guidance And Dividend Outlook
 I'm LongbridgeAI, I can summarize articles.
Hulic (TSE:3003) reports record profits and raised FY2024 guidance, yet its stock has cooled recently. Analysis suggests the company is undervalued, trading at a P/E of 11x against a fair value of 15.2x. A DCF model estimates intrinsic value at ¥8,604 per share, implying an 80.5% discount to the current price of ¥1,677. While earnings have grown consistently, risks include potential reversals in Japan's property cycle or weaker-than-expected cash generation.
Hulic (TSE:3003) has drawn fresh investor attention after reporting record-high profits and dividends, along with higher profit guidance and an increased FY2024 dividend outlook, which has put its real estate and hotel operations in sharper focus.
See our latest analysis for Hulic.
That backdrop of record FY2024 guidance comes after a mixed year in the market, with the stock down around 7% on a 1 month share price basis and about 15% lower over 3 months, yet delivering a 1 year total shareholder return of roughly 20% and a 5 year total shareholder return of about 58%. This suggests recent momentum has cooled after a stronger long term run.
If Hulic’s real estate and hotel focus has you thinking about where else capital might work hard, this is a good moment to scan 12 top founder-led companies
With record profits, higher FY2024 guidance and a stock that has cooled in recent months, is Hulic trading at an attractive valuation, or is the market already pricing in much of its future growth?
Preferred P/E of 11x: Is it justified?
At a last close of ¥1,677, Hulic is trading on a P/E of 11x, which screens as good value versus its estimated fair P/E of 15.2x, even though it sits slightly above the JP Real Estate industry average of 10.8x.
The P/E multiple reflects how much investors are paying for each unit of Hulic’s earnings and is a common yardstick for property and asset heavy companies where profits and cash flow matter more than rapid top line expansion. With earnings reported to have grown by about 11% over the past year and by around 10.9% per year over the past five years, the current P/E indicates the market is not placing an aggressive premium on that profit track record.
Against peers, Hulic looks expensive relative to the JP Real Estate industry average P/E of 10.8x. However, it screens as good value compared to a peer average P/E of 20.1x and the estimated fair P/E of 15.2x. That mix suggests investors are paying a small premium to the domestic real estate group, but at a level that could still be seen as restrained compared with a broader peer set. The fair ratio also implies the market could move closer to that higher multiple over time if conditions support it.
Explore the SWS fair ratio for Hulic
Result: Price-to-Earnings of 11x (UNDERVALUED)
On top of the multiples view, the SWS DCF model points to a very different picture, with an estimated future cash flow value of ¥8,604.08 per share versus the current ¥1,677 price, implying Hulic is trading about 80.5% below that DCF fair value estimate.
The DCF model projects Hulic’s future cash flows and discounts them back to today using an appropriate rate, so the output is highly sensitive to assumptions around future earnings growth, margins and required returns. For a mature real estate and hotel focused group that has reported consistent earnings growth but only mid single digit forecast revenue and profit growth rates, that gap between price and model value highlights how differently cash flow based models and the market can sometimes view the same company.
Look into how the SWS DCF model arrives at its fair value.
However, you also need to weigh risks such as a reversal in Japan’s property cycle or weaker cash generation than the valuation models currently imply.
Wall Street's queuing for one rocket. While SpaceX counts down to its IPO, other companies tied to the new space race are already in orbit. → 20 Compelling Space Companies watchlist · Global Space Race Investing Ideas screener · Scan the sector by valuation on Rocket Lab's valuation page.
Another View: What If The Market Is Right?
While the current P/E of 11x points to Hulic looking cheap against a fair ratio of 15.2x, the SWS DCF model is far more optimistic, with an estimated future cash flow value of ¥8,604.08 per share. That is a very large gap for you to weigh, especially if future cash flows fall short of the model.
Look into how the SWS DCF model arrives at its fair value.
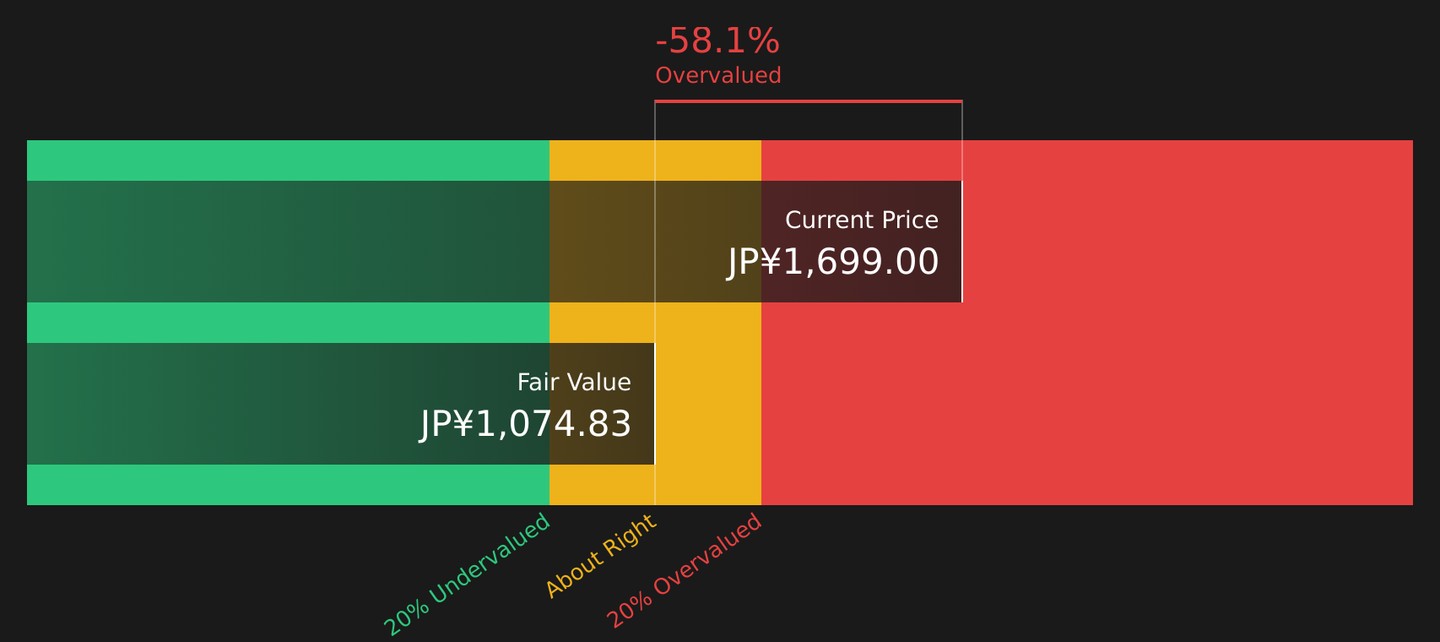
Simply Wall St performs a discounted cash flow (DCF) on every stock in the world every day (check out Hulic for example). We show the entire calculation in full. You can track the result in your watchlist or portfolio and be alerted when this changes, or use our stock screener to discover 16 high quality undervalued stocks. If you save a screener we even alert you when new companies match - so you never miss a potential opportunity.
Next Steps
If all this leaves you torn between optimism and caution, treat it as a prompt to act promptly and review the data yourself using our breakdown of 3 key rewards and 2 important warning signs
Looking for more investment ideas?
If Hulic has sharpened your interest, now is the time to widen your net and let data rich screeners highlight opportunities you might otherwise miss.
- Target resilient income potential by scanning 51 dividend fortresses that pair higher yields with balance sheet support and clear payout histories.
- Hunt for quality at a reasonable price by reviewing 16 high quality undervalued stocks that combine solid fundamentals with pricing that still looks restrained.
- Prioritize capital preservation by focusing on 53 resilient stocks with low risk scores designed to keep risk scores in check while still offering room for returns.
This article by Simply Wall St is general in nature. We provide commentary based on historical data and analyst forecasts only using an unbiased methodology and our articles are not intended to be financial advice. It does not constitute a recommendation to buy or sell any stock, and does not take account of your objectives, or your financial situation. We aim to bring you long-term focused analysis driven by fundamental data. Note that our analysis may not factor in the latest price-sensitive company announcements or qualitative material. Simply Wall St has no position in any stocks mentioned.
Valuation is complex, but we're here to simplify it.
Discover if Hulic might be undervalued or overvalued with our detailed analysis, featuring fair value estimates, potential risks, dividends, insider trades, and its financial condition.
Access Free Analysis