

Assessing Internet Initiative Japan (TSE:3774) Valuation After Launch Of New Internal Security Assessment Service
 I'm LongbridgeAI, I can summarize articles.
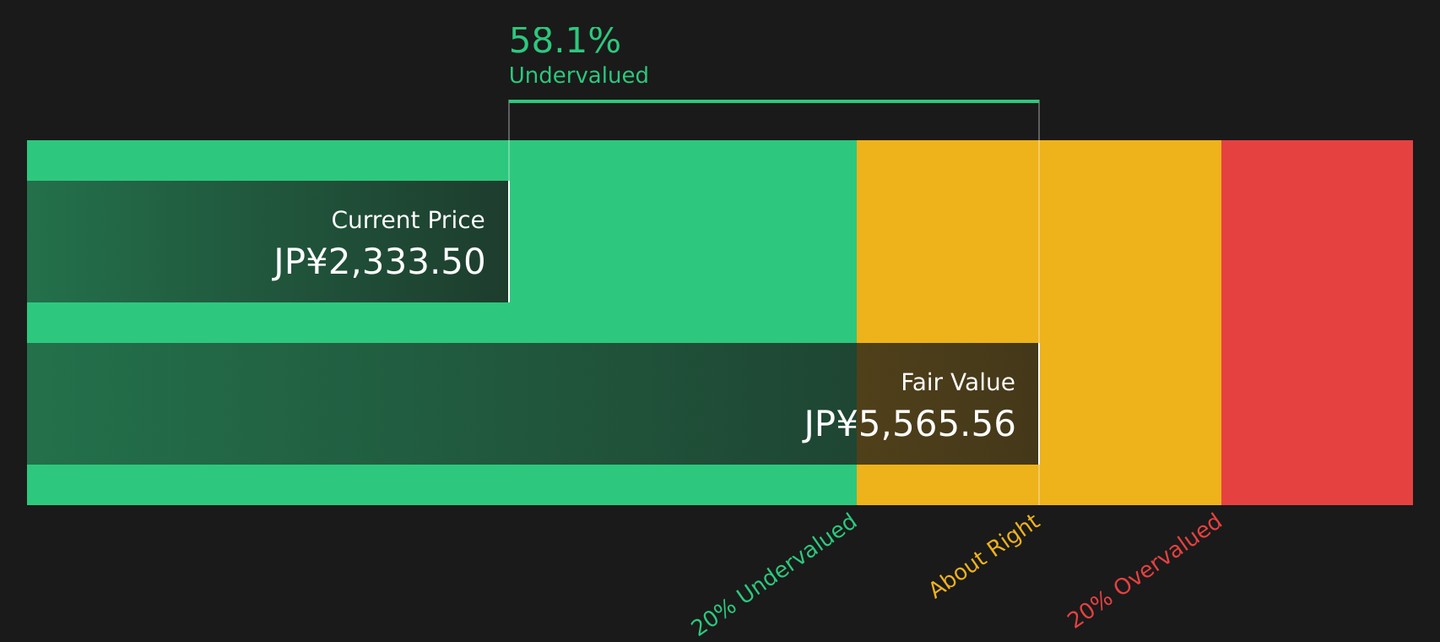
Internet Initiative Japan (TSE:3774) has launched a new Internal Vulnerability Assessment service, enhancing security visibility for clients. The company's share price is currently ¥2,333.5, with a recent 7-day return of 3.55%. Despite a 90-day decline of 17.30%, the 5-year return is 100.33%. The stock's P/E ratio of 18.5x is above industry averages, suggesting it may be overvalued. However, a DCF analysis indicates a fair value of ¥5,565.56, implying a 58.1% discount. Investors are advised to weigh these contrasting signals carefully.
Internet Initiative Japan (TSE:3774) has introduced a new Internal Vulnerability Assessment service within its Safous Security Assessment offering, giving customers broader visibility into security risks across internal networks and distributed sites.
See our latest analysis for Internet Initiative Japan.
The new security service arrives as Internet Initiative Japan’s share price trades at ¥2,333.5, with a 7 day share price return of 3.55% and a 30 day share price return of 4.97%. This contrasts with a 90 day share price return decline of 17.30% and a 1 year total shareholder return decline of 6.82%, indicating that recent short term momentum has picked up after a weaker patch. The 5 year total shareholder return of 100.33% shows that longer term holders have still seen strong gains.
If this security update has you thinking about where digital infrastructure is headed next, it could be a good time to scan our list of 35 AI infrastructure stocks as potential additions to your watchlist.
With revenue and net income both growing at mid to high single digit rates and the share price trading at a reported intrinsic discount, is Internet Initiative Japan quietly undervalued or already reflecting its future growth?
Price to Earnings of 18.5x: Is it justified?
Internet Initiative Japan is trading on a P/E of 18.5x, which sits above several comparison points and suggests investors are paying a premium for each ¥ of current earnings at the last close of ¥2,333.5.
The P/E ratio compares the share price with earnings per share and is a common way to see how the market prices a company's profit stream. For a telecom and internet services provider like Internet Initiative Japan, this matters because earnings quality, consistency and expected growth often drive how much investors are willing to pay.
Here, that 18.5x multiple is described as expensive relative to both the Asian Telecom industry average of 16.5x and a peer average of 13.1x. It is also above an estimated fair P/E of 16.1x that our models suggest the market could gravitate toward over time. That combination points to a valuation that assumes stronger earnings characteristics than those comparison groups, even though earnings growth forecasts sit below the 20% threshold that would typically mark very high growth.
Against industry and peer benchmarks, the current P/E stands out as clearly richer. Compared with the 16.5x industry level and the 13.1x peer average, Internet Initiative Japan's 18.5x means investors are currently paying materially more for each unit of earnings than they are for comparable telecom names, and also above the 16.1x fair P/E level implied by the SWS fair ratio work.
Explore the SWS fair ratio for Internet Initiative Japan
Result: Price-to-Earnings of 18.5x (OVERVALUED)
However, you also have to factor in risks, such as slower revenue or net income growth, or a shift in security demand that cools enthusiasm for the shares.
Find out about the key risks to this Internet Initiative Japan narrative.
Another View: DCF Points the Other Way
While the 18.5x P/E hints at a rich price, our DCF model tells a different story. It suggests a fair value of about ¥5,565.56 per share, compared with the current ¥2,333.5, which implies the shares are trading at roughly a 58.1% discount.
If one method flags the shares as expensive and another frames them as materially undervalued, which signal do you weigh more heavily? What factors might lead you to revise your view?
Look into how the SWS DCF model arrives at its fair value.
Simply Wall St performs a discounted cash flow (DCF) on every stock in the world every day (check out Internet Initiative Japan for example). We show the entire calculation in full. You can track the result in your watchlist or portfolio and be alerted when this changes, or use our stock screener to discover 22 high quality undervalued stocks. If you save a screener we even alert you when new companies match - so you never miss a potential opportunity.
Next Steps
If you are unsure which signal matters more here, take a closer look at the underlying numbers yourself. Decide quickly how you view the trade off, then check out our breakdown of the company's 4 key rewards.
Looking for more investment ideas?
If you want to keep building a stronger watchlist, now is the moment to look beyond a single name and see what else the market is offering.
- Spot potential mispricings early by scanning our list of 22 high quality undervalued stocks that may not yet be fully recognised by the wider market.
- Prioritise resilience with 48 resilient stocks with low risk scores that score well on risk metrics so you are not relying on just one company to manage portfolio volatility.
- Hunt for future standouts hiding in plain sight by reviewing our screener containing 59 high quality undiscovered gems before they land on everyone else's radar.
This article by Simply Wall St is general in nature. We provide commentary based on historical data and analyst forecasts only using an unbiased methodology and our articles are not intended to be financial advice. It does not constitute a recommendation to buy or sell any stock, and does not take account of your objectives, or your financial situation. We aim to bring you long-term focused analysis driven by fundamental data. Note that our analysis may not factor in the latest price-sensitive company announcements or qualitative material. Simply Wall St has no position in any stocks mentioned.
New: AI Stock Screener & Alerts
Our new AI Stock Screener scans the market every day to uncover opportunities.
• Dividend Powerhouses (3%+ Yield)
• Undervalued Small Caps with Insider Buying
• High growth Tech and AI Companies
Or build your own from over 50 metrics.
Explore Now for Free