

Assessing Mitsubishi Materials (TSE:5711) Valuation After Earnings Guidance And Dividend Increases
 I'm LongbridgeAI, I can summarize articles.
Mitsubishi Materials (TSE:5711) has gained attention following its earnings guidance for March 2027 and increased dividends. The stock price rose 4.07% to ¥5,243, with a year-to-date return of 42.09% and a total shareholder return of 138.24% over the past year. Currently trading at a P/E of 16.2x, above the industry average, analysts forecast earnings growth of 14.7% per year. However, a DCF analysis suggests the stock may be overvalued, indicating mixed signals for investors.
Why Mitsubishi Materials stock is back in focus
Mitsubishi Materials (TSE:5711) has drawn fresh attention after releasing full year results, providing new earnings guidance for the year to March 2027, and outlining higher dividend plans for shareholders.
See our latest analysis for Mitsubishi Materials.
The earnings and dividend announcements appear to have sharpened investor interest, with the share price at ¥5,243 after a 1-day share price return of 4.07% and year to date share price return of 42.09%. This is alongside a very large 1-year total shareholder return of 138.24% that points to strong positive momentum over a longer period.
If you are looking beyond Mitsubishi Materials and want more ideas linked to metals and electrification, this could be a useful moment to review 8 top copper producer stocks
With earnings guidance set out to March 2027 and higher dividends planned, the key question is whether Mitsubishi Materials shares still offer value after such strong recent gains or whether the market is already pricing in future growth.
Price-to-Earnings of 16.2x: Is it justified?
Mitsubishi Materials currently trades on a P/E of 16.2x, which sits above the JP Metals and Mining industry average of 12.3x but below the peer group average of 26.9x.
The P/E ratio compares the current share price with earnings per share, so it reflects how much investors are paying for each unit of profit. For a cyclical materials group with exposure to metals, advanced products, and recycling, this multiple helps you gauge what the market is willing to pay for current and forecast earnings across different business segments.
Analysts are forecasting earnings growth of 14.7% per year, which is faster than the wider JP market forecast of 8.7% but not at a level considered very high. At the same time, revenue is expected to grow 2.2% per year, slower than both the JP market and the 20% threshold often associated with high growth stories. That mix suggests the current P/E could be reflecting expectations for improving profitability rather than rapid top line expansion.
Compared with the JP Metals and Mining industry average of 12.3x, the 16.2x P/E points to a premium valuation, while still sitting below the estimated fair P/E of 21.4x. That gap to the fair ratio indicates the market could still move closer to what the SWS fair ratio model implies if earnings progress tracks current forecasts and sentiment remains supportive.
Explore the SWS fair ratio for Mitsubishi Materials
Result: Price-to-Earnings of 16.2x (ABOUT RIGHT)
However, the recent 1-year total shareholder return of 138.24% and a value score of 2 highlight the risk that expectations and valuation may already be stretched.
Find out about the key risks to this Mitsubishi Materials narrative.
Another view: DCF sends a very different signal
While the current 16.2x P/E looks about right against the fair ratio, the SWS DCF model tells a starkly different story. At ¥5,038 the stock was recently trading far above an estimated future cash flow value of ¥73.81, which points to a very rich price. So which signal should carry more weight for you?
Look into how the SWS DCF model arrives at its fair value.
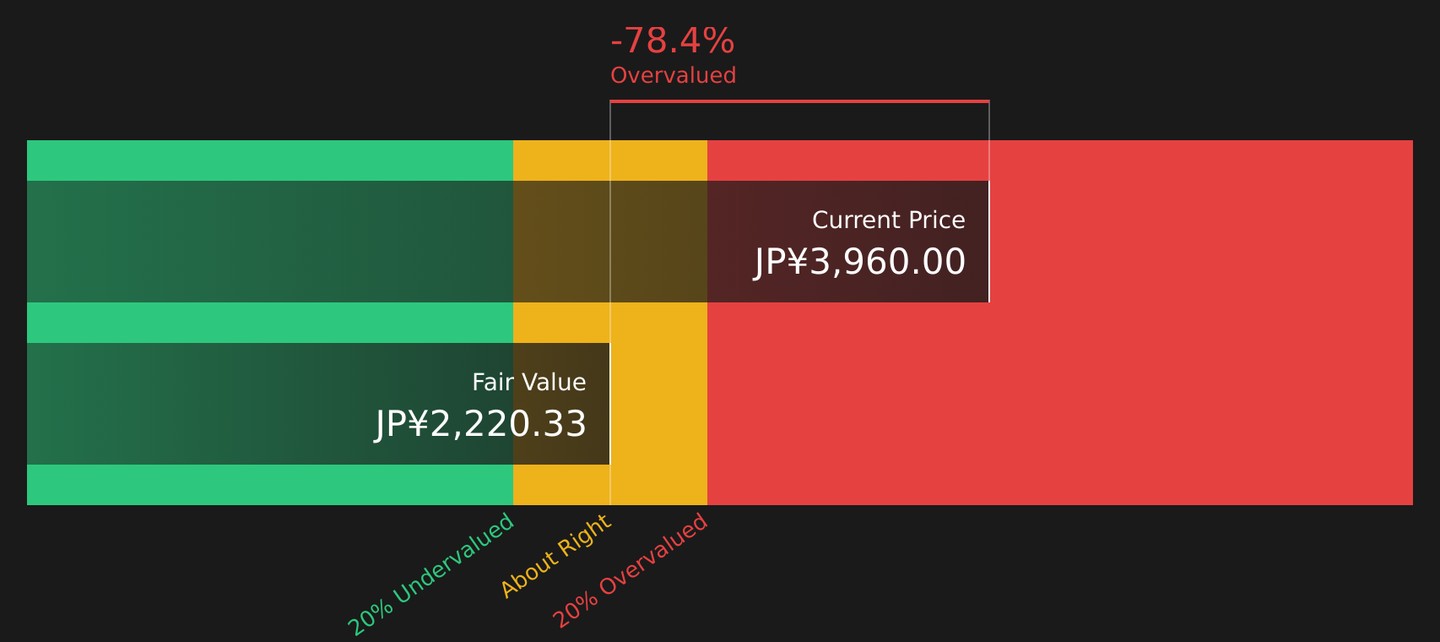
Simply Wall St performs a discounted cash flow (DCF) on every stock in the world every day (check out Mitsubishi Materials for example). We show the entire calculation in full. You can track the result in your watchlist or portfolio and be alerted when this changes, or use our stock screener to discover 16 high quality undervalued stocks. If you save a screener we even alert you when new companies match - so you never miss a potential opportunity.
Next Steps
With sentiment mixed between rich valuation signals and ongoing earnings support, now is a good time to move quickly, review the data, and weigh both the downside and upside using the 2 key rewards and 4 important warning signs.
Looking for more investment ideas?
If you stop with just one stock, you could miss other opportunities that better fit your goals, risk comfort, and income needs.
- Target quality at a discount by scanning companies with strong fundamentals using the 16 high quality undervalued stocks.
- Strengthen your portfolio resilience by focusing on companies highlighted in the 57 resilient stocks with low risk scores.
- Spot less crowded opportunities before others catch on by reviewing the screener containing 59 high quality undiscovered gems.
This article by Simply Wall St is general in nature. We provide commentary based on historical data and analyst forecasts only using an unbiased methodology and our articles are not intended to be financial advice. It does not constitute a recommendation to buy or sell any stock, and does not take account of your objectives, or your financial situation. We aim to bring you long-term focused analysis driven by fundamental data. Note that our analysis may not factor in the latest price-sensitive company announcements or qualitative material. Simply Wall St has no position in any stocks mentioned.
New: Manage All Your Stock Portfolios in One Place
We've created the ultimate portfolio companion for stock investors, and it's free.
• Connect an unlimited number of Portfolios and see your total in one currency
• Be alerted to new Warning Signs or Risks via email or mobile
• Track the Fair Value of your stocks
Try a Demo Portfolio for Free