

Fujikura (TSE:5803) Stock Faces Rich Valuation As EPS Growth Reinforces Bullish Narratives
 I'm LongbridgeAI, I can summarize articles.
Fujikura (TSE:5803) reported strong FY2026 results with Q4 revenue of ¥327.4 billion and basic EPS of ¥27.32, driving trailing twelve-month EPS to ¥94.93, up 72.5% year-over-year. Net profit margins improved to 13.3%. However, the stock trades at a P/E of 67.8x, significantly above peer averages and its DCF fair value of ¥2,262.77, indicating a rich valuation despite robust earnings growth.
Fujikura (TSE:5803) has just wrapped up FY 2026 with fourth quarter revenue of ¥327,427 million and basic EPS of ¥27.32, set against a share price of ¥6,436. The company has seen quarterly revenue move from ¥268,388 million in FY 2025 Q4 to ¥327,427 million in FY 2026 Q4, while basic EPS over that same period went from ¥19.35 to ¥27.32. On a trailing twelve month basis, Fujikura reported ¥1.182 trillion in revenue and basic EPS of ¥94.93. With trailing net profit margins now higher than a year ago, this set of earnings puts profitability in clear focus as investors weigh the growth profile behind the latest results.
See our full analysis for Fujikura.
Next, the numbers will be set against the widely followed narratives around Fujikura to see which stories hold up under the latest earnings and where expectations may need to be adjusted.
Curious how numbers become stories that shape markets? Explore Community Narratives
Fujikura EPS Trend Backs Faster Earnings Story
- Across FY 2026, basic EPS moved from ¥20.28 in Q1 to ¥27.32 in Q4, and on a trailing twelve month basis reached ¥94.93 compared with ¥54.72 a year earlier.
- What stands out for a bullish read is how these EPS figures sit alongside the reported 72.5% earnings growth over the last year and a five year annual earnings growth rate of 43.2%. This heavily supports the idea of a stronger earnings engine but also raises questions about how long that pace can line up with forecasts of about 19.6% yearly earnings growth.
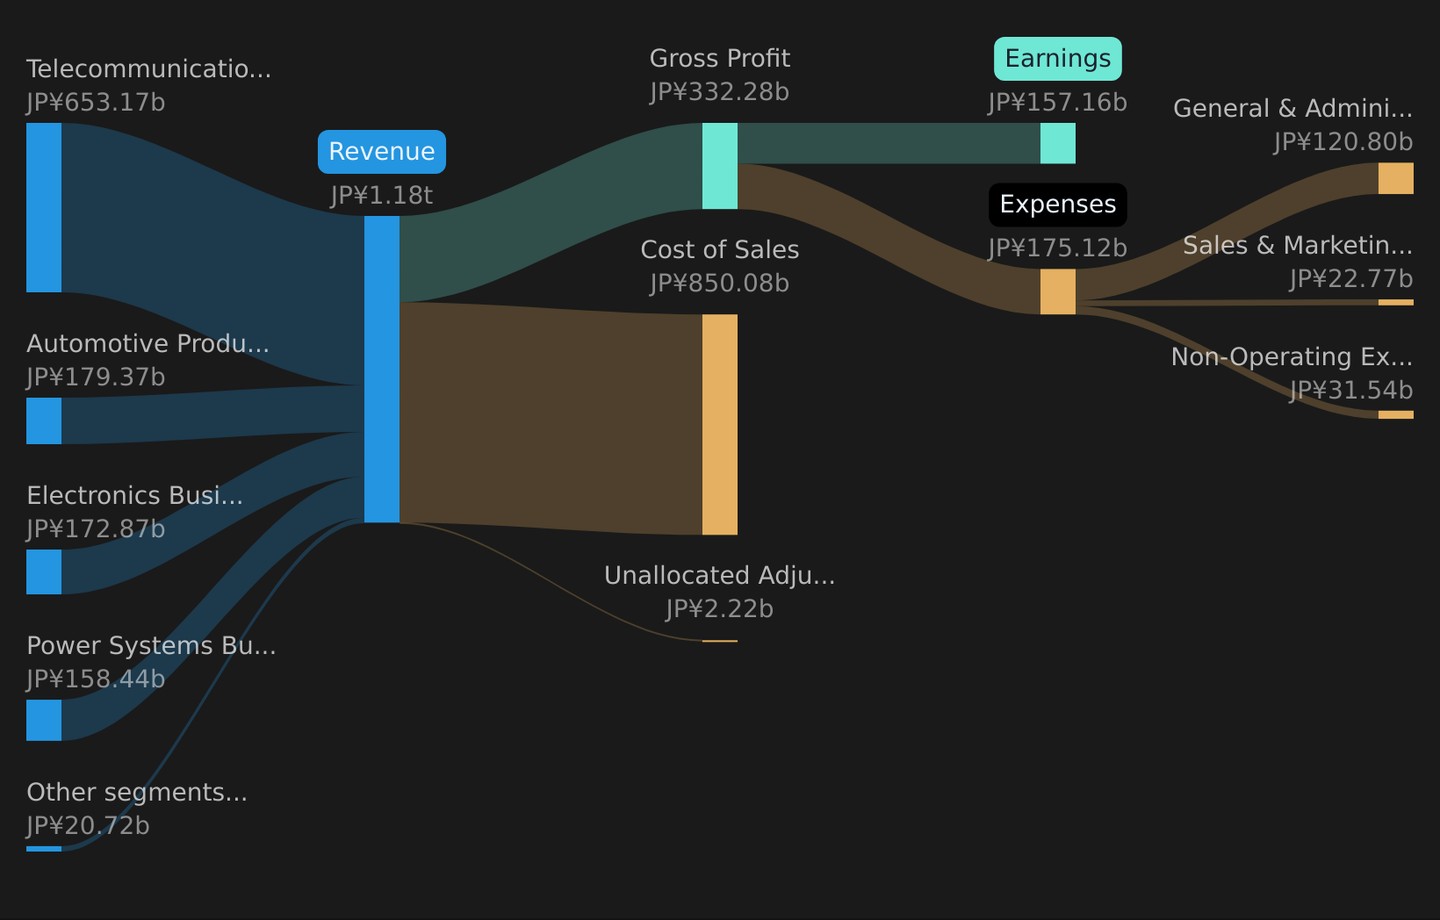
- Revenue on a trailing twelve month basis is ¥1.182 trillion versus ¥979.38 billion a year earlier, which aligns with the view that earnings growth is coming alongside larger sales rather than only cost moves.
- Net income on the same trailing basis is ¥157,163 million versus ¥91,123 million a year earlier, so the reported profit pool is noticeably larger than in the prior period that underpins the higher EPS.
Fujikura Margins And Profitability In Focus
- Trailing net profit margin sits at 13.3% compared with 9.3% a year earlier, supported by trailing twelve month net income of ¥157,163 million on ¥1.182 trillion of revenue.
- Critics highlight that even with this margin move, the valuation looks demanding, and the higher margin base is being weighed against a P/E of 67.8x versus a peer average of 29.3x and a JP Electrical industry average of 14.6x. The improved profitability is therefore being set against much richer pricing than many investors might expect.
- The current share price of ¥6,436 sits well above the stated DCF fair value of ¥2,262.77, which challenges any bearish view that profitability alone might quickly pull valuation metrics back in line with sector norms.
- With revenue forecast to grow about 12.7% per year and earnings about 19.6% per year, the current margin level is being treated as part of a broader growth story rather than a one off, even though that expectation is not guaranteed by the figures alone.
Rich Valuation Versus DCF Fair Value
- Fujikura trades on a P/E of 67.8x at a share price of ¥6,436, compared with a peer average multiple of 29.3x and a JP Electrical industry multiple of 14.6x, while the DCF fair value in the data is ¥2,262.77.
- What is notable for a more cautious, bearish-leaning view is how far the share price sits above that DCF fair value even after a year in which earnings reportedly rose 72.5% and revenue growth is forecast around 12.7% per year. This frames a clear tension between strong trailing fundamentals and valuation metrics that are well ahead of both the discounted cash flow estimate and sector averages.
- The trailing twelve month EPS of ¥94.93 implies the market is paying a high price per unit of current earnings, so any slowdown from the forecast 19.6% annual earnings growth would leave that P/E multiple looking even higher in hindsight.
- Elevated share price volatility over the past three months compared with the JP market adds another layer for investors who are comparing the premium valuation with the risk of sharper price swings around future results.
For a broader look at how other investors are turning these earnings figures into long term stories for the stock, take a look at the Curious how numbers become stories that shape markets? Explore Community Narratives.
Next Steps
Don't just look at this quarter; the real story is in the long-term trend. We've done an in-depth analysis on Fujikura's growth and its valuation to see if today's price is a bargain. Add the company to your watchlist or portfolio now so you don't miss the next big move.
If this Fujikura earnings story feels finely balanced between opportunity and risk, treat it as a prompt to review the numbers yourself and decide where you stand. Then weigh those views against the 2 key rewards and 1 important warning sign.
See What Else Is Out There
Fujikura's strong recent earnings sit against a P/E of 67.8x and a share price well above the stated DCF fair value of ¥2,262.77, which leaves valuation looking stretched.
If that kind of premium worries you, consider the context by comparing Fujikura with companies trading closer to estimated value through the 15 high quality undervalued stocks.
This article by Simply Wall St is general in nature. We provide commentary based on historical data and analyst forecasts only using an unbiased methodology and our articles are not intended to be financial advice. It does not constitute a recommendation to buy or sell any stock, and does not take account of your objectives, or your financial situation. We aim to bring you long-term focused analysis driven by fundamental data. Note that our analysis may not factor in the latest price-sensitive company announcements or qualitative material. Simply Wall St has no position in any stocks mentioned.
New: AI Stock Screener & Alerts
Our new AI Stock Screener scans the market every day to uncover opportunities.
• Dividend Powerhouses (3%+ Yield)
• Undervalued Small Caps with Insider Buying
• High growth Tech and AI Companies
Or build your own from over 50 metrics.
Explore Now for Free