

These 4 Measures Indicate That Keda Industrial Group (SHSE:600499) Is Using Debt Extensively
 I'm LongbridgeAI, I can summarize articles.
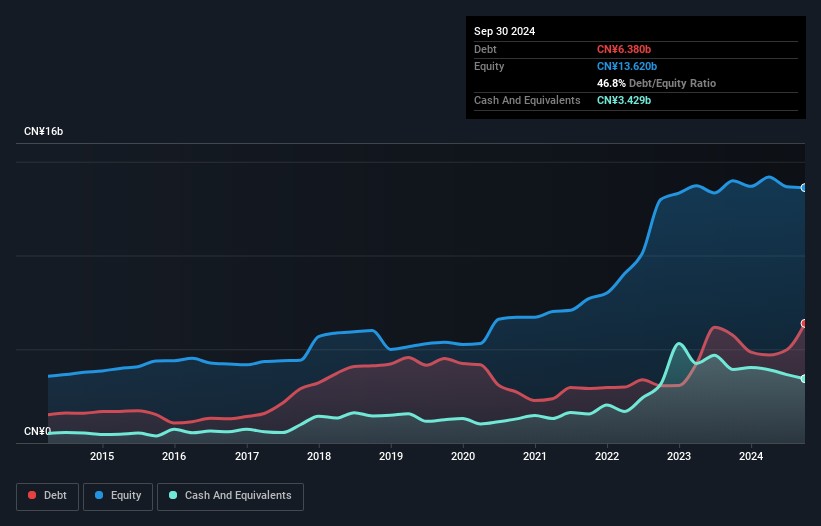
Keda Industrial Group (SHSE:600499) has increased its debt to CN¥6.38 billion, with net debt at approximately CN¥2.95 billion after accounting for CN¥3.43 billion in cash. The company faces liabilities of CN¥6.89 billion due within a year, exceeding its cash and receivables. Its net debt to EBITDA ratio is 1.9, indicating moderate debt use, but a 16% decline in EBIT raises concerns about future debt management. Negative free cash flow over three years adds to the risk, suggesting shareholders should be cautious about the company's debt levels.
Howard Marks put it nicely when he said that, rather than worrying about share price volatility, 'The possibility of permanent loss is the risk I worry about... and every practical investor I know worries about.' When we think about how risky a company is, we always like to look at its use of debt, since debt overload can lead to ruin. We can see that Keda Industrial Group Co., Ltd. (SHSE:600499) does use debt in its business. But should shareholders be worried about its use of debt?
When Is Debt Dangerous?
Debt and other liabilities become risky for a business when it cannot easily fulfill those obligations, either with free cash flow or by raising capital at an attractive price. If things get really bad, the lenders can take control of the business. However, a more common (but still painful) scenario is that it has to raise new equity capital at a low price, thus permanently diluting shareholders. Of course, plenty of companies use debt to fund growth, without any negative consequences. When we think about a company's use of debt, we first look at cash and debt together.
View our latest analysis for Keda Industrial Group
What Is Keda Industrial Group's Debt?
As you can see below, at the end of September 2024, Keda Industrial Group had CN¥6.38b of debt, up from CN¥5.75b a year ago. Click the image for more detail. However, it does have CN¥3.43b in cash offsetting this, leading to net debt of about CN¥2.95b.
A Look At Keda Industrial Group's Liabilities
Zooming in on the latest balance sheet data, we can see that Keda Industrial Group had liabilities of CN¥6.89b due within 12 months and liabilities of CN¥4.65b due beyond that. On the other hand, it had cash of CN¥3.43b and CN¥2.98b worth of receivables due within a year. So its liabilities total CN¥5.12b more than the combination of its cash and short-term receivables.
This deficit isn't so bad because Keda Industrial Group is worth CN¥15.3b, and thus could probably raise enough capital to shore up its balance sheet, if the need arose. But it's clear that we should definitely closely examine whether it can manage its debt without dilution.
We use two main ratios to inform us about debt levels relative to earnings. The first is net debt divided by earnings before interest, tax, depreciation, and amortization (EBITDA), while the second is how many times its earnings before interest and tax (EBIT) covers its interest expense (or its interest cover, for short). This way, we consider both the absolute quantum of the debt, as well as the interest rates paid on it.
Keda Industrial Group's net debt to EBITDA ratio of about 1.9 suggests only moderate use of debt. And its commanding EBIT of 1k times its interest expense, implies the debt load is as light as a peacock feather. Unfortunately, Keda Industrial Group's EBIT flopped 16% over the last four quarters. If that sort of decline is not arrested, then the managing its debt will be harder than selling broccoli flavoured ice-cream for a premium. When analysing debt levels, the balance sheet is the obvious place to start. But ultimately the future profitability of the business will decide if Keda Industrial Group can strengthen its balance sheet over time. So if you want to see what the professionals think, you might find this free report on analyst profit forecasts to be interesting.
Finally, a business needs free cash flow to pay off debt; accounting profits just don't cut it. So the logical step is to look at the proportion of that EBIT that is matched by actual free cash flow. Over the last three years, Keda Industrial Group saw substantial negative free cash flow, in total. While investors are no doubt expecting a reversal of that situation in due course, it clearly does mean its use of debt is more risky.
Our View
To be frank both Keda Industrial Group's EBIT growth rate and its track record of converting EBIT to free cash flow make us rather uncomfortable with its debt levels. But at least it's pretty decent at covering its interest expense with its EBIT; that's encouraging. Once we consider all the factors above, together, it seems to us that Keda Industrial Group's debt is making it a bit risky. Some people like that sort of risk, but we're mindful of the potential pitfalls, so we'd probably prefer it carry less debt. There's no doubt that we learn most about debt from the balance sheet. But ultimately, every company can contain risks that exist outside of the balance sheet. For example, we've discovered 3 warning signs for Keda Industrial Group that you should be aware of before investing here.
If, after all that, you're more interested in a fast growing company with a rock-solid balance sheet, then check out our list of net cash growth stocks without delay.