

Assessing Kubota (TSE:6326) Valuation After A Strong Multi‑Period Share Price Run
 I'm LongbridgeAI, I can summarize articles.
Kubota (TSE:6326) has seen a significant rise in its share price, prompting investors to reassess its valuation. The stock has increased by 31.75% over the past 30 days and 71.29% over the past year. Currently trading at ¥3,137, its P/E ratio of 20.2x is above the industry average but below its peers, suggesting mixed signals on valuation. While the P/E indicates potential overvaluation, a DCF analysis suggests the stock is overvalued at its current price compared to future cash flow estimates. Investors are encouraged to consider both earnings multiples and cash flow assessments in their evaluations.
What is moving Kubota shares right now?
Kubota (TSE:6326) has drawn fresh attention after a strong recent share price run, with the stock up over the past week, month, past 3 months and year. This is prompting investors to reassess its current valuation.
See our latest analysis for Kubota.
The recent surge continues a strong run, with Kubota’s 30 day share price return of 31.75%, 90 day return of 48.22% and 2025 year to date return of 39.92%. Its 1 year total shareholder return sits at 71.29%, suggesting momentum has been building rather than fading.
If Kubota’s move has you looking beyond a single stock, this could be a good moment to check out a screener of 10 top founder-led companies as potential next ideas.
With Kubota trading around ¥3,137 after a strong run and an analyst price target of ¥2,640, the market seems optimistic. Is the stock now stretched, or are investors correctly pricing in future growth potential?
Price-to-Earnings of 20.2x: Is it justified?
Looking at Kubota through the P/E lens, the current valuation of 20.2x sits above the wider JP Machinery industry average but below its closest peer group and an estimated fair level. With the share price at ¥3,137 after a strong run, the question is how much earnings power the market is already baking in.
The P/E ratio compares the current share price to earnings per share and is a quick way to see how much investors are willing to pay for each unit of profit. For a diversified machinery group like Kubota, active in agriculture, construction and infrastructure, this matters because earnings can be cyclical and investors often look for a margin of safety when profits have recently been under pressure.
Here, the signals pull in different directions. On one side, Kubota is described as expensive versus the JP Machinery industry, with its 20.2x P/E above the 14.7x industry average, which can suggest the market is assigning a premium to its earnings. On the other side, the same 20.2x P/E is flagged as good value versus both a peer average of 24.4x and an estimated fair P/E of 26.3x, which points to room for the market multiple to move closer to that higher level if earnings forecasts play out. Explore the SWS fair ratio for Kubota
Result: Price-to-Earnings of 20.2x (ABOUT RIGHT)
However, risks remain, including any slowdown in Kubota’s end markets or pressure on its recent 9.6% net income growth, which could challenge the current premium P/E.
Find out about the key risks to this Kubota narrative.
Another view, using the SWS DCF model
If you switch from the P/E lens to our DCF model, the picture changes sharply. At ¥3,137, Kubota is trading well above the SWS DCF estimate of future cash flow value of ¥1,038.41. This suggests that, on this framework, the shares appear overvalued. So which signal do you trust more: earnings multiple or cash flows?
Look into how the SWS DCF model arrives at its fair value.
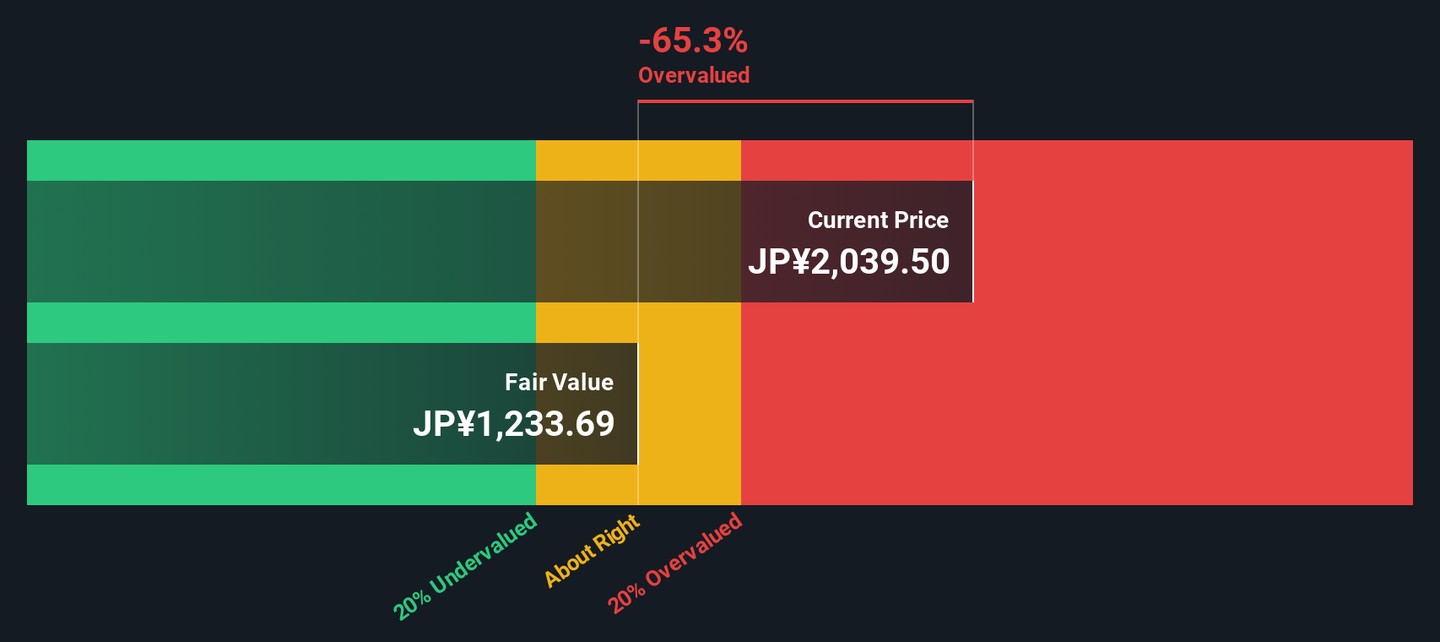
Simply Wall St performs a discounted cash flow (DCF) on every stock in the world every day (check out Kubota for example). We show the entire calculation in full. You can track the result in your watchlist or portfolio and be alerted when this changes, or use our stock screener to discover 22 high quality undervalued stocks. If you save a screener we even alert you when new companies match - so you never miss a potential opportunity.
Build Your Own Kubota Narrative
If this take on Kubota does not quite match your own view, or you would rather work directly with the numbers yourself, you can shape a full story around the data in just a few minutes: Do it your way.
A great starting point for your Kubota research is our analysis highlighting 1 key reward and 2 important warning signs that could impact your investment decision.
Looking for more investment ideas?
If Kubota has sharpened your focus, do not stop here. Broaden your watchlist now so you do not miss other compelling setups across sectors and styles.
- Spot potential value opportunities early by checking companies our screener tags as 22 high quality undervalued stocks with solid fundamentals backing their current pricing.
- Strengthen the defensive side of your portfolio by reviewing our 44 resilient stocks with low risk scores that score well on financial and risk factors.
- Hunt for lesser known opportunities by scanning the screener containing 65 high quality undiscovered gems where quality metrics point to businesses that are still off most investors’ radar.
This article by Simply Wall St is general in nature. We provide commentary based on historical data and analyst forecasts only using an unbiased methodology and our articles are not intended to be financial advice. It does not constitute a recommendation to buy or sell any stock, and does not take account of your objectives, or your financial situation. We aim to bring you long-term focused analysis driven by fundamental data. Note that our analysis may not factor in the latest price-sensitive company announcements or qualitative material. Simply Wall St has no position in any stocks mentioned.
Valuation is complex, but we're here to simplify it.
Discover if Kubota might be undervalued or overvalued with our detailed analysis, featuring fair value estimates, potential risks, dividends, insider trades, and its financial condition.
Access Free Analysis