

A Look At Aisin (TSE:7259) Valuation As Share Price Cools After Strong One Year Return
 I'm LongbridgeAI, I can summarize articles.
Aisin (TSE:7259) shares have cooled after a 41% one-year return, trading at a P/E of 10.1x, below the estimated fair value of 14.3x and significantly under Simple Wall Street's DCF-implied value of ¥5,022. Despite recent price declines, earnings grew 59.6% last year. The analysis suggests the stock may be undervalued, though risks include auto demand slowdowns.
Recent share performance and business profile
Aisin (TSE:7259) has drawn investor attention after a period of mixed share performance, with the stock down about 2% over the past day but modestly higher over the past month.
Over the past week the share price has slipped around 1%, while over the past 3 months it has fallen roughly 4%. Year to date, the stock is down about 20%, despite a total return over the past year of roughly 41%.
The company operates as a diversified auto parts supplier, reporting revenue of ¥5,117,764 and net income of ¥171,697 in its latest annual figures, with operations spanning Japan, North America, China, Europe, ASEAN India, and other regions.
See our latest analysis for Aisin.
Short term share price momentum has cooled, with recent declines contrasting with a much stronger 1 year total shareholder return of about 41%. This suggests earlier gains are now being reassessed at the current ¥2,392 level.
If Aisin’s recent moves have you thinking about where automotive technology could head next, it may be worth scanning companies in robotics and automation via the 33 robotics and automation stocks
With Aisin’s share price cooling after strong multi year gains, yet still below some valuation estimates, investors may be considering whether this represents an opportunity to purchase the stock at a discount or whether the market is already pricing in future growth.
Price-to-Earnings of 10.1x: Is it justified?
Aisin currently trades on a P/E of 10.1x, which sits below the estimated fair P/E of 14.3x, yet slightly above the 9.2x average for the JP Auto Components industry.
The P/E ratio compares the company’s share price with its earnings per share. A lower P/E can sometimes point to more modest expectations, while a higher P/E can signal that investors are willing to pay more for earnings. For Aisin, the current multiple comes alongside earnings that grew 59.6% over the past year and are forecast to grow 5.23% per year, with net profit margins at 3.4% compared with 2.2% last year and earnings described as high quality.
Compared with peers, Aisin’s 10.1x P/E is higher than the 9.2x industry average but sits well below the 37.3x peer average highlighted in the checks. It is also below the estimated fair P/E of 14.3x that the fair ratio suggests the market could move closer to if sentiment aligns with those fundamentals.
Explore the SWS fair ratio for Aisin
Result: Price-to-Earnings of 10.1x (UNDERVALUED)
However, there are still clear risks, including any slowdown in auto demand or pressure on margins across Aisin’s broad global operations and product lines.
Wall Street's queuing for one rocket. While SpaceX counts down to its IPO, other companies tied to the new space race are already in orbit. → 20 Compelling Space Companies watchlist · Global Space Race Investing Ideas screener · Scan the sector by valuation on Rocket Lab's valuation page.
Another way to look at value
While the P/E ratio of 10.1x suggests some room compared with the fair ratio of 14.3x, the SWS DCF model paints an even stronger picture of value. With the share price at ¥2,392 versus an estimated future cash flow value of ¥5,022.3, the gap is wide and points to a different risk reward balance.
For investors, the question is whether that discount reflects caution about slower forecast growth, or whether it signals an opportunity if the cash flows materialise closer to the model’s assumptions.
Look into how the SWS DCF model arrives at its fair value.
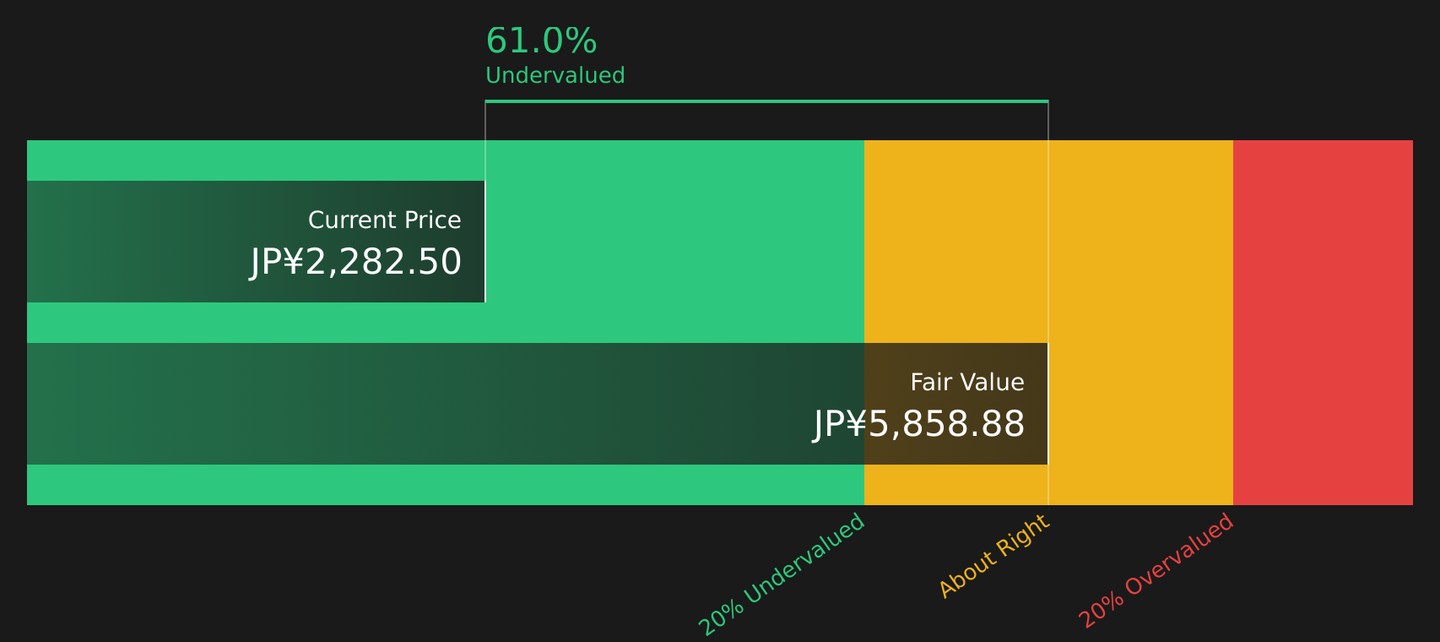
Simply Wall St performs a discounted cash flow (DCF) on every stock in the world every day (check out Aisin for example). We show the entire calculation in full. You can track the result in your watchlist or portfolio and be alerted when this changes, or use our stock screener to discover 11 high quality undervalued stocks. If you save a screener we even alert you when new companies match - so you never miss a potential opportunity.
Next Steps
Given the combination of positive signals and caution in this review, this may be an appropriate moment to examine the numbers yourself and consider what they suggest. To make that process easier, start by carefully reviewing the 3 key rewards and 1 important warning sign
Looking for more investment ideas?
If you stop with just one stock, you risk missing other opportunities that better fit your goals, risk comfort, and income needs.
- Target stability first by scanning companies on the 55 resilient stocks with low risk scores that focus on resilient balance sheets and lower overall risk scores.
- Hunt for potential mispricing by checking the 11 high quality undervalued stocks where solid fundamentals may not yet be fully reflected in current prices.
- Spot potential future standouts early by using the screener containing 59 high quality undiscovered gems to see lesser known companies with strong underlying metrics.
This article by Simply Wall St is general in nature. We provide commentary based on historical data and analyst forecasts only using an unbiased methodology and our articles are not intended to be financial advice. It does not constitute a recommendation to buy or sell any stock, and does not take account of your objectives, or your financial situation. We aim to bring you long-term focused analysis driven by fundamental data. Note that our analysis may not factor in the latest price-sensitive company announcements or qualitative material. Simply Wall St has no position in any stocks mentioned.
New: Manage All Your Stock Portfolios in One Place
We've created the ultimate portfolio companion for stock investors, and it's free.
• Connect an unlimited number of Portfolios and see your total in one currency
• Be alerted to new Warning Signs or Risks via email or mobile
• Track the Fair Value of your stocks
Try a Demo Portfolio for Free