

A Look At Pan Pacific International Holdings (TSE:7532) Valuation After Solid May 2026 Sales Growth
 I'm LongbridgeAI, I can summarize articles.
Pan Pacific International Holdings reported solid May 2026 sales growth, yet its stock remains down 14.08% over 90 days. With a P/E of 23.9x, the company trades at a premium to peers and industry averages, suggesting market confidence in future earnings despite slower forecasted growth compared to the broader market. A DCF model values the share at ¥833.49, below the current price of ¥867.8, indicating potential overvaluation.
Pan Pacific International Holdings (TSE:7532) released its May 2026 sales update, highlighting year over year gains in both comparable and all store sales across its domestic retail and discount store operations.
See our latest analysis for Pan Pacific International Holdings.
At a share price of ¥867.8, the stock has risen 2.21% over the last day and 5.05% over the past week, but is still down 14.08% over 90 days. The 3 year total shareholder return of 76.66% and 5 year total shareholder return of 94.86% point to a much stronger longer term picture, indicating that recent momentum has cooled following a solid multi year run.
If Pan Pacific International’s latest sales figures have you reviewing your watchlist, it could be a good moment to broaden your research with 12 top founder-led companies
With May sales data pointing to steady store growth but the share price still down over 90 days, the key question is whether Pan Pacific International is now trading below its fundamentals or if the stock already reflects expectations for future growth.
Preferred P/E of 23.9x: Is it justified?
On a P/E of 23.9x at a share price of ¥867.8, Pan Pacific International is priced above both its peer group and the wider JP Multiline Retail industry, which points to a richer earnings valuation than many competitors.
The P/E multiple compares the share price with earnings per share. A higher P/E usually means the market is willing to pay more today for each unit of current earnings. For a retailer with established operations in Japan, North America and Asia, this type of premium can often reflect confidence that earnings will continue to grow over time, rather than just a one off result.
Here, that premium sits against a few reference points. Earnings are forecast to grow 8.4% per year, compared to the 9.3% forecast for the broader JP market. Revenue is expected to grow 5.4% per year, compared to the 6% forecast for the JP market. Yet the stock trades on a P/E above the peer average of 22.1x and well above the JP Multiline Retail industry average of 15.9x. This suggests investors are still paying up for the company’s growth profile and high quality past earnings record despite softer share price performance over the last year.
Relative to the estimated fair P/E of 23.3x, the current 23.9x multiple also sits slightly above the level the market could move towards if earnings expectations and pricing re align.
Explore the SWS fair ratio for Pan Pacific International Holdings
Result: Price-to-earnings of 23.9x (OVERVALUED)
However, investors still face risks if domestic or North American segments slow, or if the current earnings multiple contracts faster than revenue and profit growth.
Wall Street's queuing for one rocket. While SpaceX counts down to its IPO, other companies tied to the new space race are already in orbit. → 20 Compelling Space Companies watchlist · Global Space Race Investing Ideas screener · Scan the sector by valuation on Rocket Lab's valuation page.
Another View: Cash Flow Points to a Smaller Premium
While the 23.9x P/E suggests Pan Pacific International is priced richly, the SWS DCF model values the stock at ¥833.49 per share versus the current ¥867.8. That implies the market price sits above modelled future cash flows, which raises the question of how much optimism is already in the price.
Look into how the SWS DCF model arrives at its fair value.
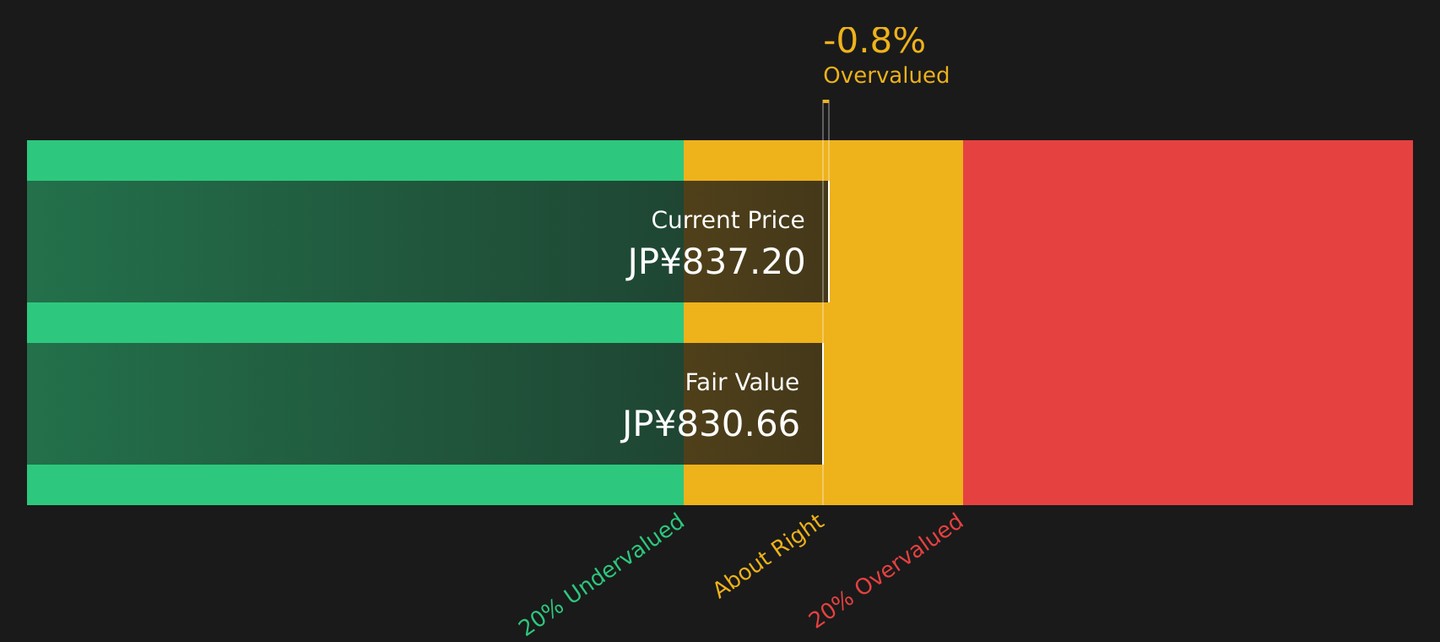
Simply Wall St performs a discounted cash flow (DCF) on every stock in the world every day (check out Pan Pacific International Holdings for example). We show the entire calculation in full. You can track the result in your watchlist or portfolio and be alerted when this changes, or use our stock screener to discover 17 high quality undervalued stocks. If you save a screener we even alert you when new companies match - so you never miss a potential opportunity.
Next Steps
Wondering if the tone of this update feels cautious or constructive, and whether current pricing really reflects those rewards investors are focused on? Act quickly by reviewing the underlying data, then pressure test your own thesis against the 3 key rewards.
Looking for more investment ideas?
If Pan Pacific International is already on your radar, do not stop there. Broaden your opportunity set before the next move catches you off guard.
- Spot potential turnaround stories early by scanning 1 elite penny stocks with strong financials that pair smaller market caps with more robust financial profiles than you might expect.
- Zero in on quality at a marked down price by reviewing the 17 high quality undervalued stocks that combine stronger balance sheets with healthier cash generation.
- Balance growth aspirations with staying power by checking the 51 resilient stocks with low risk scores that score well on resilience and financial strength.
This article by Simply Wall St is general in nature. We provide commentary based on historical data and analyst forecasts only using an unbiased methodology and our articles are not intended to be financial advice. It does not constitute a recommendation to buy or sell any stock, and does not take account of your objectives, or your financial situation. We aim to bring you long-term focused analysis driven by fundamental data. Note that our analysis may not factor in the latest price-sensitive company announcements or qualitative material. Simply Wall St has no position in any stocks mentioned.
New: Manage All Your Stock Portfolios in One Place
We've created the ultimate portfolio companion for stock investors, and it's free.
• Connect an unlimited number of Portfolios and see your total in one currency
• Be alerted to new Warning Signs or Risks via email or mobile
• Track the Fair Value of your stocks
Try a Demo Portfolio for Free