

TamronLtd (TSE:7740) Could Be 14% Below Fair Value On Full Year Guidance
 I'm LongbridgeAI, I can summarize articles.
Tamron Ltd (TSE:7740) released full year 2026 guidance projecting net sales of ¥93,000 million and profit of ¥13,690 million. Despite a recent stock surge, analysis indicates the share price is approximately 14% below its SWS DCF fair value estimate. However, its P/E ratio of 20.9x appears expensive compared to industry peers, creating mixed valuation signals for investors.
TamronLtd (TSE:7740) drew fresh investor attention after releasing full year 2026 earnings guidance, projecting net sales of ¥93,000 million, operating income of ¥18,500 million and profit of ¥13,690 million, or ¥84.91 per share.
See our latest analysis for TamronLtd.
TamronLtd’s updated guidance arrives after a strong run in the stock, with the share price at ¥1,434 and a 30-day share price return of 25.46% alongside a 1-year total shareholder return of 55.46%, suggesting momentum has been building recently.
If you are weighing TamronLtd’s guidance against other opportunities in opticals and imaging, it can help to broaden your view and scan 37 robotics and automation stocks
Bulls point to TamronLtd’s earnings guidance and recent share price surge. Bears focus on whether expectations now run too hot. Which side does the current valuation actually support, based on the cash flows investors are paying for?
Price-to-Earnings of 20.9x: Is It Justified For TamronLtd?
TamronLtd closed at ¥1,434, which equates to a P/E of 20.9x, while also trading 14.2% below the SWS DCF fair value estimate of ¥1,671.39.
The P/E ratio compares the current share price with earnings per share. For a company like TamronLtd with established operations across photography, surveillance and mobility optics, P/E gives a quick read on how much investors are paying for each unit of current earnings.
Here the signals do not all point in the same direction. The SWS DCF model, which projects future cash flows and discounts them back to today, suggests the share price sits below estimated fair value. Yet the current P/E of 20.9x screens as expensive against both the Consumer Durables industry average of 9.9x and the peer average of 17.8x. It also stands above the estimated fair P/E of 14.6x, a level the market could move toward if enthusiasm for the recent share price run fades and expectations normalise.
Investors weighing these mixed messages may want a closer look at how that fair P/E is derived through earnings quality, growth and risk inputs. Explore the SWS fair ratio for TamronLtd
Result: Price-to-Earnings of 20.9x (OVERVALUED)
However, investors should still watch for any shift in TamronLtd’s earnings quality assumptions or a change in sentiment if recent share price momentum cools.
Find out about the key risks to this TamronLtd narrative.
Another View On TamronLtd Using Our DCF Model
While the current P/E of 20.9x makes TamronLtd look expensive relative to the Consumer Durables industry and peers, the SWS DCF model points in a different direction. At a share price of ¥1,434 the stock trades about 14.2% below the DCF fair value estimate of ¥1,671.39, which frames the P/E premium in a different light. How much weight do you put on earnings multiples versus long term cash flow estimates?
Investors who want to see how the detailed cash flow assumptions compare with simple multiples can review the full model input and output. Look into how the SWS DCF model arrives at its fair value.
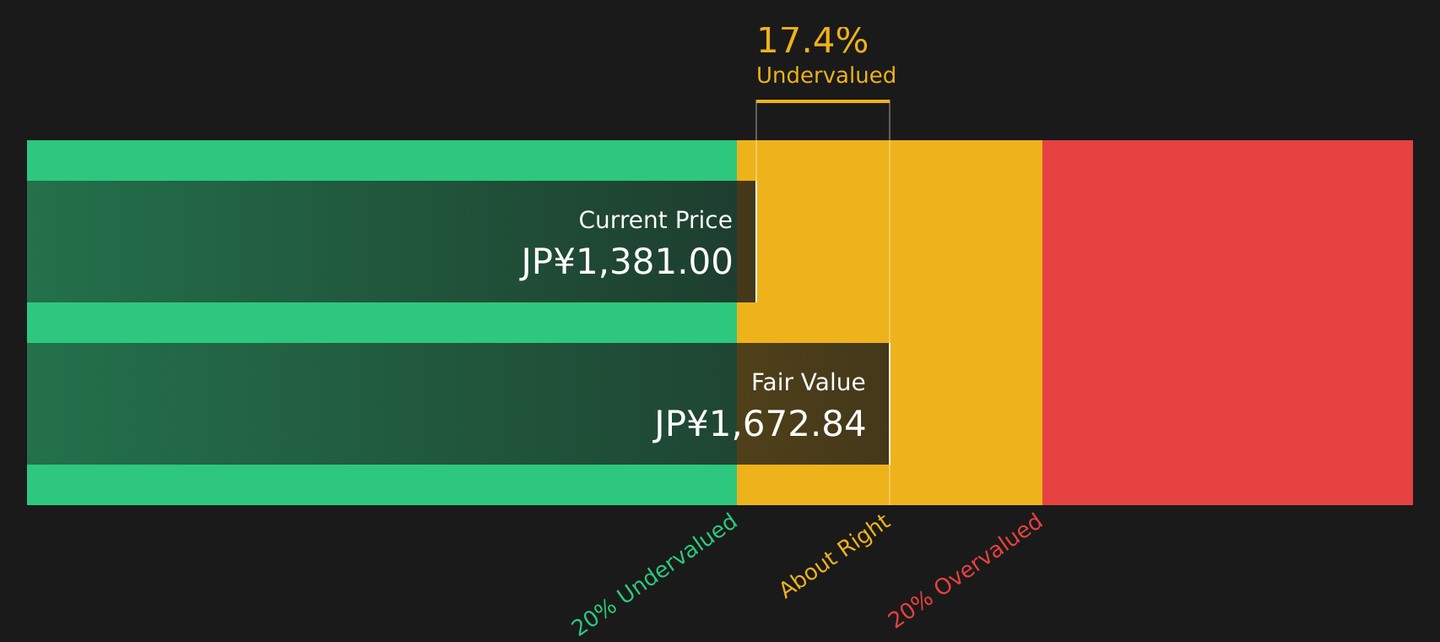
Simply Wall St performs a discounted cash flow (DCF) on every stock in the world every day (check out TamronLtd for example). We show the entire calculation in full. You can track the result in your watchlist or portfolio and be alerted when this changes, or use our stock screener to discover 26 high quality undervalued stocks. If you save a screener we even alert you when new companies match - so you never miss a potential opportunity.
Next Steps
Mixed messages on valuation and sentiment around TamronLtd can feel messy, so move quickly. Look through the numbers yourself and weigh both sides of the story using 2 key rewards and 2 important warning signs
Looking For More Ideas Beyond TamronLtd?
If TamronLtd has sharpened your focus on opportunities, do not stop here. Use the Simply Wall Street Screener to spot other stocks that fit your goals.
- Target potential mispricings by scanning 26 high quality undervalued stocks that combine compressed valuations with solid underlying fundamentals.
- Build a steadier income stream by reviewing 33 dividend fortresses that emphasise higher yields with an eye on durability.
- Protect your capital by shortlisting 58 resilient stocks with low risk scores that score well on resilience and financial strength.
This article by Simply Wall St is general in nature. We provide commentary based on historical data and analyst forecasts only using an unbiased methodology and our articles are not intended to be financial advice. It does not constitute a recommendation to buy or sell any stock, and does not take account of your objectives, or your financial situation. We aim to bring you long-term focused analysis driven by fundamental data. Note that our analysis may not factor in the latest price-sensitive company announcements or qualitative material. Simply Wall St has no position in any stocks mentioned.
Valuation is complex, but we're here to simplify it.
Discover if TamronLtd might be undervalued or overvalued with our detailed analysis, featuring fair value estimates, potential risks, dividends, insider trades, and its financial condition.
Access Free Analysis