

Is SM Energy (SM) Pricing Reflect Its Cash Flow Outlook And Civitas Merger?
 I'm LongbridgeAI, I can summarize articles.
SM Energy's current share price of $21.90 reflects mixed market signals, with a 41.6% decline over the past year. A Discounted Cash Flow (DCF) analysis suggests the stock is undervalued by 85.1%, with projected free cash flow increasing significantly by 2028. Additionally, SM Energy's P/E ratio of 7.25x is below industry averages, indicating potential undervaluation. The company's merger with Civitas and evolving market conditions may further influence its valuation narrative.
- If you are wondering whether SM Energy is attractively priced or just a value trap, this article will walk through what the current share price really reflects.
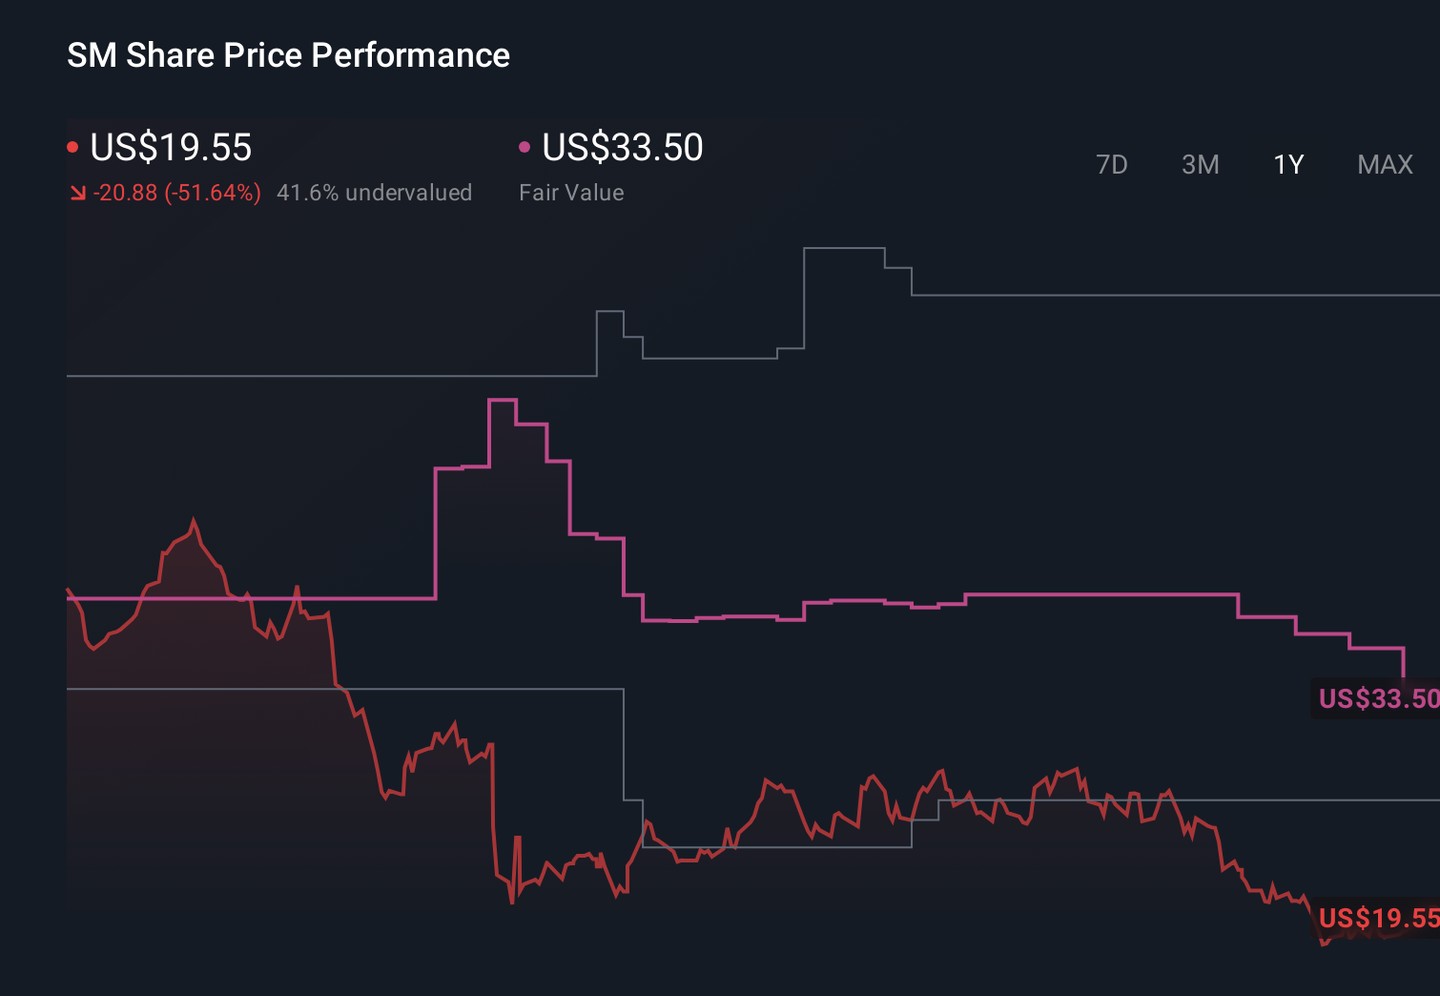
- The stock last closed at US$21.90, with returns of 9.3% over the past week, 22.6% over the past month, 14.5% year to date, and a 41.6% decline over the past year. Taken together, these figures give mixed signals about how the market currently views its prospects and risk.
- Recent coverage of SM Energy has focused on its position in the US energy sector and how investor sentiment has shifted around companies with similar profiles. This context helps explain why the share price has seen both strong shorter term gains and weaker longer term returns as markets reassess risk and opportunity in the space.
- On our checks of whether the shares look undervalued, SM Energy scores 5 out of 6 on our valuation score. This sets us up to compare traditional valuation methods next and finish with a more complete framework for thinking about what the stock might really be worth.
Find out why SM Energy's -41.6% return over the last year is lagging behind its peers.
Approach 1: SM Energy Discounted Cash Flow (DCF) Analysis
A Discounted Cash Flow, or DCF, model takes projected future cash flows and discounts them back to what they might be worth to investors today.
For SM Energy, the latest twelve month free cash flow (FCF) figure is a loss of about $307.4 million. Despite that, analysts and extrapolated estimates point to positive free cash generation ahead. For example, projected FCF for 2028 is $1,672.0 million, and a full set of estimates and extrapolations runs through 2035, with values mostly in the $1.3b to $1.7b range before discounting.
These projections are fed into a 2 Stage Free Cash Flow to Equity model, which values the equity at an estimated intrinsic value of about $146.58 per share. Compared with the recent share price of about $21.90, the model implies the stock is about 85.1% undervalued on this set of assumptions.
Result: UNDERVALUED
Our Discounted Cash Flow (DCF) analysis suggests SM Energy is undervalued by 85.1%. Track this in your watchlist or portfolio, or discover 51 more high quality undervalued stocks.
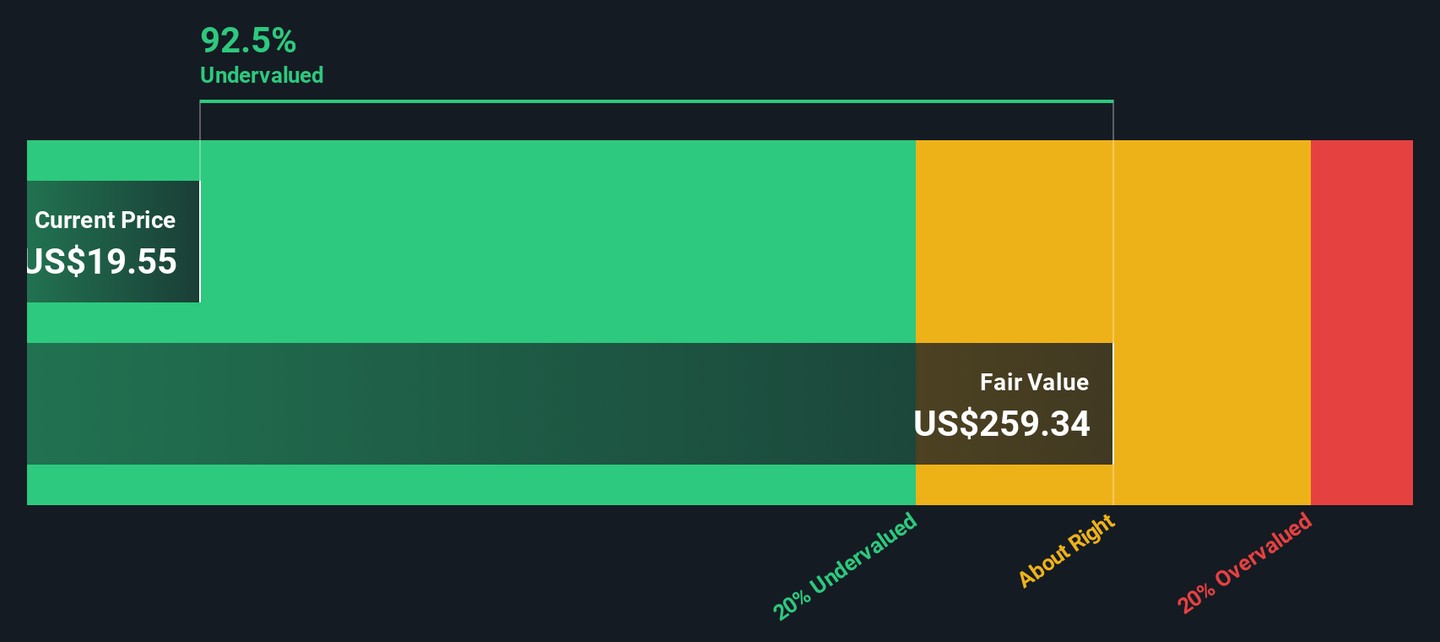
Head to the Valuation section of our Company Report for more details on how we arrive at this Fair Value for SM Energy.
Approach 2: SM Energy Price vs Earnings
For a profitable company, the P/E ratio is a useful way to see what investors are currently willing to pay for each dollar of earnings. It quickly links the share price to the business’s actual profit, which is usually the main driver of long term returns.
What counts as a “normal” or “fair” P/E depends on how the market views growth potential and risk. Higher expected growth or lower perceived risk can justify a higher P/E. Slower growth or higher risk tends to be associated with a lower P/E.
SM Energy currently trades on a P/E of 7.25x. That sits below the Oil and Gas industry average of about 14.50x and well below the broader peer group average of 20.60x. Simply Wall St’s Fair Ratio for SM Energy is 19.35x. This is its proprietary estimate of what the P/E might be, given factors such as the company’s earnings profile, margins, industry, market cap and risk characteristics. This can be more tailored than a simple comparison with peers or the industry average because it attempts to adjust for company specific traits. Compared with the current 7.25x P/E, the Fair Ratio of 19.35x indicates that the shares may be undervalued on this measure.
Result: UNDERVALUED
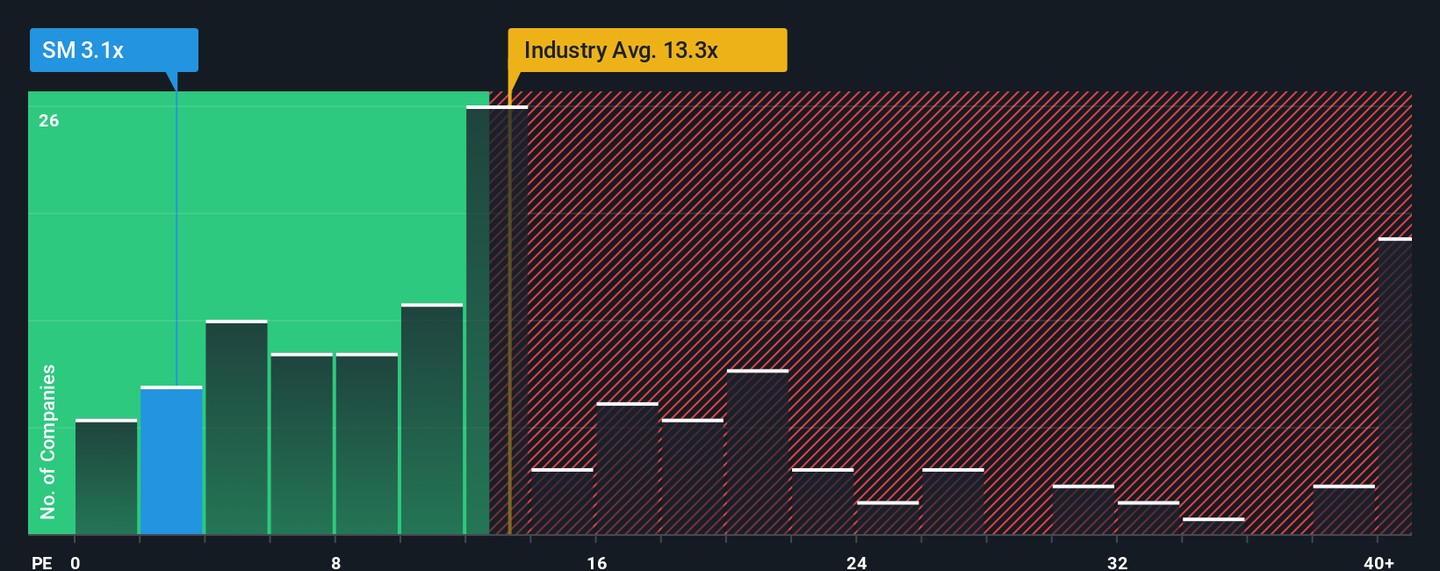
P/E ratios tell one story, but what if the real opportunity lies elsewhere? Start investing in legacies, not executives. Discover our 22 top founder-led companies.
Upgrade Your Decision Making: Choose your SM Energy Narrative
Earlier we mentioned that there is an even better way to understand valuation, so let us introduce you to Narratives.
A Narrative is simply your story about a company, where you connect your view of its business to your own numbers for future revenue, earnings, margins and a fair value estimate.
On Simply Wall St, Narratives sit inside the Community page and turn that story into a clear forecast and fair value that you can line up against today’s share price to help you decide whether you think SM Energy is closer to fairly priced, overvalued, or undervalued on your assumptions.
They do not stay static, because when new information comes in, such as SM Energy’s merger with Civitas, leadership changes, updated fair value of US$48.00 or revised assumptions for growth, margins, discount rate and future P/E, those inputs can refresh the Narrative and your implied value.
For example, one SM Energy Narrative might lean toward the higher fair value of about US$48.00 with revenue growth of roughly 33.9%, a 15.2% profit margin and a future P/E near 5.8x. Another might sit closer to US$27.00 with revenue growth of about 3.7%, a 13.7% margin and a future P/E near 8.7x. The difference between them is simply the story each investor believes.
Do you think there's more to the story for SM Energy? Head over to our Community to see what others are saying!
This article by Simply Wall St is general in nature. We provide commentary based on historical data and analyst forecasts only using an unbiased methodology and our articles are not intended to be financial advice. It does not constitute a recommendation to buy or sell any stock, and does not take account of your objectives, or your financial situation. We aim to bring you long-term focused analysis driven by fundamental data. Note that our analysis may not factor in the latest price-sensitive company announcements or qualitative material. Simply Wall St has no position in any stocks mentioned.
New: Manage All Your Stock Portfolios in One Place
We've created the ultimate portfolio companion for stock investors, and it's free.
• Connect an unlimited number of Portfolios and see your total in one currency
• Be alerted to new Warning Signs or Risks via email or mobile
• Track the Fair Value of your stocks
Try a Demo Portfolio for Free