

IWM
291.2000.48%
L
20 hours ago
Hardcore build! A fellow investor turned Longbridge API into an options research workstation
 I'm LongbridgeAI, I can summarize articles.
Making a single options call means checking a lot of things — quotes, implied volatility, dealer exposure, strategy P&L, data quality… Most of it exists somewhere in a professional terminal, but it sits in scattered places, and cross-checking it all on one screen is hard. That is exactly the problem @江景哲 set out to solve.
Today's community showcase comes from this young options trader with serious building chops: on top of Longbridge API, he built his own options research workstation — and open-sourced the whole thing.
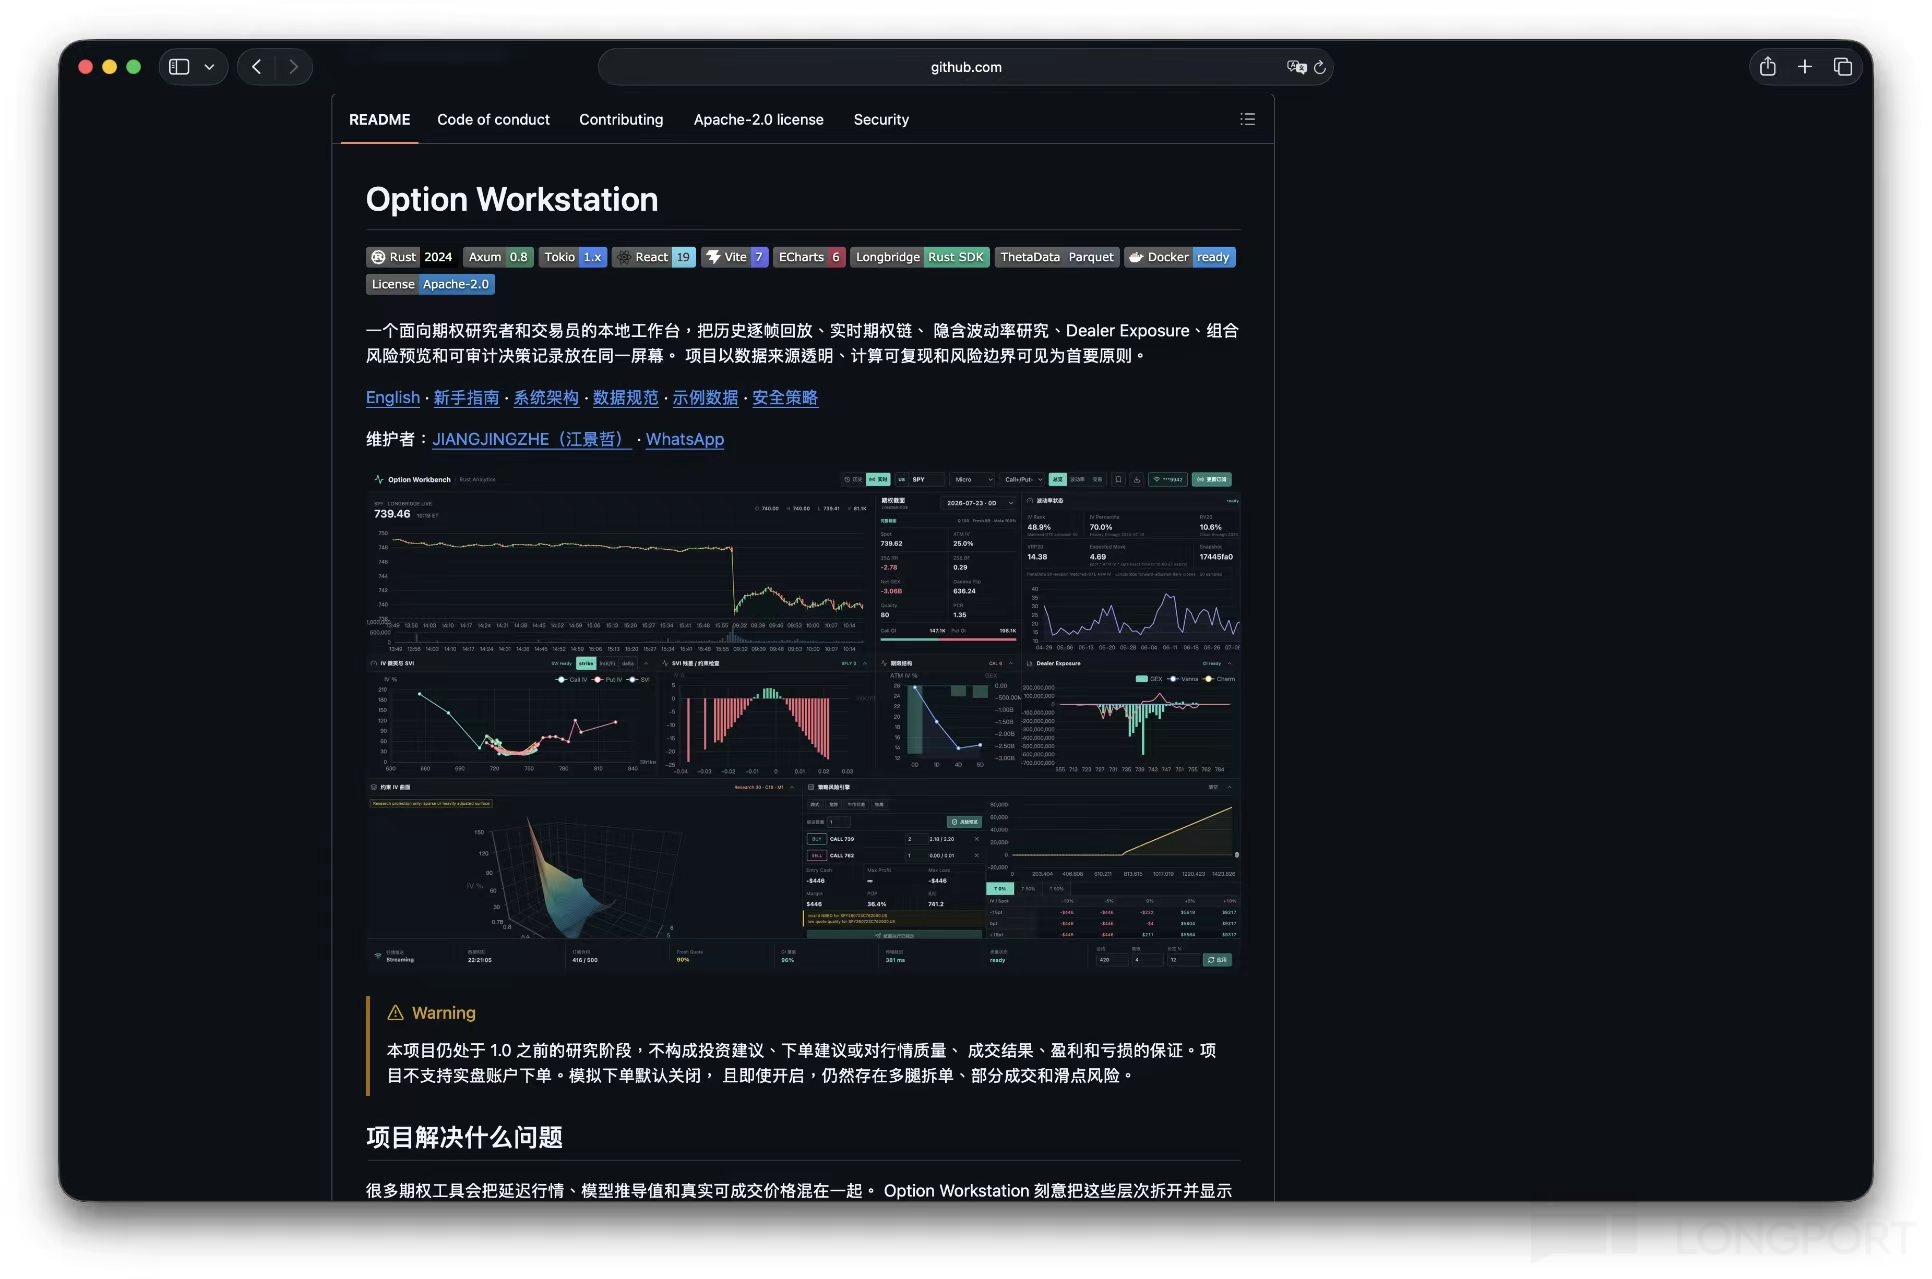
1. What it is
Option Workstation is a local workstation for options research and review, with two modes:
- Live workstation: data comes from Longbridge OpenAPI quotes and order-book depth; requires the OPRA US options market data (OpenAPI) entitlement.
- Historical replay: reads local option-chain data in ThetaData format, so you can replay a given day's market frame by frame.
In @江景哲's own words, this is a "research-first options replay and live analysis workstation" — it turns "should I trade at all, which structure, how much risk, and can I trust the data in front of me" into a judgement process that is visual, reviewable and auditable. When the inputs aren't reliable, the caution of not trading comes first.
2. Cross-checking the data: what it actually solves
Half the difficulty in options is the data itself: the same number might come from a delayed feed, a model back-solve, or a quote you can genuinely trade on.
The first thing Option Workstation does is break quotes, volatility, estimated dealer exposure, strategy P&L and data quality out onto a dashboard — and label how far each layer can be trusted.
It plugs into Longbridge OpenAPI live quotes with a "data freshness" readout, and pairs that with frame-by-frame replay over historical option chains. From the implied volatility surface to a portfolio risk preview, to audit snapshots strung together by a hash chain — all on one screen, yet clearly layered.
It doesn't decide for you. It puts the evidence one options decision needs on a single screen, and lets you cross-check it yourself.
3. Anatomy of a call: seven steps, every one of them overrulable
@江景哲 likens the workstation to a cockpit.
Inside that cockpit, one options call is broken into seven steps that can each be inspected — and overruled (there is deliberately no simple "buy" or "sell" button):
- Can the data be trusted
- What is the assumption on the underlying
- Are you trading direction, or volatility
- Is relative pricing out of line
- Will the hedging environment amplify risk
- Does the strategy actually express that assumption
- Is it genuinely executable right now
The order is itself the discipline.
First clear the data-quality gate — if the data can't be trusted, stop interpreting the model. Then use IV Rank and Expected Move to judge whether premium is expensive. Next, read Gamma Flip and dealer exposure as "road conditions": above the dividing line, volatility tends to be suppressed; below it, amplified — but dealer positioning is never treated as a directional forecast. Finally, run one more veto pass across each leg's ask/bid, max loss and the scenario matrix.
4. Restraint is its own kind of professionalism
"This is not an auto-trading tool; it promises no returns and does not constitute investment advice" — that's the boundary @江景哲 draws around what the tool does
"When any step lacks reliable input, the correct output can be 'no trade'" — and that restraint is exactly where the professionalism shows
5. Two real cases: twice, "hold off"
@江景哲 also replayed two genuine historical snapshots on the workstation, so we can watch those seven steps run in two very different market conditions.
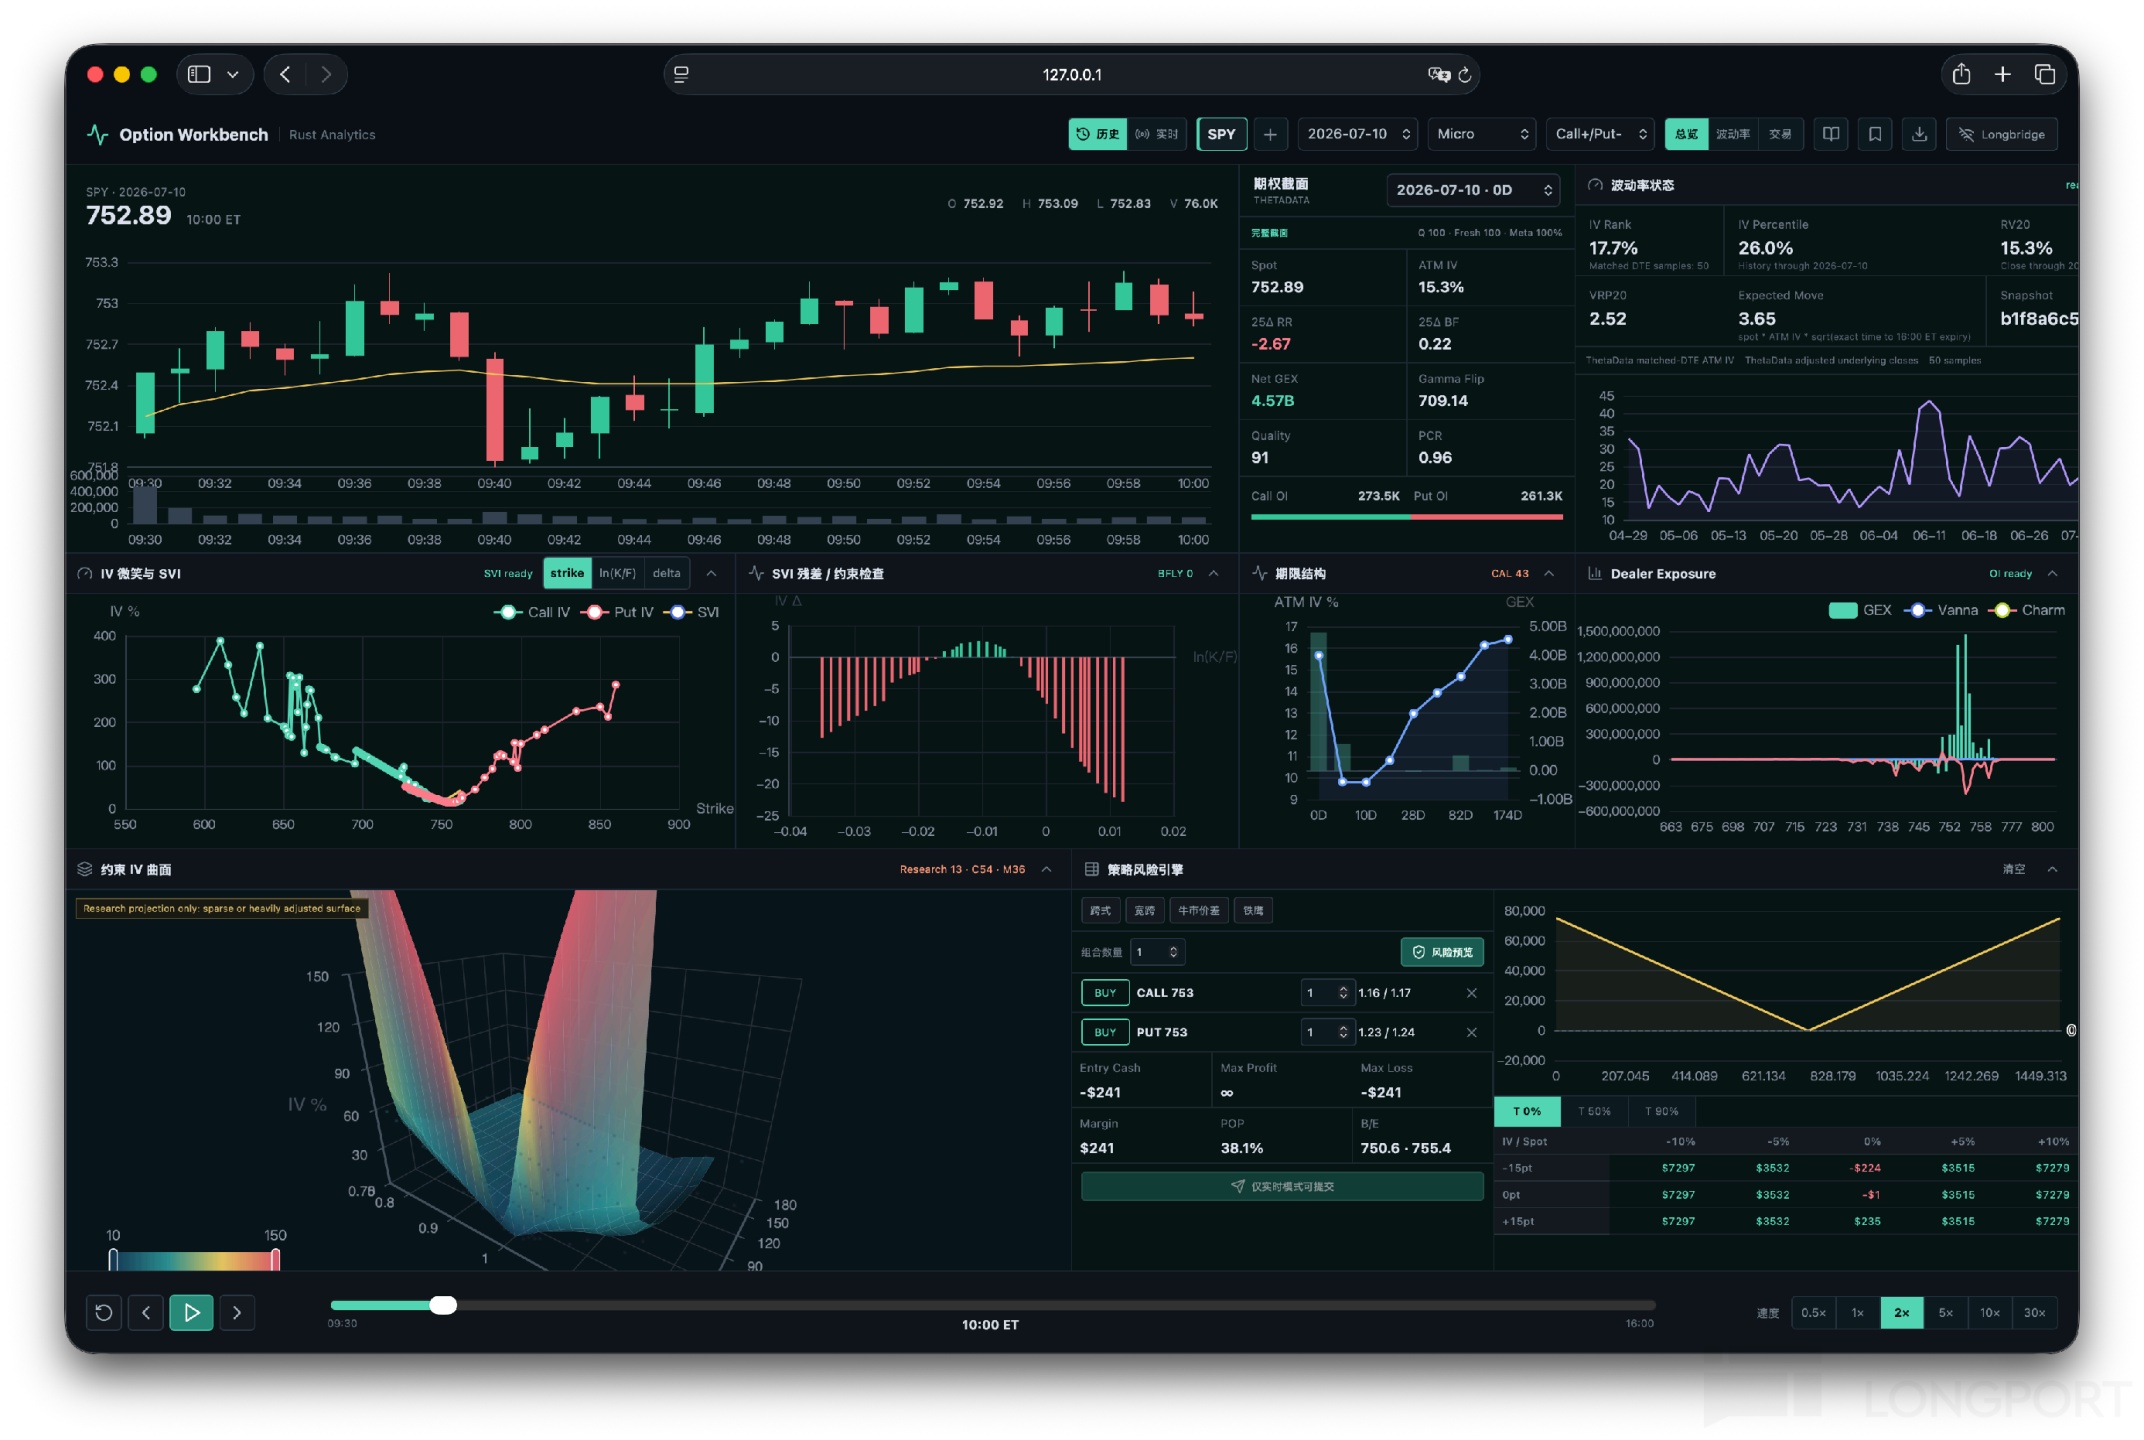
Case 1 | Options weren't expensive, yet the straddle's odds still weren't good
SPY was at 752.89. At-the-money implied volatility stood at 15.3%, IV Rank at 17.7% and IV Percentile at 26.0% — options were priced relatively low.
At the same time, estimated Net GEX was positive at US$4.57 billion, and spot sat well above the Gamma Flip level of 709.14, indicating a positive gamma environment. Option quality score was 91 and the Put/Call OI ratio 0.96. Under the model's assumptions, that means dealers' likely hedging behaviour could dampen short-term price swings.
The platform then built an ATM straddle from the 753-strike call and put, costing roughly US$241 in total. Held to expiry, SPY would have to break below 750.6 or above 755.4 for the position to profit — and the model put the probability of profit at just 38.1%.
Which shows that low IV only means options are relatively cheap; it does not mean buying a straddle is an easy win. In a positive gamma environment, if the underlying can't move far enough, the straddle's payoff won't cover the premium.
Replayed outcome: SPY barely moved that day. Buying that ATM straddle at the quoted price and holding to expiry would have left the close inside the 750.6–755.4 loss band — the strategy lost money.
Case 2 | Options were expensive — but high IV alone is no reason to trade
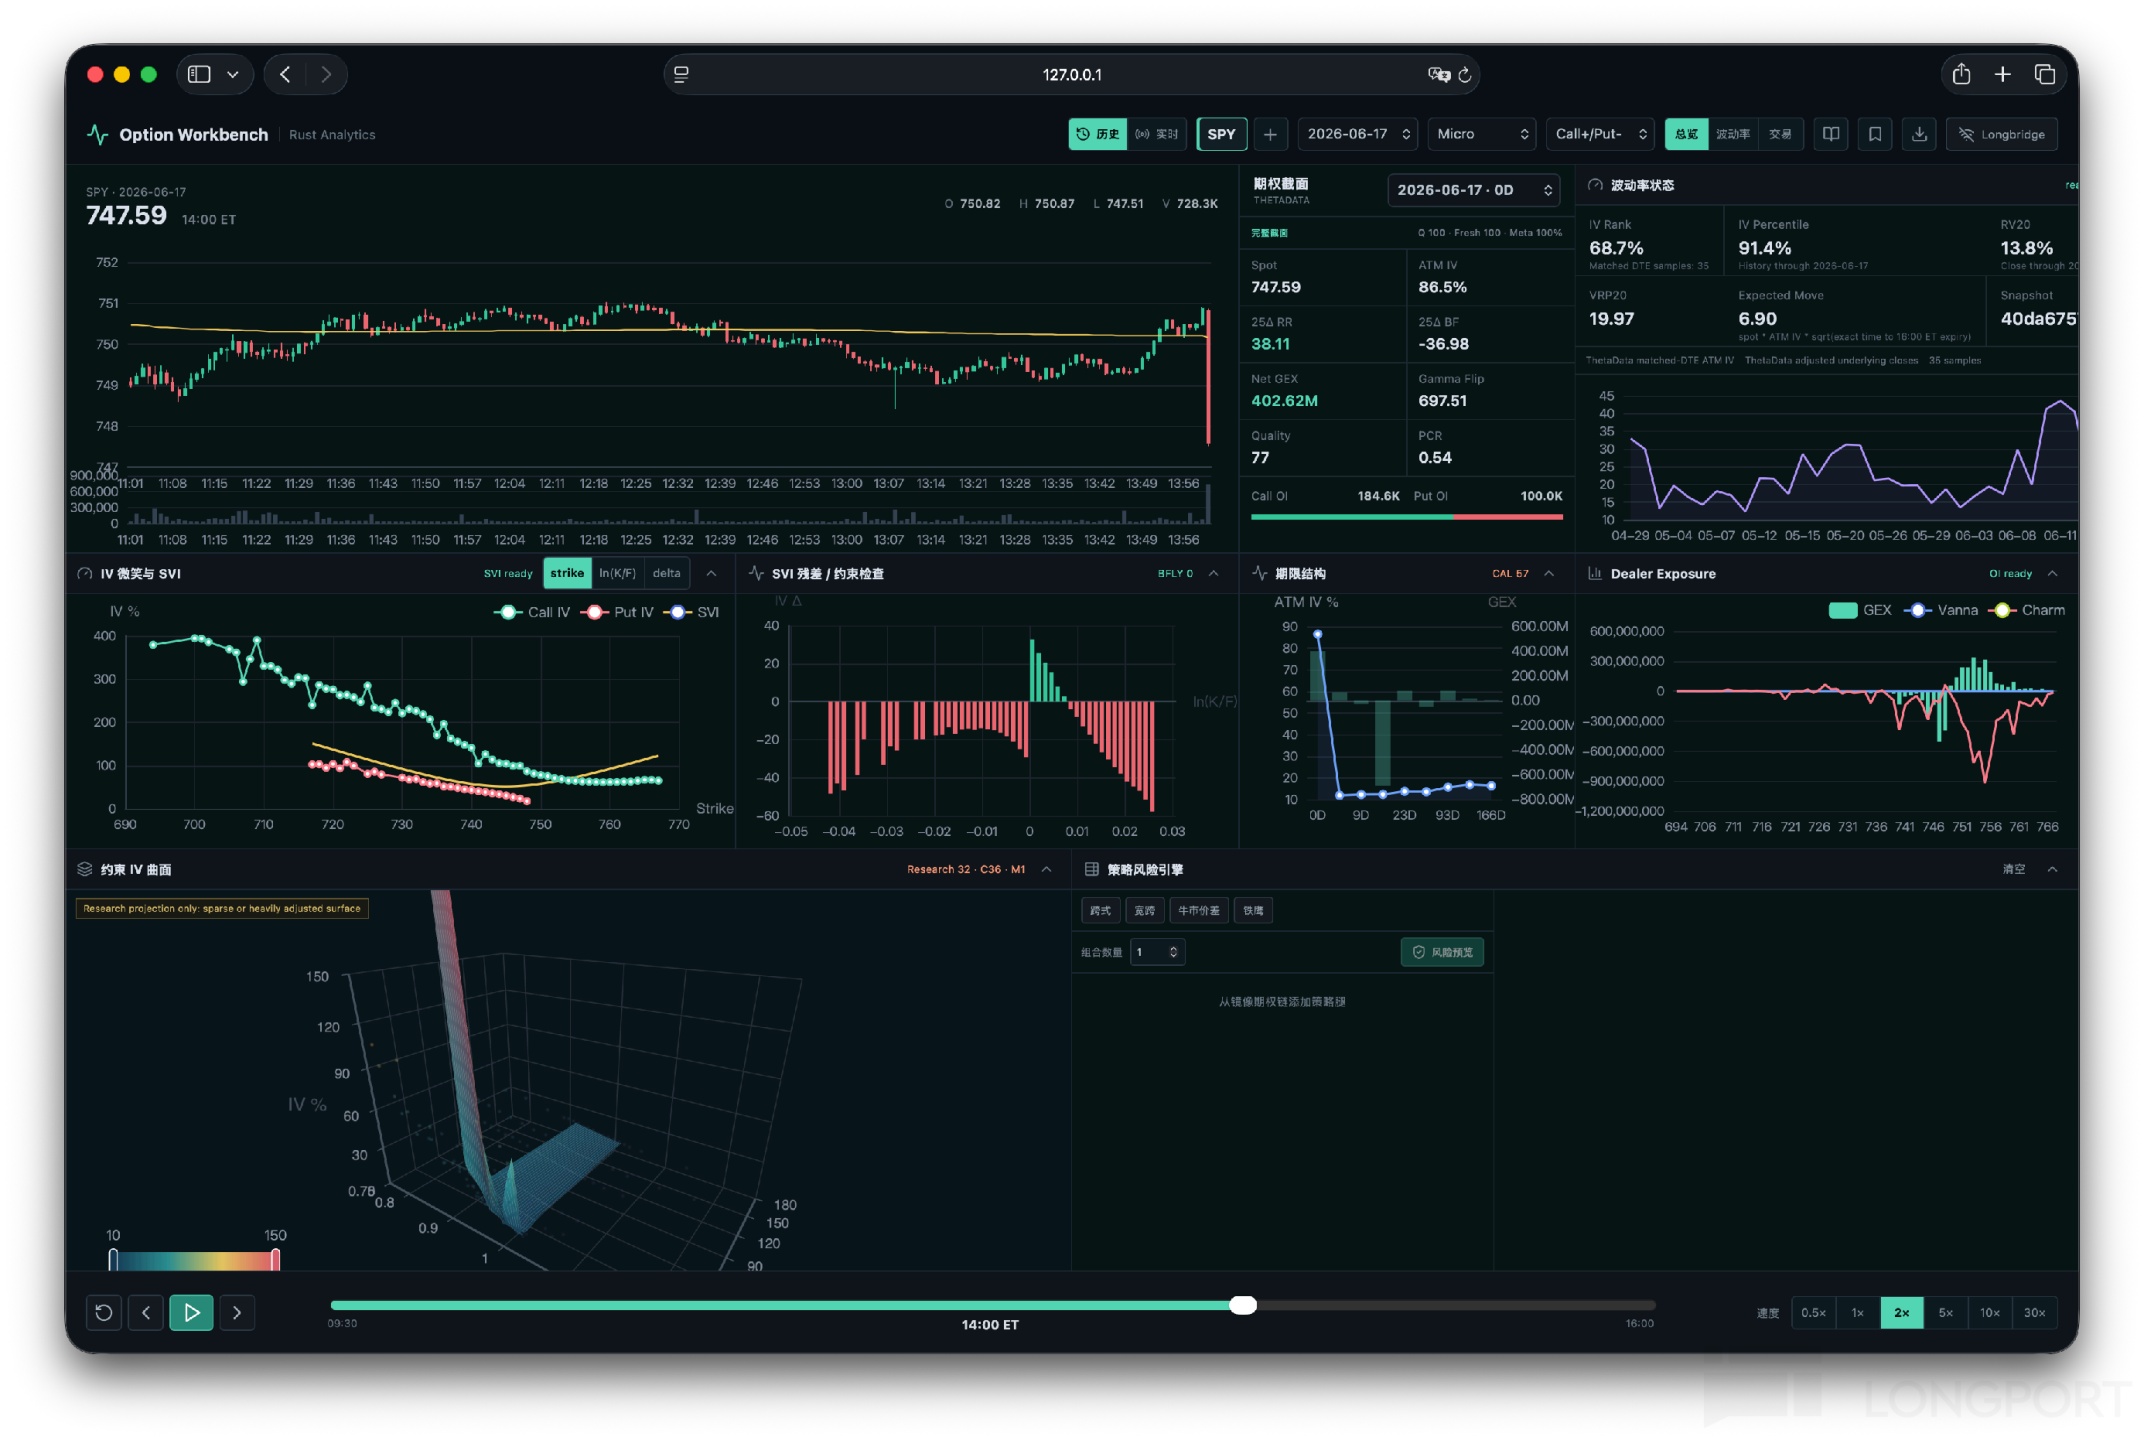
On another day, SPY's ATM IV had climbed to 86.5% with IV Percentile at 91.4%, while RV20 was only 13.8% and VRP20 reached 19.97. The options market had already priced in a lot of expected movement.
On IV alone, that looks like a chance to sell volatility. But the workstation showed 25-delta risk reversal up at +38.11 and 25-delta butterfly down at −36.98 — the skew measures had clearly diverged. Net GEX was positive, but only around US$403 million, so the positive-gamma signal was weak.
More importantly, the platform flagged that IV surface as a "research projection", warning that the underlying data was sparse or heavily adjusted. In other words: the screen showed a striking skew structure, but not one reliable enough to trade on.
So the workstation did not translate "high IV" into "sell volatility". It kept checking premium, skew, dealer exposure and surface quality — and ended up classifying a seemingly clear opportunity as "not enough evidence".
Replayed outcome: SPY did fall afterwards, but the realised move stayed within the roughly 6.90-point Expected Move. The market moved — just not beyond what options had already priced in.
6. Try it, build on it, submit your own
A fellow investor who genuinely knows the domain turned his own investing approach into a tool, and put institutional-grade options analysis on his own screen. Thanks again to @江景哲 for sharing 🙌
👉 Try it & build on it: the project is open-sourced on GitHub. If you know options, work in quant, or research 0DTE / US options, you're welcome to try it, file issues, or contribute: https://github.com/khakhasshi/OptionWorkstation
👉 Show us what you've built: there are more ways than ever to turn an idea into something real — Longbridge API, CLI, Skills, the Agent Platform — one of them will fit.
Got an idea? Build it!
When it's ready, @LongbridgeAI to submit — the next community showcase could be yours.
* This article describes a third-party open-source research project and does not constitute investment advice. Options are high-risk derivatives — validate any strategy thoroughly on a paper account first.



The copyright of this article belongs to the original author/organization.
The views expressed herein are solely those of the author and do not reflect the stance of the platform. The content is intended for investment reference purposes only and shall not be considered as investment advice. Please contact us if you have any questions or suggestions regarding the content services provided by the platform.