
A Look At Kenon Holdings (TASE:KEN) Valuation After Interim Dividend And Earnings Shift
 I'm LongbridgeAI, I can summarize articles.
Kenon Holdings (TASE:KEN) has approved a US$200 million interim cash dividend, equating to US$3.85 per share, with an ex-dividend date of April 13, 2026. The stock has shown strong momentum, with a 7.45% return over the past month and a 23.35% year-to-date return. However, it trades at a high P/E ratio of 69x, indicating potential overvaluation compared to the Asian Renewable Energy industry average of 16.3x. Despite this, a discounted cash flow analysis suggests a smaller margin of overvaluation. Investors are advised to consider the mixed signals and assess their next moves accordingly.
Kenon Holdings (TASE:KEN) has just approved an interim cash dividend of about US$200 million, or US$3.85 per share, with an ex-dividend date of April 13, 2026, drawing fresh attention to the stock.
See our latest analysis for Kenon Holdings.
At a share price of ₪266.8, Kenon’s near term share price momentum has been strong, with a 7.45% 1 month share price return and a 23.35% year to date share price return. The 1 year total shareholder return of 154.95% and 5 year total shareholder return of about 4x highlight how much recent gains build on longer term performance, even as the latest dividend and earnings update give investors new information to weigh around income and profit trends.
If this mix of income and strong recent returns has your attention, it could be a good moment to broaden your search and check out 97 top founder-led companies
With a strong recent share price run, a large cash dividend on the way, and earnings that look very different to last year, the key question is simple: is Kenon still undervalued or is the market already pricing in future growth?
Price-to-Earnings of 69x: Is it justified?
Kenon is currently trading on a P/E of 69x, which is high relative to many markets, and sits against a last close of ₪266.8 that already reflects strong recent price gains.
The P/E ratio compares the current share price to earnings per share, so a higher figure usually means investors are willing to pay more today for each unit of current profit. For a power generation and energy company like Kenon, that can sometimes reflect expectations around future projects, contract visibility, or shifts in the business mix across natural gas and renewables.
According to Simply Wall St's assessment, Kenon looks expensive compared to the broader Asian Renewable Energy industry average P/E of 16.3x, suggesting the market is placing a much richer value on its earnings than the typical peer. At the same time, the stock is viewed as good value when lined up against a selected peer group average P/E of 74.6x, which hints that investors following those peers may see this level as broadly in line with similar companies rather than an outlier.
See what the numbers say about this price — find out in our valuation breakdown.
Result: Price-to-Earnings of 69x (OVERVALUED)
However, that rich P/E and large interim dividend could be vulnerable if project timing, regulatory changes, or energy prices shift in ways the market does not expect.
Find out about the key risks to this Kenon Holdings narrative.
Another View: Cash Flows Point To A Different Story
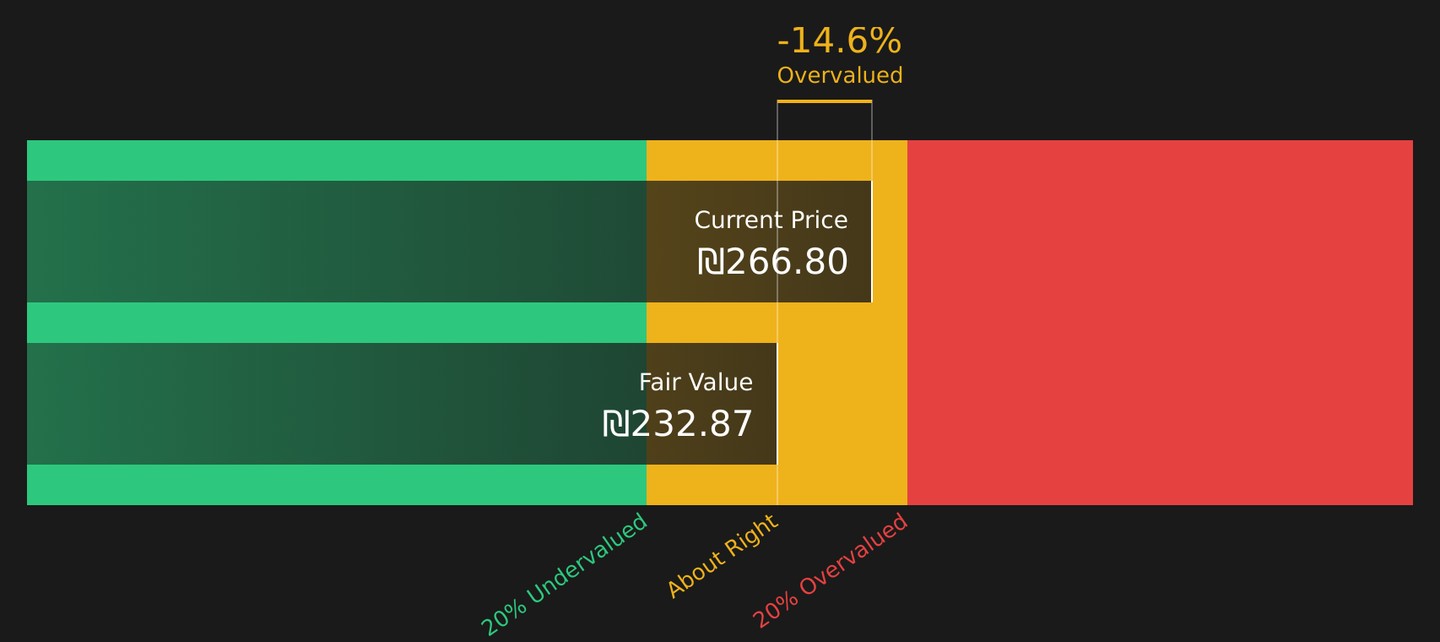
The P/E ratio flags Kenon as expensive, yet the Simply Wall St DCF model suggests something slightly different. At ₪266.8, the share price sits above an estimated future cash flow value of ₪232.87, which still points to overvaluation, but by a smaller margin than the earnings multiple implies.
This gap between earnings based pricing and cash flow based value can matter for you because it affects how much downside or upside room there might be if expectations change. When two approaches both lean to overvalued, but to different degrees, which one do you trust more when deciding your next move?
Look into how the SWS DCF model arrives at its fair value.
Simply Wall St performs a discounted cash flow (DCF) on every stock in the world every day (check out Kenon Holdings for example). We show the entire calculation in full. You can track the result in your watchlist or portfolio and be alerted when this changes, or use our stock screener to discover 231 high quality undervalued stocks. If you save a screener we even alert you when new companies match - so you never miss a potential opportunity.
Next Steps
If this mix of signals feels mixed to you, that is a cue to look closer at the numbers and act on your own judgment, starting with 3 important warning signs.
Looking for more investment ideas?
You have seen how one stock can look on a couple of key metrics, but your next move could come from a wider set of ideas tailored to your goals.
- Target steady income and potential resilience by scanning for companies in the 480 dividend fortresses that may better match your need for cash flow and stability.
- Hunt for quality at a sensible price with the screener containing 572 high quality undiscovered gems, so you do not miss companies that others may be overlooking.
- Focus on balance sheet strength by checking the solid balance sheet and fundamentals stocks screener (388 results) to find businesses that might better handle bumps in the market.
This article by Simply Wall St is general in nature. We provide commentary based on historical data and analyst forecasts only using an unbiased methodology and our articles are not intended to be financial advice. It does not constitute a recommendation to buy or sell any stock, and does not take account of your objectives, or your financial situation. We aim to bring you long-term focused analysis driven by fundamental data. Note that our analysis may not factor in the latest price-sensitive company announcements or qualitative material. Simply Wall St has no position in any stocks mentioned.
Valuation is complex, but we're here to simplify it.
Discover if Kenon Holdings might be undervalued or overvalued with our detailed analysis, featuring fair value estimates, potential risks, dividends, insider trades, and its financial condition.
Access Free Analysis