

Assessing Lonza Group’s Valuation As FDA AI Collaboration Puts Its Drug Development Capabilities In Focus
 I'm LongbridgeAI, I can summarize articles.
Lonza Group (SWX:LONN) has entered a research collaboration with Simulations Plus and the FDA to enhance drug development capabilities. Despite a recent 1.83% share price increase, the company's 90-day return is 12.5%, indicating declining momentum. With a P/E ratio of 37.5x, Lonza appears overvalued compared to its estimated fair P/E of 32.5x and the industry average of 34.2x. However, its earnings growth of 51.2% over the past year suggests some resilience. A discounted cash flow analysis indicates significant valuation risk, with shares trading above an estimated future cash flow value of CHF230.15.
Lonza Group (SWX:LONN) has moved into focus after joining a funded research collaboration with Simulations Plus and the U.S. Food and Drug Administration to build predictive frameworks for amorphous solid dispersion drug products.
See our latest analysis for Lonza Group.
Despite the new FDA-backed collaboration and recent conference appearances, Lonza Group’s 1-day share price return of 1.83% comes against a weaker backdrop. The 90-day share price return of 12.5% and the 1-year total shareholder return of 15.26% suggest momentum has been fading rather than building.
If this kind of pharma and biotech exposure interests you, it could be worth broadening your search using a focused screener to spot other opportunities in healthcare related AI, including 124 healthcare AI stocks
So with Lonza Group’s recent share price softness and ongoing FDA backed research work in AI enabled drug development, are investors looking at an underappreciated pharma services leader, or is the current valuation already reflecting future growth?
Price-to-Earnings of 37.5x: Is it justified?
Lonza Group closed at CHF488.6, and the current P/E of 37.5x sits at the higher end of what investors are paying for life sciences earnings today.
The P/E ratio compares the current share price to earnings per share and gives a quick read on how much the market is paying for current profits. For a contract development and manufacturing organisation serving pharma and biotech clients across biologics, small molecules and specialized modalities, earnings quality and growth expectations often matter more than headline revenue size.
On one hand, Lonza Group looks expensive compared to an estimated fair P/E of 32.5x and the global life sciences industry average of 34.2x. That suggests the share price embeds a richer earnings multiple than both a model based fair ratio and the wider peer set. This is a level the market could move towards if sentiment cools. On the other hand, the P/E of 37.5x is slightly below the peer average of 39.6x in its comparison group, which hints that investors are not paying the absolute top tier multiple for a company with 51.2% earnings growth over the past year and higher current profit margins than last year.
Explore the SWS fair ratio for Lonza Group
Result: Price-to-Earnings of 37.5x (OVERVALUED).
However, the 1 year total shareholder return of 15.26%, alongside recent 7 day and 90 day share price declines, suggests sentiment could sour further if growth stalls or margins tighten.
Find out about the key risks to this Lonza Group narrative.
Another View: Cash Flows Point to a Different Story
While the P/E of 37.5x suggests Lonza Group is only slightly rich compared with peers, the SWS DCF model presents a tougher picture. On this view, the shares at CHF488.6 sit well above an estimated future cash flow value of CHF230.15, which indicates meaningful valuation risk if expectations cool.
Look into how the SWS DCF model arrives at its fair value.
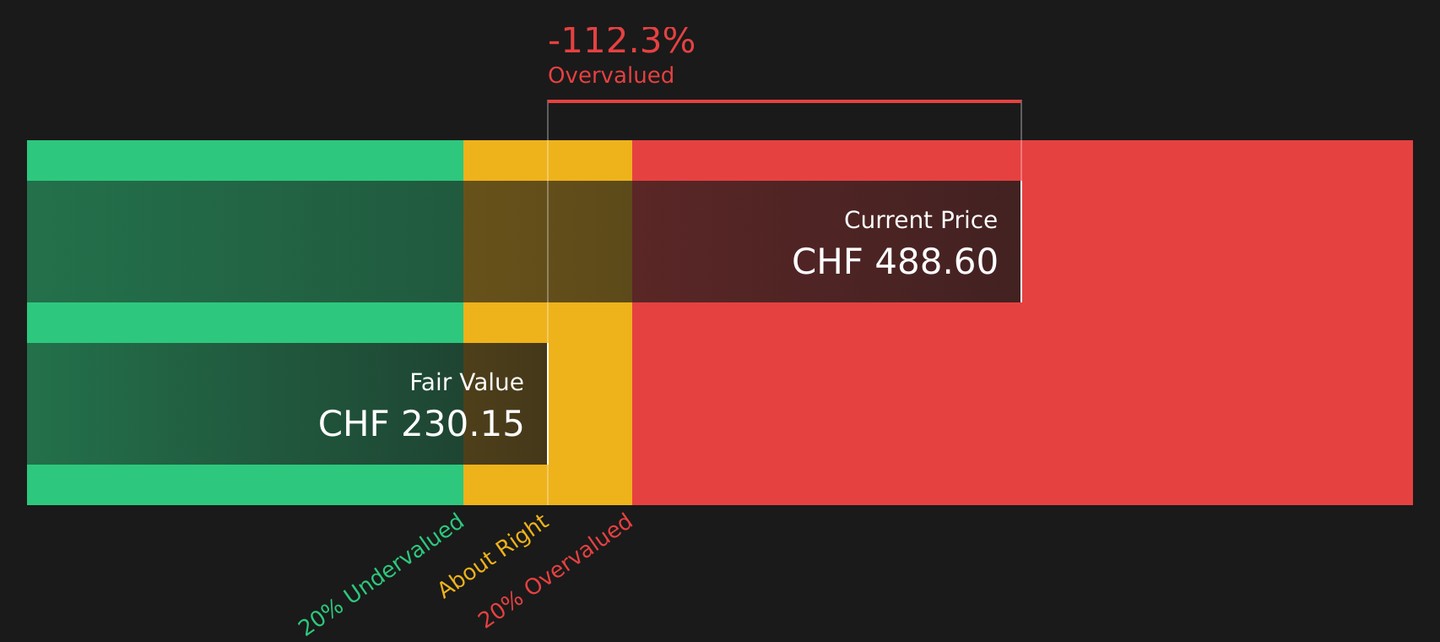
Simply Wall St performs a discounted cash flow (DCF) on every stock in the world every day (check out Lonza Group for example). We show the entire calculation in full. You can track the result in your watchlist or portfolio and be alerted when this changes, or use our stock screener to discover 236 high quality undervalued stocks. If you save a screener we even alert you when new companies match - so you never miss a potential opportunity.
Next Steps
As you read this, consider whether the outlook appears more promising or more cautious. Take a moment to review the numbers and evaluate both perspectives by checking the 3 key rewards and 1 important warning sign
Looking for more investment ideas?
If Lonza Group has you thinking more critically about price, quality and risk, do not stop here. Broaden your watchlist before the next move passes you by.
- Spot potential value gaps early and scan 236 high quality undervalued stocks that currently combine quality fundamentals with comparatively modest pricing.
- Build a steadier income stream and review 470 dividend fortresses that pair higher yields with a focus on resilience.
- Sleep a little easier and check 302 resilient stocks with low risk scores chosen for relatively stronger balance sheets and lower overall risk scores.
This article by Simply Wall St is general in nature. We provide commentary based on historical data and analyst forecasts only using an unbiased methodology and our articles are not intended to be financial advice. It does not constitute a recommendation to buy or sell any stock, and does not take account of your objectives, or your financial situation. We aim to bring you long-term focused analysis driven by fundamental data. Note that our analysis may not factor in the latest price-sensitive company announcements or qualitative material. Simply Wall St has no position in any stocks mentioned.
New: AI Stock Screener & Alerts
Our new AI Stock Screener scans the market every day to uncover opportunities.
• Dividend Powerhouses (3%+ Yield)
• Undervalued Small Caps with Insider Buying
• High growth Tech and AI Companies
Or build your own from over 50 metrics.
Explore Now for Free