

Is It Time To Rethink Equinor (OB:EQNR) After This Year’s 54% Share Price Surge?
 I'm LongbridgeAI, I can summarize articles.
Equinor's share price surged 54% this year, closing at NOK 371.8. Despite a recent 4.9% return over the past week, the stock has declined 11.6% over 30 days. A Discounted Cash Flow analysis suggests the shares are overvalued by 46.2%, with an intrinsic value of US$254.32 per share. Additionally, Equinor's P/E ratio of 19.80x exceeds the industry average of 15.67x, indicating it is trading above its fair value. Investors are encouraged to consider narratives linking future performance to valuation.
- If you are wondering whether Equinor's share price fairly reflects its potential or is giving you a margin of safety, you are in the right place for a clear valuation checkup.
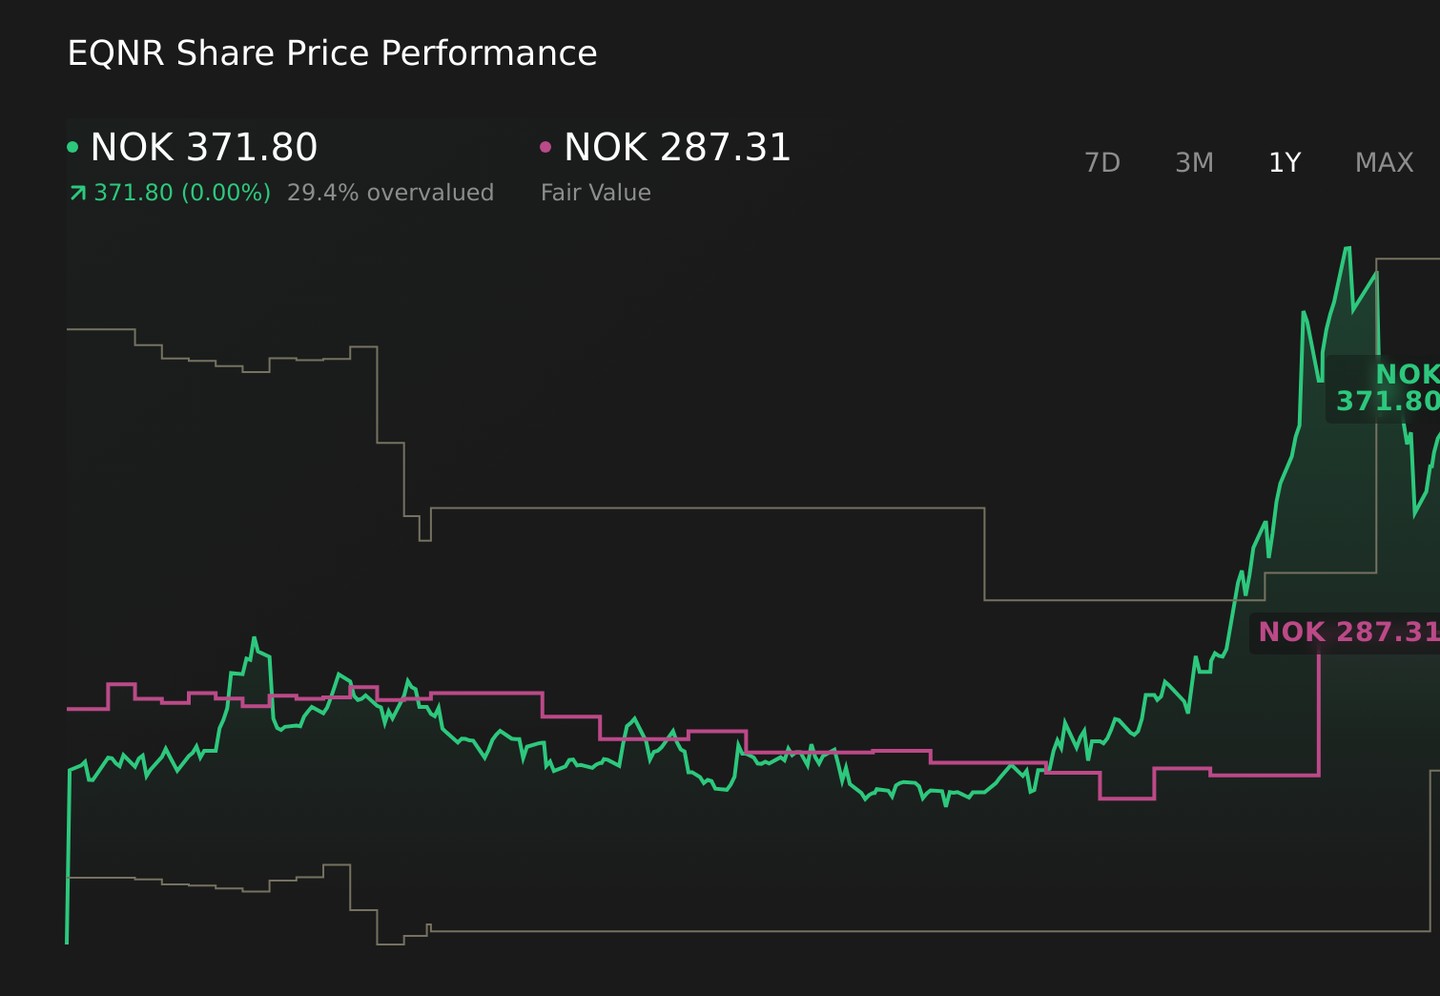
- Equinor's shares last closed at NOK 371.8, with a 4.9% return over the past 7 days, an 11.6% decline over 30 days, and returns of 53.9% year to date and 65.9% over the last year.
- These moves have been set against a steady flow of news around Equinor's role in global energy markets, including its position among major oil and gas producers and its ongoing capital allocation decisions. Taken together, this context can influence how investors weigh both opportunity and risk in the current share price.
- Simply Wall St currently gives Equinor a valuation score of 1 out of 6. The sections that follow will walk through what different valuation approaches suggest about that score, and then finish with a broader way of thinking about Equinor's value that goes beyond the numbers alone.
Equinor scores just 1/6 on our valuation checks. See what other red flags we found in the full valuation breakdown.
Approach 1: Equinor Discounted Cash Flow (DCF) Analysis
A Discounted Cash Flow, or DCF, model projects a company’s future cash flows and then discounts them back to today’s value to estimate what the business could be worth right now.
For Equinor, the model uses a 2 Stage Free Cash Flow to Equity approach based on cash flow projections in US$. The latest twelve month free cash flow is about US$7.64b. Analysts provide explicit estimates for the next few years, and beyond that Simply Wall St extrapolates the trend to build a full 10 year path of cash flows, including a projected free cash flow of US$3.41b in 2030.
Discounting this stream of cash flows back to today results in an estimated intrinsic value of US$254.32 per share. Compared with the current share price of NOK 371.8, the DCF output implies the shares are around 46.2% above this intrinsic value. This suggests Equinor may be trading on the expensive side based on this model alone.
Result: OVERVALUED
Our Discounted Cash Flow (DCF) analysis suggests Equinor may be overvalued by 46.2%. Discover 239 high quality undervalued stocks or create your own screener to find better value opportunities.
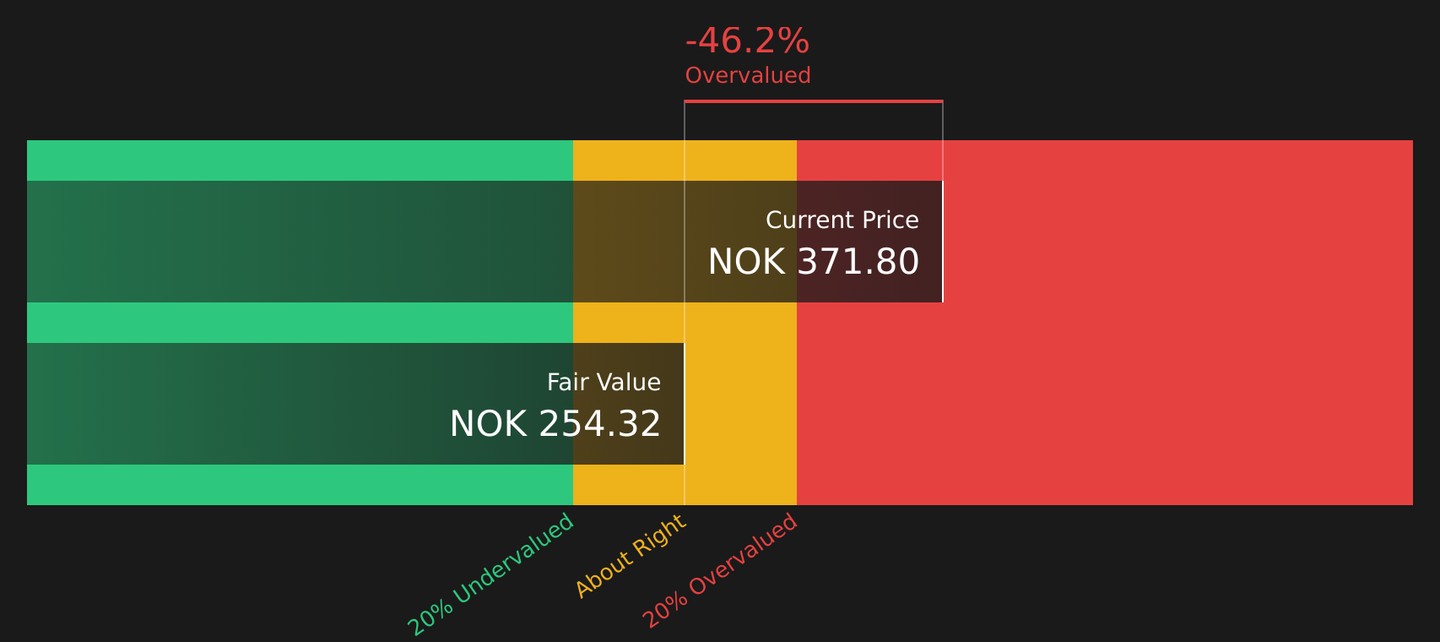
Head to the Valuation section of our Company Report for more details on how we arrive at this Fair Value for Equinor.
Approach 2: Equinor Price vs Earnings
For a profitable company, the P/E ratio is a useful quick check because it links what you pay for each share to the earnings that support that share. It also reflects what the market is willing to pay for those earnings today.
What counts as a “normal” P/E often comes down to expectations and risk. Higher expected growth and lower perceived risk tend to justify a higher P/E, while lower growth and higher risk usually align with a lower P/E.
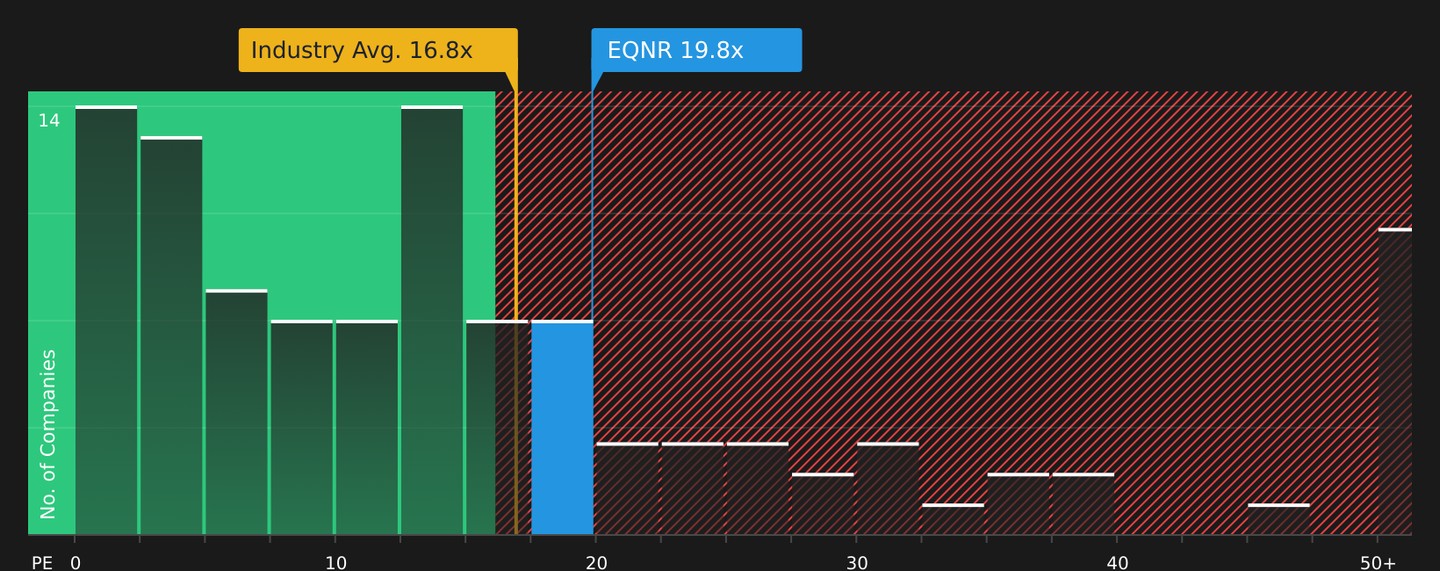
Equinor is currently trading on a P/E of 19.80x. This sits above the Oil and Gas industry average P/E of 15.67x, while the peer group average is much higher at 60.23x. To go a step further, Simply Wall St calculates a proprietary “Fair Ratio” for Equinor of 12.36x. This is the P/E that would be expected given factors such as its earnings profile, industry, profit margins, market cap and risk characteristics.
This Fair Ratio can be more informative than a simple peer or industry comparison because it adjusts for those fundamentals rather than just lining Equinor up against broad groups. Comparing 19.80x with a Fair Ratio of 12.36x points to Equinor trading above that modelled fair level.
Result: OVERVALUED
P/E ratios tell one story, but what if the real opportunity lies elsewhere? Start investing in legacies, not executives. Discover our 96 top founder-led companies.
Upgrade Your Decision Making: Choose your Equinor Narrative
Earlier it was mentioned that there is an even better way to understand valuation. Narratives bring this to life by letting you attach a clear story about Equinor, such as your view on future revenue, earnings and margins, to a financial forecast and then to a Fair Value that you can compare directly with the current share price.
On Simply Wall St's Community page, Narratives are available as an easy tool used by millions of investors. They link your view of Equinor's role in global energy, its oil and gas exposure and its renewables ambitions to specific assumptions like a Fair Value around NOK 239.5 at the bearish end or roughly NOK 416.7 at the bullish end, so you can see how different beliefs map to different outcomes.
Because Narratives update when new news, analyst targets or earnings are added to the platform, you can quickly see when your Fair Value and the current market price start to differ in a way that might prompt you to review whether Equinor still fits your portfolio or whether the story you believe in has shifted.
For Equinor however we will make it really easy for you with previews of two leading Equinor Narratives:
🐂 Equinor Bull Case
Fair value in this bullish narrative: NOK 416.72 per share
Current price vs this fair value: around 10.8% below the narrative fair value based on the last close of NOK 371.8
Revenue growth assumption: 2.62% a year
- Analysts in this camp lean on stronger cash flow support from projects like Johan Sverdrup and Johan Castberg, plus rapid capital shifts into higher return assets in Brazil, the U.S., and selected renewables.
- The narrative expects higher earnings and margin improvement, helped by aggressive natural gas positioning and efficiency gains, while still flagging exposure to oil and gas demand, regulation, and ESG pressures.
- To line up with this view, you would need to be comfortable with higher earnings, a P/E of 11.1x on 2029 earnings and a fair value around NOK 416.72.
🐻 Equinor Bear Case
Fair value in this bearish narrative: NOK 239.50 per share
Current price vs this fair value: around 55.2% above the narrative fair value based on the last close of NOK 371.8
Revenue growth assumption: 2.28% annual decline
- Here the focus sits on faster decarbonization, tighter climate rules, and decommissioning costs, which together could weigh on long term oil and gas revenues and legacy asset values.
- This view also highlights risks around offshore wind and other renewables projects, including impairments, regulatory changes, and cost overruns that could pressure future earnings.
- To agree with this narrative, you would need to assume lower revenue over time, more modest margin improvement, a P/E of 10.1x on 2029 earnings, and a fair value closer to NOK 239.50.
These two Equinor Narratives frame the current share price against very different assumptions about future energy demand, regulation, and project returns. The useful next step is to decide which assumptions feel closer to your own expectations and where your comfort level sits between the bullish and bearish fair value ranges. See what the community is saying about Equinor
Do you think there's more to the story for Equinor? Head over to our Community to see what others are saying!
This article by Simply Wall St is general in nature. We provide commentary based on historical data and analyst forecasts only using an unbiased methodology and our articles are not intended to be financial advice. It does not constitute a recommendation to buy or sell any stock, and does not take account of your objectives, or your financial situation. We aim to bring you long-term focused analysis driven by fundamental data. Note that our analysis may not factor in the latest price-sensitive company announcements or qualitative material. Simply Wall St has no position in any stocks mentioned.
Valuation is complex, but we're here to simplify it.
Discover if Equinor might be undervalued or overvalued with our detailed analysis, featuring fair value estimates, potential risks, dividends, insider trades, and its financial condition.
Access Free Analysis