

iEdge Singapore Next 50 Review: Tech Tilt & Rebalance Highlights
 I'm LongbridgeAI, I can summarize articles.
The June 2026 review of the iEdge Singapore Next 50 Index added AEM, Top Glove, UI Boustead REIT, and PC Partner, while omitting Singapore Post, Digital Core REIT, Wee Hur, and China Sunsine Chemical. The liquidity-weighted framework significantly increased technology exposure to 26.2%, up from 15.8% in the standard index, reflecting strong trading activity in sectors like semiconductors and hardware distribution.
- The June 2026 review of the iEdge Singapore Next 50 Index (Next 50) added and removed four constituents. The four inclusions reflect strong market activity and positioning across global supply chains, spanning semiconductor test, healthcare exports, industrial logistics and high‑end hardware distribution.
- Inclusions include AEM, Top Glove, UI Boustead REIT, and PC Partner. The four omissions, Singapore Post, Digital Core REIT, Wee Hur and China Sunsine Chemical, remained eligible for index inclusion, but were displaced by the higher market capitalisation constituents.
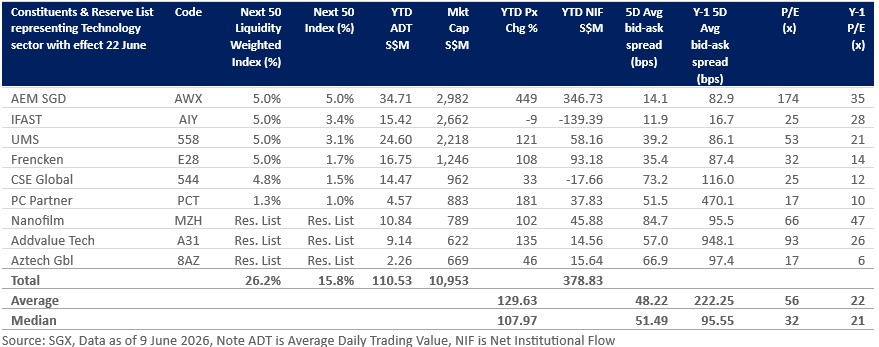
- Technology is the clear beneficiary of the liquidity‑weighted framework, with its combined weight rising to 26.2% from 15.8% in the standard index, alongside tighter bid‑ask spreads, and stronger representation across both the largest weights and the reserve list.
The iEdge Singapore Next 50 Index (Next 50) and the iEdge Singapore Next 50 Liquidity Weighted Index (Next 50 LW) represents the performance of50 of the next largest and most traded stocks listed on SGX Mainboard beyond the top 30 by market capitalisation.
The June 2026 review of these Indices added and omitted four constituents, with changes effective from 22 June. Beyond the 50 constituents, the eligible universe expanded to 91 stocks from 87 at the March review, with the final constituents selected by largest market capitalisation.
Effective 22 June, recent debutant UI Boustead REIT will join four other stocks of the Next 50 that have been listed over the past year, Yangzijiang Maritime Development, Centurion Accommodation REIT, NTT DC REIT, and UltraGreen.ai. The remaining 45 constituents have seen their combined average daily trade value in the 2026 year to June 9 increase to S$298 million, from S$121 million for the same period in 2025.
Liquidity Tilt Amplifies Technology Exposure, Reshapes Sector Mix in iEdge Next 50
The Next 50 is presented through two parallel index frameworks that track the same 50 constituents but offer different lenses on market exposure. The standard index reflects free‑float market capitalisation, while the liquidity‑weighted version, the Next 50 LW, repositions weights toward actively traded names based on six‑month median daily traded value, with both subject to a 5% cap per stock at rebalances.
The rebalanced indices, based on indicative weights as of 29 May, shows technology as the clear beneficiary of the liquidity‑weighted framework, with its combined weight in the Next 50 LW rising to 26.2% from 15.8% in the Next 50, reflecting stronger trading intensity across hardware and fintech/platform names. This is largely offset by a reduction in income‑oriented segments, led by S-REITs at 29.7% versus 35.9%, alongside declines in telecommunications and utilities, which fall to 2.9% and 1.9% from 6.0% and 4.5%, respectively.
If the technology sector sustains its early year momentum, its influence within the index could surpass S-REITs, marking a shift from income‑led exposure toward more growth and global flow‑driven sectors.
As many as five of the seven largest weights of May 29 also represent the technology sector: AEM Holdings, iFAST Corporation, UMS Integration, Frencken Group and CSE Global. Note this is based on sector weights using SGX classifications, rather than the RBICS framework used in the standard iEdge methodology.
The Next 50 Reserve List reinforces this trend, with three of its ten stocks, Nanofilm Technologies International, Addvalue Technologies and Aztech Global, representing the technology sector. Together all seven stocks have seen significant tightening of their 5-day average bid-offer spreads compared to this time last year.
New Entrants to iEdge Singapore Next 50 Index
The Next 50 will include AEM Holdings, Top Glove Corporation Bhd, UI Boustead REIT and PC Partner Group following the June 2026 quarterly review, with these changes taking effect from the open on 22 June. The four omissions, Singapore Post, Digital Core REIT, Wee Hur Holdings and China Sunsine Chemical Holdings, remained eligible for index inclusion but were displaced by the higher market capitalisation constituents.
All four inclusions are supported by strong trading activity, reflecting positioning across global and regional supply chains, from semiconductor test demand to healthcare exports and high‑end hardware distribution. Their operating drivers are distinct, with AEM driven by AI‑led test demand, Top Glove by volume and utilisation recovery, UI Boustead REIT by occupancy and sponsor‑backed growth, and PC Partner by pricing power from constrained high‑end GPU supply and a premium product mix:
- AEM is a Singapore‑listed provider of semiconductor test and handling solutions, specialising in system‑level test for advanced chips. Its 2026 (to June 9) ADT is S$34.7 million, up 8.6‑fold from S$4.05 million over the same period in 2025. For its 1QFY26 update, released mid‑May 2026, AEM reported revenue of S$116.9 million, up 36 per cent from 1QFY25, with profit before tax of S$17.8 million and margin expansion to 15.2 per cent, supported by continued demand from its AI/HPC customer and improving PC‑related segments. Management raised FY26 revenue guidance to S$550 million to S$600 million. On 19 May, Bank of America Corporation disclosed that it increased its deemed interest in AEM Holdings from 4.73% to 5.31% following a change on 15 May, reflecting positioning through its prime brokerage operations. DBS maintains a buy call with a S$11.80 target price, citing an earnings beat and higher structural test demand.
- Top Glove is the world’s largest manufacturer of disposable rubber gloves, with global production and distribution. Its 2026 (to June 9) ADT is S$2.05 million, up 74.4 per cent from S$1.18 million over the same period in 2025. For its 2QFY26 financial report, released on 18 March, Top Glove reported revenue of RM1,005 million, up 14 per cent from 2QFY25, while profit before tax was RM38 million, reflecting continued margin pressure despite higher sales volumes and improved utilisation. Malaysia broker commentary in March 2026 highlighted that recovery is driven by volume normalisation and utilisation gains, although profitability remains below pre‑pandemic levels due to pricing competition and cost pressures.
- UI Boustead REIT is a Singapore‑listed industrial and logistics REIT with assets across Singapore and Japan. On 5 June, Amova Asset Management Asia disclosed that it increased its deemed interest to 6.38 per cent following acquisitions, including 6,684,900 units for about S$5.37 million at S$0.80 per unit on 28 May, alongside leasing updates in May that showed improved occupancy supported by new and renewed leases. Broker coverage from DBS, UOB Kay Hian and Maybank Securities highlights improving occupancy, stable income visibility, and a sponsor‑backed pipeline, with the Seletar Aerospace Park development providing additional long‑term income support.
- PC Partner is a Hong Kong‑listed manufacturer and distributor of graphics cards and PC hardware, including NVIDIA AIB products and its own brands. Its 2026 (to June 9) ADT is S$4.6 million, up 35‑fold from S$0.13 million over the same period in 2025. For its FY25 results, released in March 2026, PC Partner reported revenue of HK$13.95 billion, up 38.4 per cent from FY24, driven by strong growth in graphics card sales and its own‑brand segment. KGI Securities maintain that growth into FY26 is expected to be supported by higher average selling prices and a shift towards premium products amid tight supply of high‑end GPUs, with broker coverage highlighting pricing discipline and product mix as key supports for margins.
Note that Top Glove is also expected to report its 3QFY26 financials around the week of its Next 50 Index inclusion. Ahead of the results, its Management remains confident in long-term global demand recovery; they aim to mitigate raw material supply chain and logistics disruptions stemming from the Middle East conflict by relying on a diversified supplier base, keeping inventory buffers, and leveraging their unique production line flexibility to smoothly switch manufacturing between nitrile and natural rubber gloves.
The 50 constituents and indicative weights as of 29 May are tabled below.
| Index Constituents with effect 22 June | Code | Next 50 Liquidity Weighted Index (%) | Next 50 Index (%) | YTD ADT S$M | Mkt Cap S$M | YTD Px Chg % | YTD NIF S$M | Sector |
| Keppel Reit | K71U | 5.0% | 5.0% | 16.83 | 4,168 | -13 | -132.32 | REITs |
| AEM SGD | AWX | 5.0% | 5.0% | 34.71 | 2,982 | 449 | 346.73 | Technology (Hardware/ Software) |
| ComfortDelGro | C52 | 5.0% | 4.8% | 15.96 | 2,793 | -13 | -44.28 | Industrials |
| IFAST | AIY | 5.0% | 3.4% | 15.42 | 2,662 | -9 | -139.39 | Technology (Hardware/ Software) |
| UMS | 558 | 5.0% | 3.1% | 24.60 | 2,218 | 121 | 58.16 | Technology (Hardware/ Software) |
| Frencken | E28 | 5.0% | 1.7% | 16.75 | 1,246 | 108 | 93.18 | Technology (Hardware/ Software) |
| CSE Global | 544 | 4.8% | 1.5% | 14.47 | 962 | 33 | -17.66 | Technology (Hardware/ Software) |
| Suntec Reit | T82U | 4.8% | 5.0% | 17.04 | 4,255 | -1 | 14.16 | REITs |
| Sheng Siong | OV8 | 4.1% | 3.6% | 10.55 | 4,565 | 17 | 0.94 | Consumer Non-Cyclicals |
| Lendlease Reit | JYEU | 3.9% | 2.5% | 10.03 | 1,853 | -10 | -48.23 | REITs |
| First Resources | EB5 | 2.9% | 1.5% | 8.95 | 4,103 | 24 | 1.85 | Consumer Non-Cyclicals |
| YZJ Fin Hldg | YF8 | 2.8% | 0.8% | 5.23 | 800 | -44 | -104.09 | Financial Services |
| UI BOUSTEAD REIT | UIBU | 2.6% | 1.4% | 9.43 | 1,064 | N/A | -56.33 | REITs |
| YZJ Maritime | 8YZ | 2.5% | 1.3% | 5.88 | 2,074 | -2 | -29.94 | Financial Services |
| Haw Par | H02 | 2.4% | 3.6% | 7.29 | 3,368 | -1 | -2.10 | Healthcare |
| CapLand Ascott T | HMN | 2.4% | 4.2% | 5.94 | 3,424 | -7 | -36.95 | REITs |
| NetLink NBN Tr | CJLU | 2.3% | 5.0% | 5.94 | 3,834 | 3 | 12.52 | Telecommunications |
| Golden Agri-Res | E5H | 2.2% | 3.1% | 6.45 | 3,466 | -5 | 23.16 | Consumer Non-Cyclicals |
| Hong Leong Asia | H22 | 2.1% | 1.0% | 5.75 | 2,408 | 26 | 1.24 | Industrials |
| Kep Infra Tr | A7RU | 1.9% | 4.5% | 6.12 | 3,131 | 5 | 12.58 | Utilities |
| Cent Accom REIT | 8C8U | 1.9% | 1.8% | 5.38 | 1,878 | -2 | 3.46 | REITs |
| NTT DC REIT USD | NTDU | 1.8% | 1.7% | 4.46 | 1,278 | -4 | -7.53 | REITs |
| ULTRAGREEN AI USD | ULG | 1.8% | 0.7% | 4.17 | 1,532 | -5 | -41.45 | Healthcare |
| ParkwayLife Reit | C2PU | 1.8% | 3.0% | 4.49 | 2,562 | -4 | -59.21 | REITs |
| Food Empire | F03 | 1.6% | 1.0% | 4.45 | 1,548 | 19 | 22.83 | Consumer Non-Cyclicals |
| Olam Group | VC2 | 1.6% | 3.0% | 7.60 | 4,644 | 28 | -18.09 | Consumer Non-Cyclicals |
| CapLand India T | CY6U | 1.5% | 1.8% | 5.64 | 1,479 | -17 | -39.00 | REITs |
| PC Partner | PCT | 1.3% | 1.0% | 4.57 | 883 | 181 | 37.83 | Technology (Hardware/ Software) |
| UOB Kay Hian | U10 | 1.3% | 1.7% | 4.43 | 3,657 | 42 | 97.49 | Financial Services |
| SIA Engineering | S59 | 1.2% | 1.4% | 2.94 | 3,548 | -11 | -35.37 | Industrials |
| AIMS APAC Reit | O5RU | 1.1% | 1.5% | 2.80 | 1,279 | 4 | 15.47 | REITs |
| PropNex | OYY | 1.1% | 0.5% | 3.03 | 1,308 | -6 | -23.64 | Real Estate (excl. REITs) |
| China Aviation | G92 | 1.1% | 0.8% | 3.47 | 1,576 | 10 | 31.73 | Industrials |
| ESR REIT | 9A4U | 1.1% | 2.6% | 2.66 | 1,897 | -13 | -13.30 | REITs |
| Riverstone | AP4 | 1.0% | 0.8% | 3.43 | 1,247 | 4 | -0.02 | Healthcare |
| Yanlord Land | Z25 | 0.9% | 0.7% | 2.75 | 1,267 | -8 | -5.24 | Real Estate (excl. REITs) |
| Boustead | F9D | 0.7% | 1.0% | 1.99 | 1,038 | 14 | 27.97 | Industrials |
| Centurion | OU8 | 0.7% | 1.0% | 1.97 | 1,193 | 12 | -1.84 | Real Estate (excl. REITs) |
| Raffles Medical | BSL | 0.6% | 1.2% | 1.62 | 1,751 | -9 | -11.67 | Healthcare |
| Top Glove | BVA | 0.6% | 2.2% | 2.05 | 2,222 | 27 | 10.92 | Healthcare |
| StarHub | CC3 | 0.6% | 1.0% | 2.00 | 1,747 | -9 | -22.32 | Telecommunications |
| CapLand China T | AU8U | 0.6% | 1.3% | 1.44 | 1,123 | -17 | -14.19 | REITs |
| CDL HTrust | J85 | 0.5% | 1.1% | 1.13 | 985 | -8 | -0.69 | REITs |
| StarhillGbl Reit | P40U | 0.4% | 1.3% | 0.92 | 1,240 | -9 | -4.38 | REITs |
| GuocoLand | F17 | 0.3% | 1.1% | 1.09 | 2,577 | 1 | 10.21 | Real Estate (excl. REITs) |
| Sasseur Reit | CRPU | 0.3% | 0.6% | 0.80 | 840 | -1 | -15.00 | REITs |
| Pan United | P52 | 0.3% | 0.6% | 0.89 | 1,038 | 27 | 12.17 | Materials & Resources |
| Far East HTrust | Q5T | 0.2% | 1.0% | 0.64 | 1,172 | -8 | -6.92 | REITs |
| ValueMax | T6I | 0.2% | 0.2% | 0.99 | 894 | -4 | 37.84 | Consumer Cyclicals |
| BRC Asia | BEC | 0.2% | 0.3% | 0.40 | 1,221 | 8 | 0.86 | Industrials |
Source: SGX, Data as of 9 June 2026, Note ADT is Average Daily Trading Value, NIF is Net Institutional Flow.
The 10 constituents of the Next 50 Reserve List as of 29 May are tabled below.
| Stock | Code | YTD ADT S$M | Mkt Cap S$M | YTD Px Chg % | YTD NIF S$M | Sector |
| Nanofilm | MZH | 10.84 | 789 | 102 | 45.88 | Technology (Hardware/ Software) |
| Hong Fok | H30 | 0.80 | 809 | 12 | 12.11 | Real Estate (excl. REITs) |
| Oiltek | HQU | 2.83 | 741 | 149 | 17.36 | Industrials |
| Aspial Lifestyle | 5UF | 1.23 | 721 | 68 | 0.71 | Consumer Cyclicals |
| Addvalue Tech | A31 | 9.14 | 622 | 135 | 14.56 | Technology (Hardware/ Software) |
| Aztech Gbl | 8AZ | 2.26 | 669 | 46 | 15.64 | Technology (Hardware/ Software) |
| MarcoPolo Marine | 5LY | 6.48 | 579 | -14 | -14.87 | Industrials |
| Q&M Dental | QC7 | 0.83 | 564 | 5 | -0.12 | Healthcare |
| Delfi | P34 | 1.57 | 559 | 13 | 3.42 | Consumer Non-Cyclicals |
| SamuderaShipping | S56 | 1.09 | 515 | -16 | -0.95 | Industrials |
Source: SGX, Data as of 9 June 2026, Note ADT is Average Daily Trading Value, NIF is Net Institutional Flow.
Enjoying this read?
- Subscribe now to our SGX My Gateway newsletter for a compilation of latest market news, sector performances, new product release updates, and research reports on SGX-listed companies.
- Visit SGX Data Desk for direct access to SGX analytics and historical market data.