

SD Crosses Critical Technical Indicator
 I'm LongbridgeAI, I can summarize articles.
Shares of SandRidge Energy Inc (SD) have entered oversold territory with an RSI of 29.7, indicating potential buying opportunities as heavy selling may be exhausting. The stock is currently trading at $14.35, down 4.1% for the day, with a 52-week range of $9.07 to $18.45. In comparison, the average RSI for energy stocks is 46.9. Investors may consider this a signal to look for entry points.
In trading on Friday, shares of SandRidge Energy Inc (Symbol: SD) entered into oversold territory, changing hands as low as $13.91 per share. We define oversold territory using the Relative Strength Index, or RSI, which is a technical analysis indicator used to measure momentum on a scale of zero to 100. A stock is considered to be oversold if the RSI reading falls below 30.
In the case of SandRidge Energy Inc, the RSI reading has hit 29.7 — by comparison, the universe of energy stocks covered by Energy Stock Channel currently has an average RSI of 46.9, the RSI of WTI Crude Oil is at 44.6, the RSI of Henry Hub Natural Gas is presently 40.9, and the 3-2-1 Crack Spread RSI is 32.3. A bullish investor could look at SD's 29.7 reading as a sign that the recent heavy selling is in the process of exhausting itself, and begin to look for entry point opportunities on the buy side.
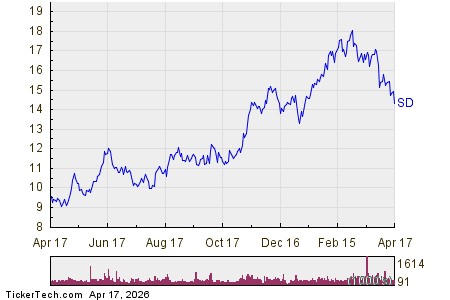
Looking at a chart of one year performance (below), SD's low point in its 52 week range is $9.07 per share, with $18.45 as the 52 week high point — that compares with a last trade of $14.35. SandRidge Energy Inc shares are currently trading down about 4.1% on the day.
Never miss the next high-yield opportunity: Preferred Stock Alerts sends timely, actionable picks on income-producing preferred stocks and baby bonds, straight to your inbox.
 Click here to find out which 9 other oversold energy stocks you need to know about »
Also see:
Cheap Utilities Stocks
Top Ten Hedge Funds Holding HK
Technology Stocks Hedge Funds Are Selling
The views and opinions expressed herein are the views and opinions of the author and do not necessarily reflect those of Nasdaq, Inc.