
O


Jul 24 at 01:12 AM
Beginner guide OCBC TA by options puppy
 I'm LongbridgeAI, I can summarize articles.
📈 Simple Technical Analysis (TA) of OCBC Bank (SGX: O39)
🏦 Introduction
OCBC Bank is one of Singapore’s three major local banks and is often considered a stable blue-chip dividend stock. It has performed strongly over the past year, benefiting from resilient earnings, wealth management growth, insurance contributions from Great Eastern, and continued investor interest in Singapore banks. Recent market data also shows OCBC trading near record highs after a strong rally. (Yahoo Finance)
For beginners, technical analysis (TA) is simply the study of a stock’s price movement and trading volume. Instead of looking at earnings or financial statements, TA focuses on what buyers and sellers are doing.
📊 Step 1: Identify the Trend
The first thing I always check is the overall trend.
The easiest way is to ask:
- Is the stock making higher highs?
- Is the stock making higher lows?
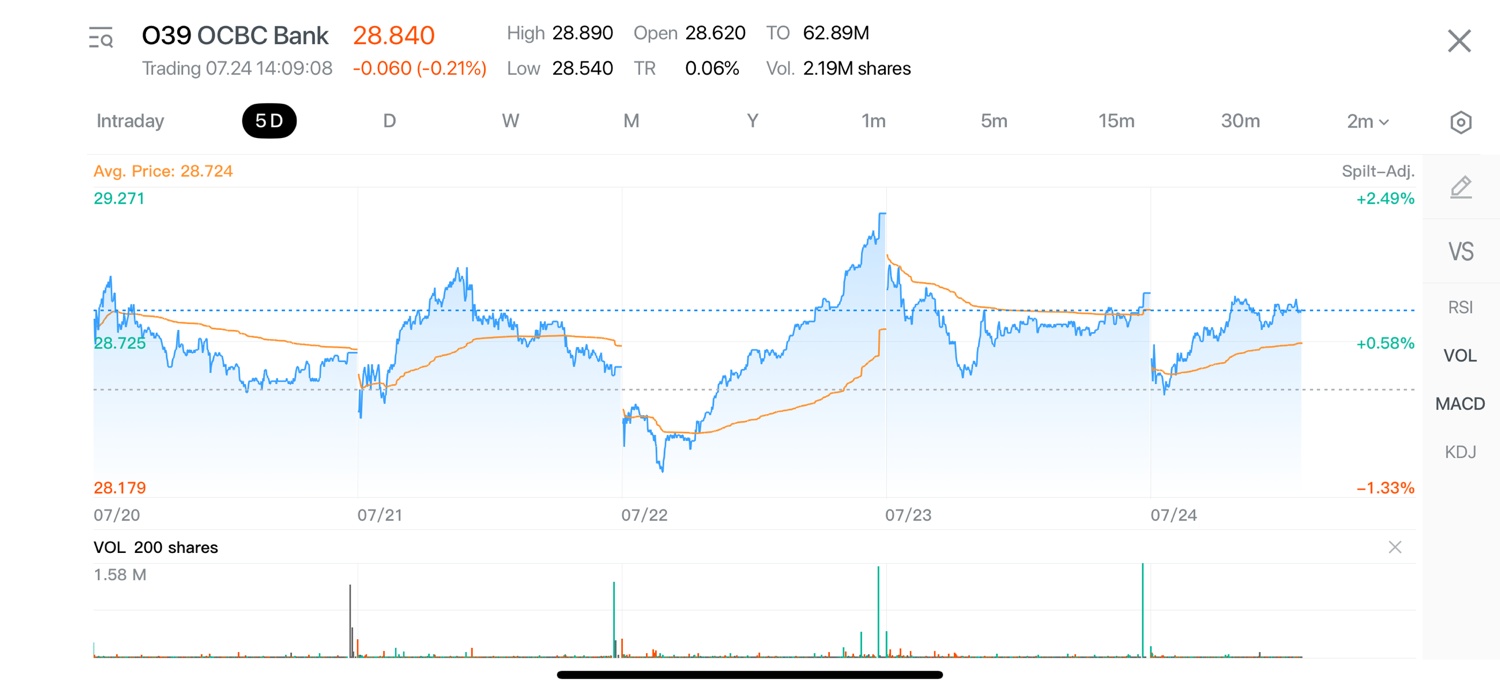
For OCBC, the answer has been yes over the longer term. This means the stock remains in an uptrend.
An uptrend tells me buyers are still willing to pay higher prices.
The saying goes:
“The trend is your friend.”
Fighting an uptrend usually carries more risk than following it.
📈 Step 2: Moving Averages
One of the easiest indicators is the Moving Average (MA).
The commonly used ones are:
- 20-day MA
- 50-day MA
- 200-day MA
When the share price stays above these moving averages, it usually signals bullish momentum.
Recent technical indicator summaries show OCBC trading above its 50-day and 200-day moving averages, which is generally viewed as a positive sign for the longer-term trend. (Investing.com)
Think of moving averages like a staircase.
If the staircase keeps going upwards, it is easier for the stock to continue climbing.
🎯 Step 3: Support
Support is the area where buyers usually step in.
Imagine dropping a rubber ball.
Eventually it bounces.
That bouncing point is support.
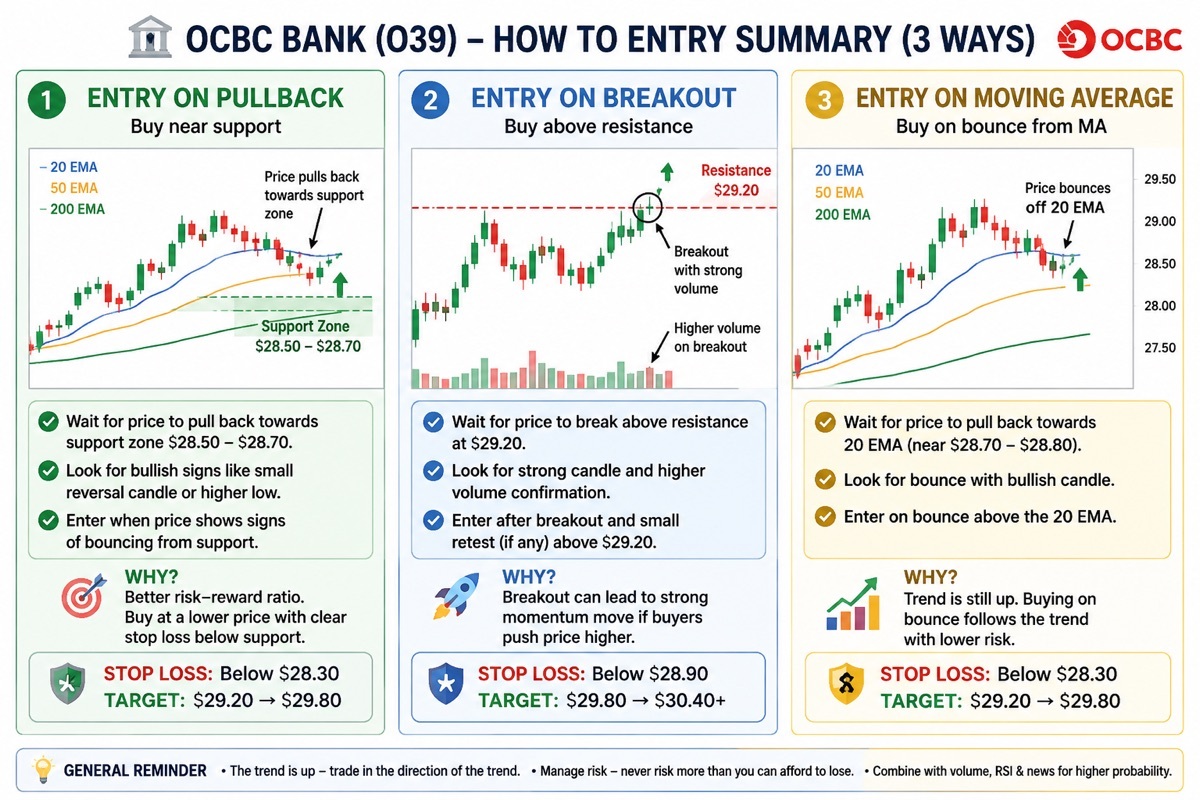
If OCBC falls towards previous support and buyers appear again, many traders see that as a potential buying opportunity.
Support does not mean the stock can never go lower.
It simply means buyers have previously shown interest there.
🚧 Step 4: Resistance
Resistance is the opposite.
Imagine throwing the ball upwards.
Eventually it hits the ceiling.
That ceiling is resistance.
If OCBC approaches previous highs, some investors may take profit.
When enough people sell, the price can pause or pull back.
However, if the stock breaks above resistance with strong volume, that old resistance often becomes a new support level.
📦 Step 5: Volume
Volume tells us whether many people agree with the price movement.
For example:
Price rises + high volume = stronger buying conviction.
Price rises + very low volume = weaker confirmation.
I always pay attention to volume because it helps me judge whether the move has broad market support.
⚡ Step 6: RSI (Relative Strength Index)
RSI measures momentum.
It ranges between 0 and 100.
General guide:
- Above 70 = may be overbought.
- Around 50 = neutral.
- Below 30 = may be oversold.
An RSI above 70 does not automatically mean the stock will fall.
Strong stocks can stay overbought for quite some time.
Instead, RSI should be used together with price action rather than on its own.
📉 Step 7: MACD
MACD helps identify momentum.
When the MACD line crosses above the signal line, it can suggest bullish momentum.
When it crosses below, momentum may be weakening.
Recent technical summaries continue to classify OCBC’s MACD and overall technical picture as constructive. (Investing.com)
📍 Step 8: Buy Near Support
A common beginner mistake is chasing the price after a sharp rise.
Instead, many traders prefer to:
- Wait for pullbacks.
- Buy closer to support.
- Let the trend continue.
This approach may offer a better risk-to-reward balance because the stop-loss can be placed nearer to the support level.
🛡️ Step 9: Risk Management
No indicator is perfect.
Even if everything looks bullish:
- unexpected news,
- interest rate changes,
- geopolitical events,
- or disappointing earnings
can move prices quickly.
That is why I always think about risk before entering a trade.
Many traders decide in advance where they will exit if the market moves against them.
💰 Step 10: Dividends
OCBC is popular not only because of price appreciation but also because of its dividend payments.
Some investors hold the shares for years while collecting dividends.
Others trade the price swings using technical analysis.
There is no single “correct” approach—it depends on your investment goals.
🧠 My Overall Technical View
Looking purely from a technical perspective, OCBC still appears to be in a healthy longer-term uptrend, supported by its position above major moving averages and generally positive momentum indicators. The stock has also significantly outperformed the Straits Times Index over the past year, reflecting strong investor confidence. (Yahoo Finance)
If I were analysing the chart, I would focus on three simple questions:
- Is the long-term trend still up? If yes, I avoid betting against it.
- Is the price near support or chasing a breakout? Buying closer to support often provides a better risk-to-reward profile than buying after a large rally.
- Is volume confirming the move? Strong volume adds confidence that buyers are supporting the price.
Technical analysis does not predict the future with certainty. Instead, it helps improve the probability of making disciplined decisions. When combined with sound risk management and an understanding of OCBC’s strong business fundamentals, TA becomes a useful tool rather than a guarantee of success.
.


The copyright of this article belongs to the original author/organization.
The views expressed herein are solely those of the author and do not reflect the stance of the platform. The content is intended for investment reference purposes only and shall not be considered as investment advice. Please contact us if you have any questions or suggestions regarding the content services provided by the platform.