
SOFI $15 key level scan
 I'm LongbridgeAI, I can summarize articles.
$SoFi Tech(SOFI.US) Current technical data
Current price: $15.69 (ET 5/20 close / Beijing time 5/21 04:00), single-day +3.02% rebound
30-day trend: Mid-term decline – 4/22 $19.06 → 4/29 $15.53 (single-day -16% plunge after Q1 earnings) → continued gradual decline to 5/19 low of $14.92 → 5/20 rebound to $15.69
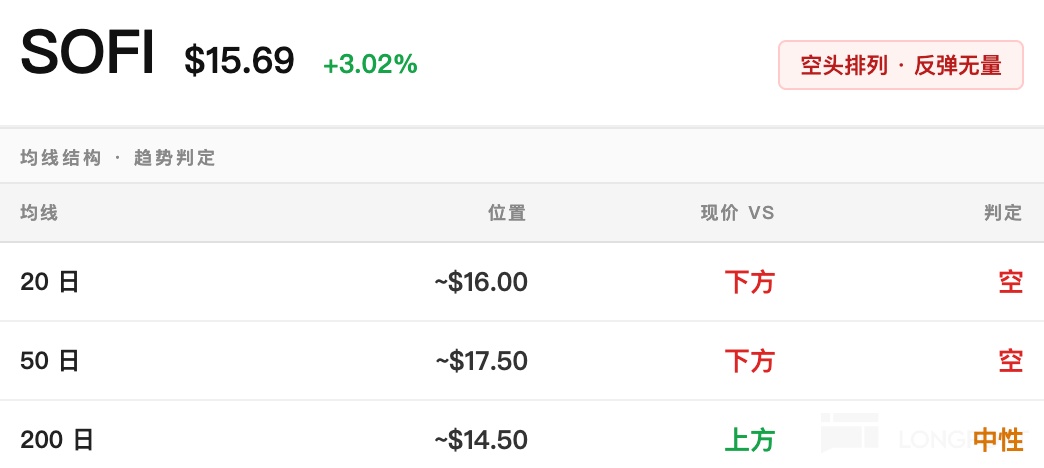
Moving average alignment (based on recent 30 days):
20-day MA ≈ $16.00
50-day MA ≈ $17.50
200-day MA ≈ $14.50
Current price $15.69 is below the 20-day, below the 50-day, and above the 200-day – a typical bearish alignment, but hasn't broken the long-term moving average yet, so the technical picture isn't completely bearish.
Moving average dynamics: The 20D crossing below the 50D to form a "death cross" is confirmed, with the trend dominated by bears; but the 200D long-term moving average hasn't been broken, meaning this is a mid-term correction, not a long-term trend reversal.
Recent volume characteristics:
4/29 earnings day volume: 200 million shares, 3x the usual – concentrated sentiment release
5/4-5/18 volume returned to the 50-90 million share range – digestion phase
5/19 low day volume: 63.76 million shares, 5/20 rebound only 44.62 million shares – rebound with low volume, beware of a fake rebound
RSI status (inferred): After a continuous drop from $19 to $14.92, RSI is likely in the 30-40 oversold edge range. The 5/20 rebound is a technical correction and may not be sustained.
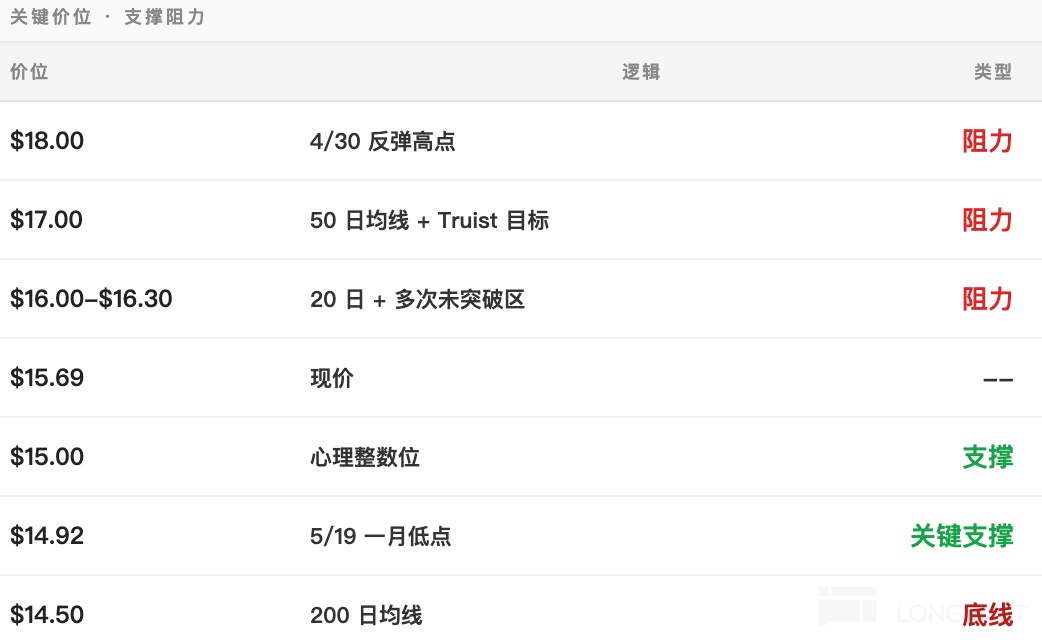
Recent resistance / support distribution:
- Short-term resistance $16.0-$16.3 (20-day MA + multiple failed breakout area from 5/11-5/18)
- Mid-term resistance $17.0 (50-day MA + Truist target price)
- Psychological resistance $18.0 (4/30 rebound high)
- Short-term support $15.00 (psychological round number)
- Key support $14.92 (5/19 one-month low)
- Long-term support $14.50 (inferred 200-day MA level)
- Risk level $14.00 (if it falls below the 200D, the mid-term trend deteriorates)
Catalyst background: 5/12 Truist lowered target price to $17, 5/18 "SOFI YTD -40% / OpenAI adds competitive pressure" – no clear fundamental support for a rebound in the short term.
Three key price levels + Risk-reward ratio
Entry point: Go long around $15.30
Reason: The current rebound to $15.69 is still below the 20-day and has low volume, not recommended to chase. Wait for a retest of the $15.30 consolidation area from 5/19-5/20 with increased volume and stability as a batch entry point.
Stop-loss level: $14.50
Reason: Inferred 200-day MA level + key psychological round number. A break below indicates a deteriorating mid-term trend, don't catch a falling knife.
Target level: $17.00
Reason: Triple overlap of 50-day MA + Truist target price + psychological round number. This is a reasonable neckline for a mid-term rebound. The institutional consensus target of $21.10 is too far for the first target.
Risk-reward ratio:
Potential profit = $17.00 - $15.30 = $1.70
Potential risk = $15.30 - $14.50 = $0.80
R:R = 2.1:1
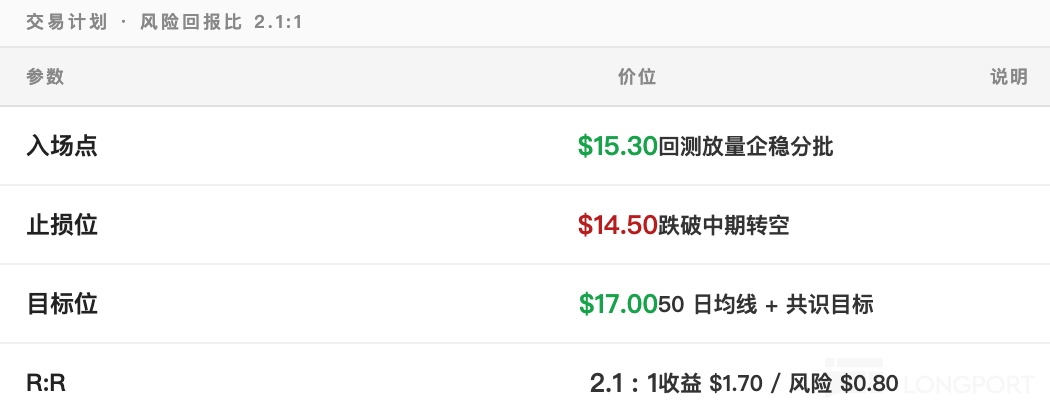
SOFI's $14.92 on 5/19 might be a stage bottom, but the 5/20 rebound has low volume and the bearish alignment isn't broken, don't chase the current $15.69 price. Wait for a retest around $15.30 with increased volume and stability before entering. An R:R of 2.1:1 is reasonable, with a single position not exceeding 2% of total capital. If it directly breaks below $14.92 and probes $14.50, a long-term value buying point appears, and you can add in batches.
My final stance: Wait and watch + wait for a retest, don't chase today's +3% rebound.


The copyright of this article belongs to the original author/organization.
The views expressed herein are solely those of the author and do not reflect the stance of the platform. The content is intended for investment reference purposes only and shall not be considered as investment advice. Please contact us if you have any questions or suggestions regarding the content services provided by the platform.